The State of London Report 2025
In June 2025, the GLA’s City Intelligence Unit released the sixth edition of its State of London report, a wide-ranging statistical publication presenting a comprehensive overview of London’s current economic and social conditions. Drawing from over 100 datasets across 11 policy domains, the report tracks key indicators that underpin the work of the Mayor, the London Assembly, and wider stakeholders across the capital. These include themes such as demography, housing, environment, social justice, skills, crime and safety, transport, and the economy. This edition of the report is also structured around a series of 25 ‘London-level outcomes’ – aspirational outcomes the Mayor and the GLA want to see in London, e.g. ‘Stable, long-term economic growth benefits all Londoners’.
This supplement presents a high-level summary of key economic and labour market findings from the latest State of London publication. It also highlights selected structural challenges facing the capital in relation to inequality, housing affordability, and economic resilience. Readers are encouraged to consult the full report at: https://data.london.gov.uk/dataset/state-of-london for further information and to access the accompanying State of London dashboard which includes all the charts from the report.
Economic Growth and Sectoral Performance
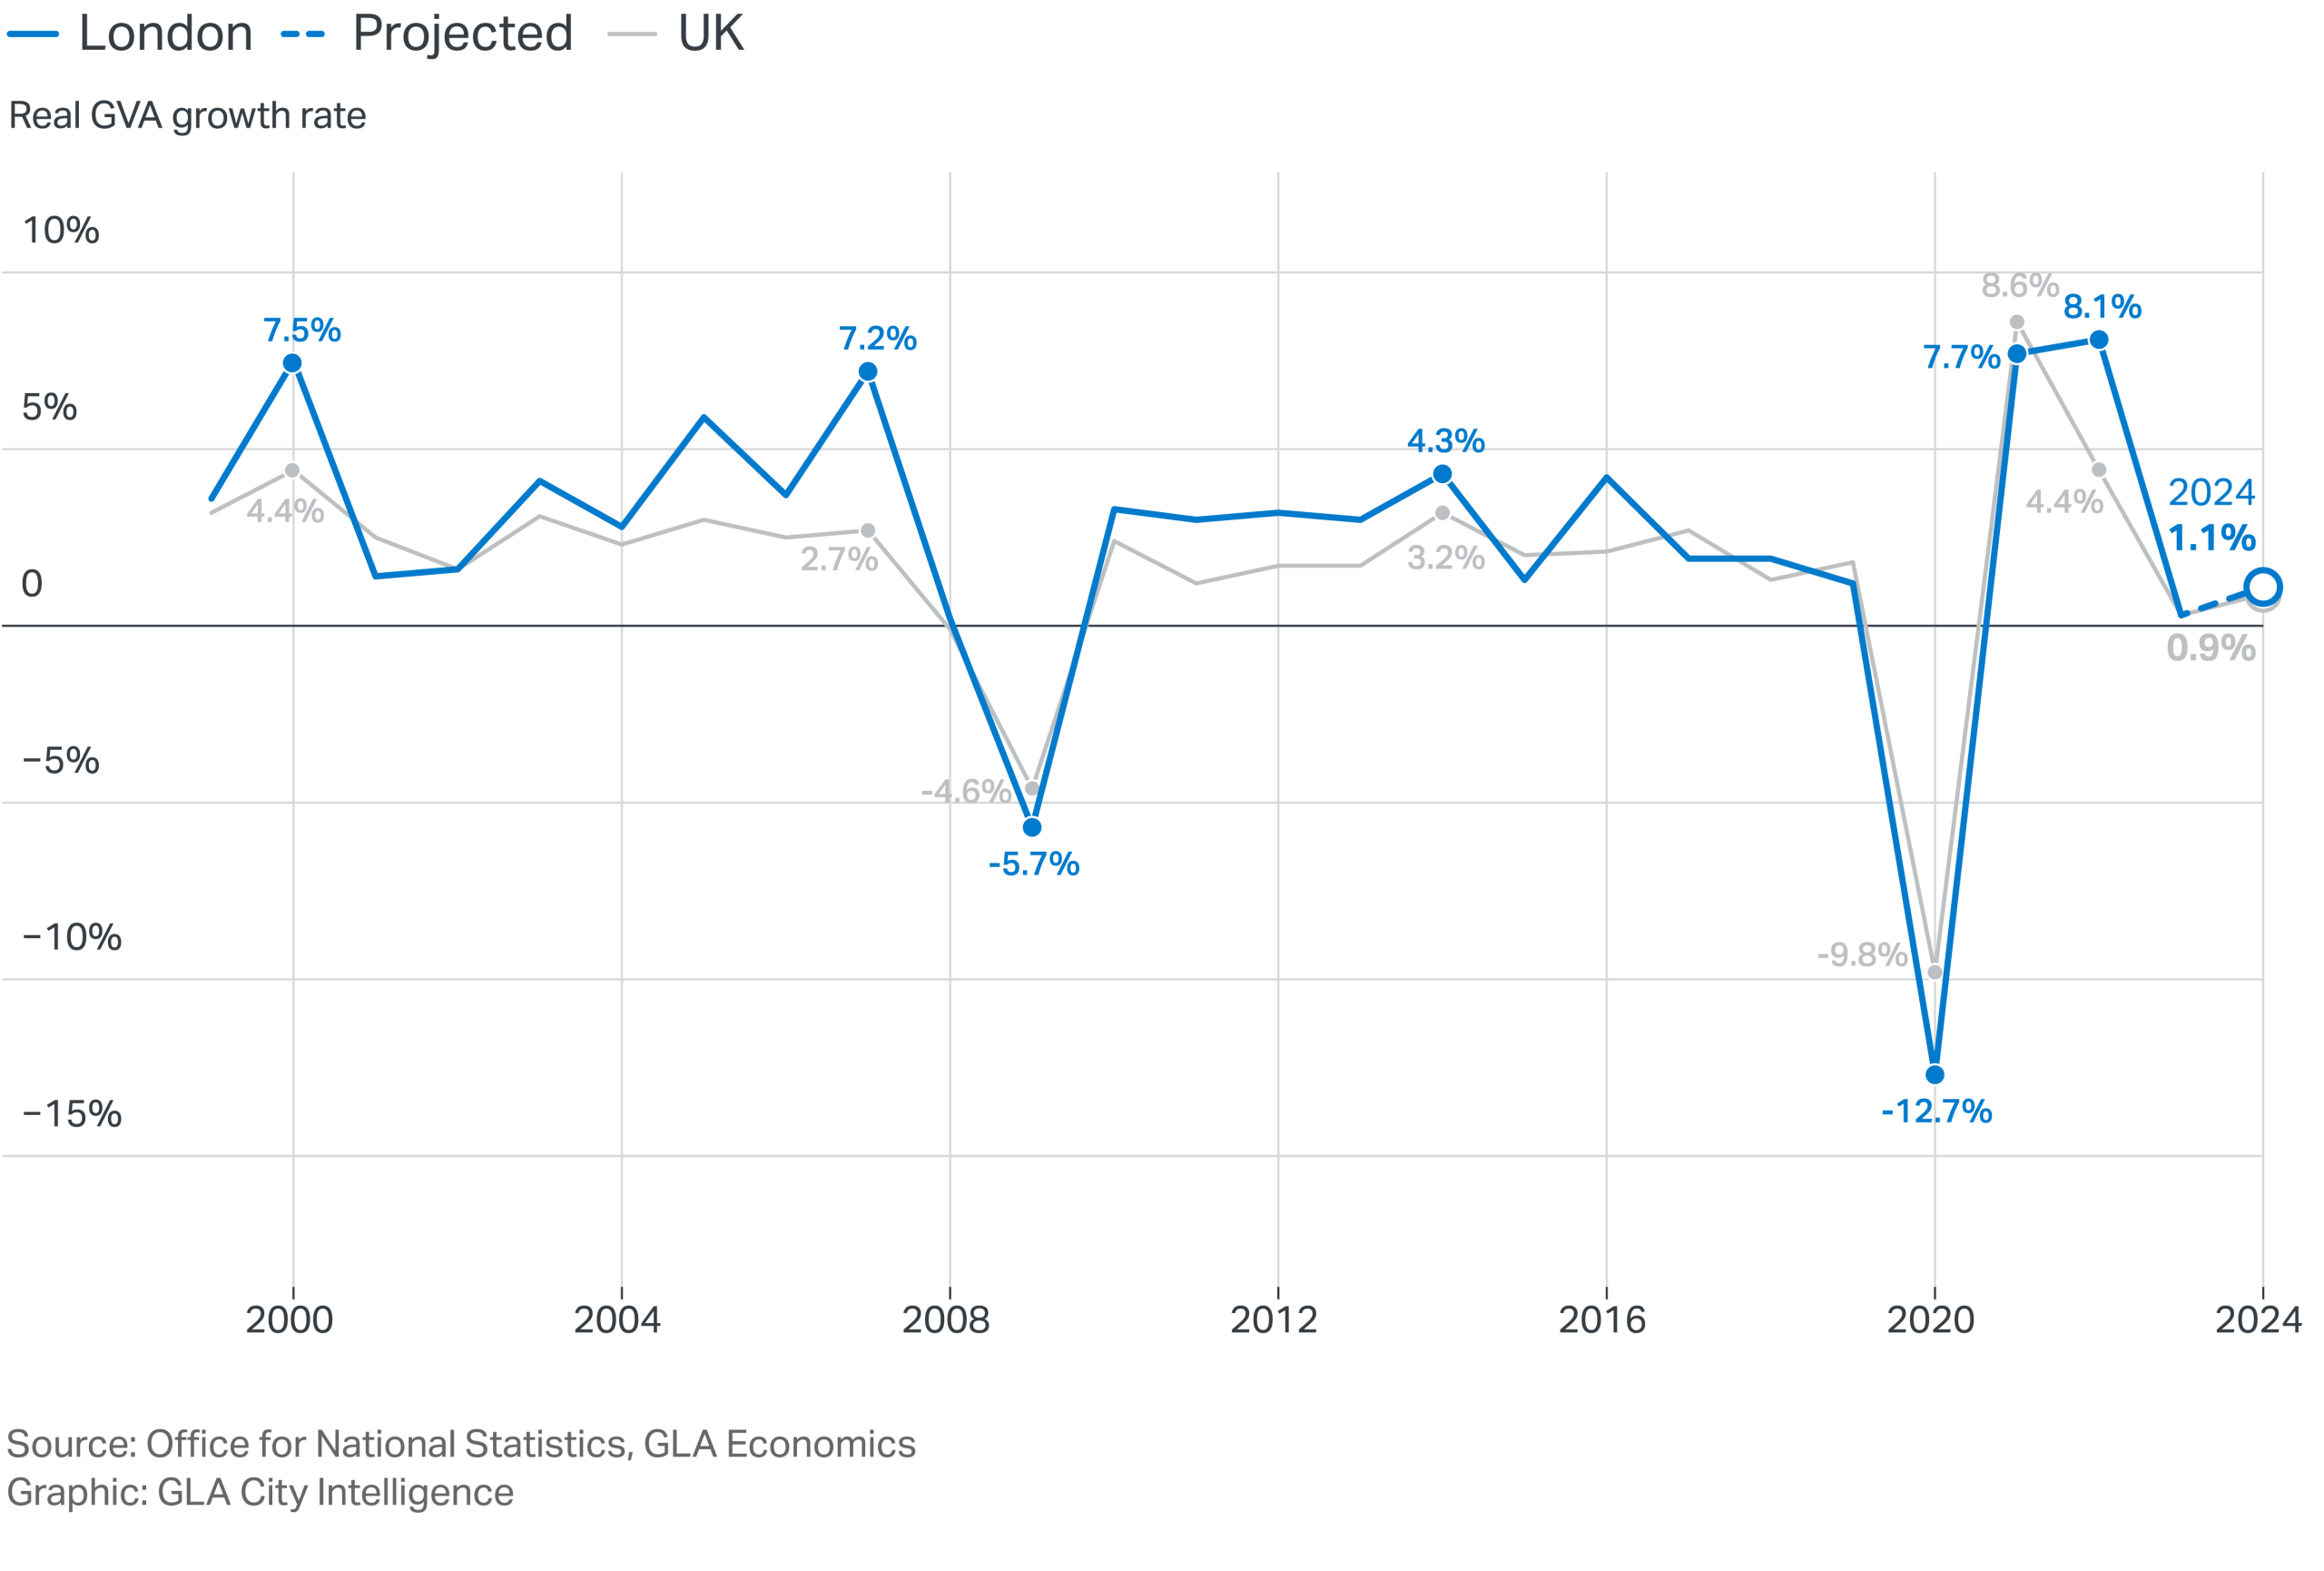
Using ONS data, GLA Economics estimates that London’s real Gross Value Added (GVA) increased by 1.1% in 2024, following marginal growth of 0.3% in 2023 (Figure A1). This marked a cooling from the sharp post-pandemic rebound and high growth rates seen in 2021 (7.7%) and 2022 (8.1%). This cooling of GVA growth in the past two years is not unique to London but rather reflects the trend of national growth.
Historically, London has outpaced the UK average in terms of output growth. From 1999 through to 2007, London’s economy performed particularly strongly with growth averaging 4.2% per annum. In the period following the financial crisis from 2010-2019, the average annual growth rate slowed to 2.7%. Since the pandemic, London has more closely tracked the UK average growth rate with the exception of 2022, when it is estimated growth was as high as 8.1% in London compared to 4.4% in the UK.
Figure A1: London’s economic growth rate
Real Gross Value Added (GVA) growth rate (percentage), London vs UK, 1999 -2024
The slowdown in growth since the financial crisis is often attributed to London’s weak productivity performance. ONS regional productivity data reveals that real GVA per hour worked in the capital actually declined by 2.7% between 2019 and 2022, even as productivity nationally, measured this way, increased by 2.5% (Figure A2). London’s productivity has long outpaced other UK regions, but the recent decline reflects both compositional changes and a weakening of agglomeration effects in a more dispersed post-COVID workplace[1].
Despite this, London remains the UK’s most productive region, with GVA per hour worked 26% higher than the UK average in 2022 (£51.70 vs. £41.00).
Figure A2: London’s productivity over time
Real GVA per hour worked (2019 = 100), London and the UK.
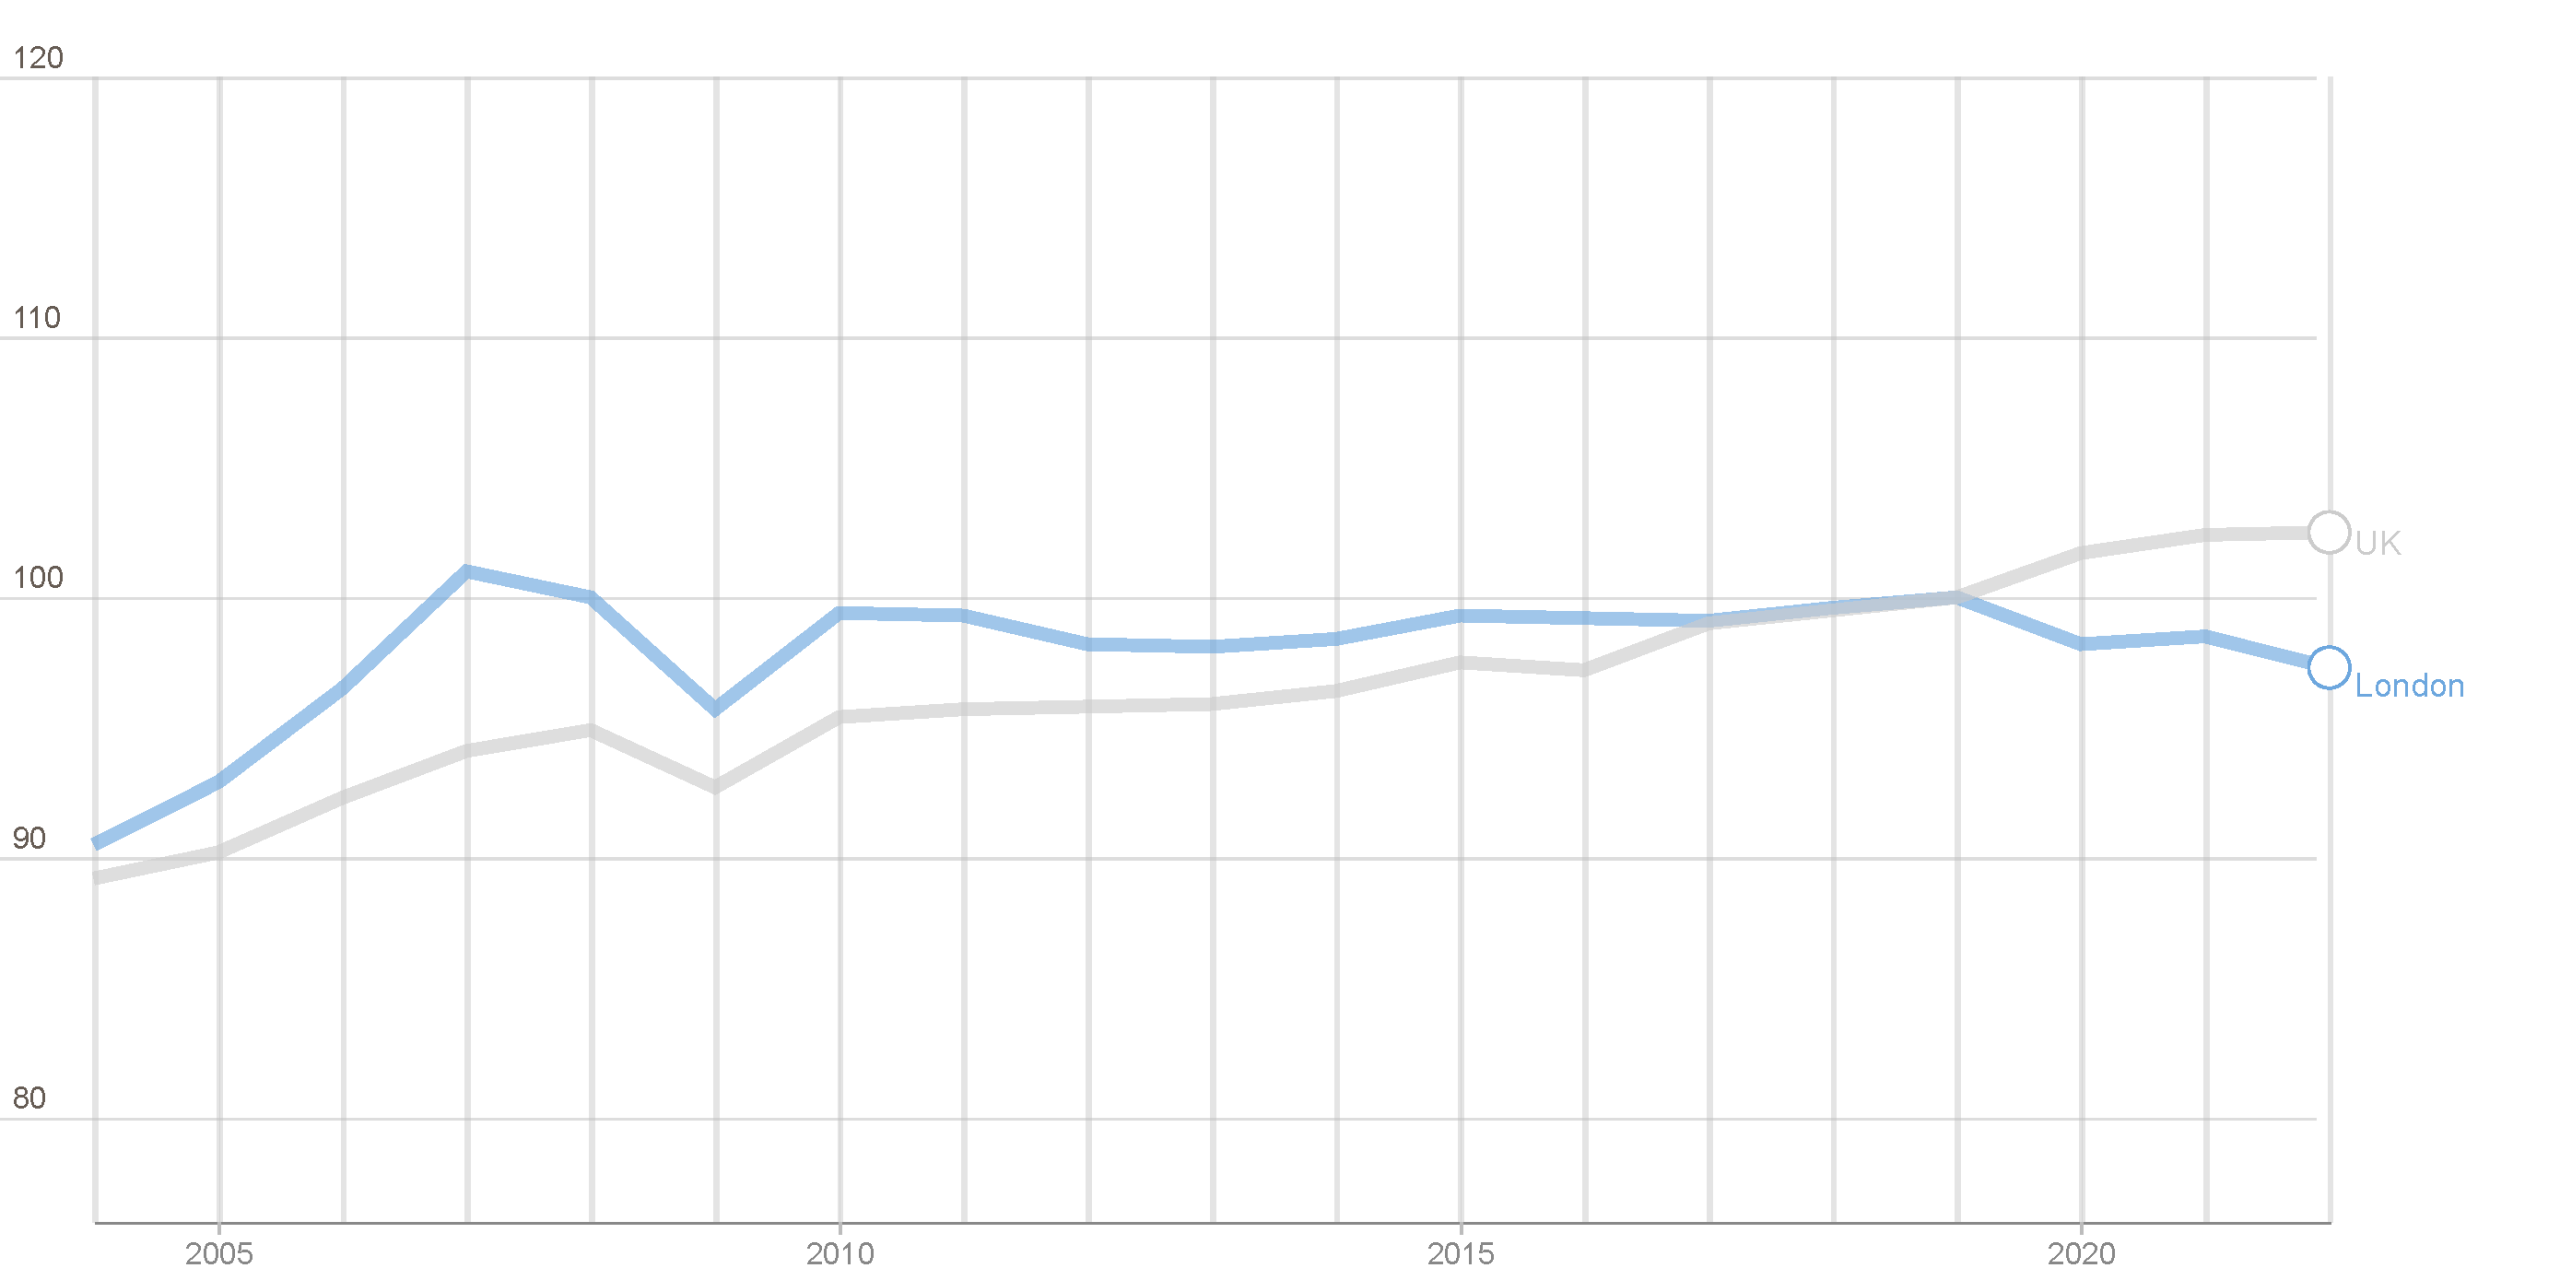
Source: ONS regional productivity
Examining the change in economic output by industry from 2019-2023 (Figure A3), the data reveals that London’s recovery has been distributed unevenly across the various sectors. High-value sectors such as information & communications, education, and professional & technical activities have generally outperformed while sectors that rely on face-to-face interaction such as transport & storage, human health & social work, and construction have lagged.
Figure A3: Change in economic output by industry
Percentage change in real GVA by industry in London 2019 – 2023
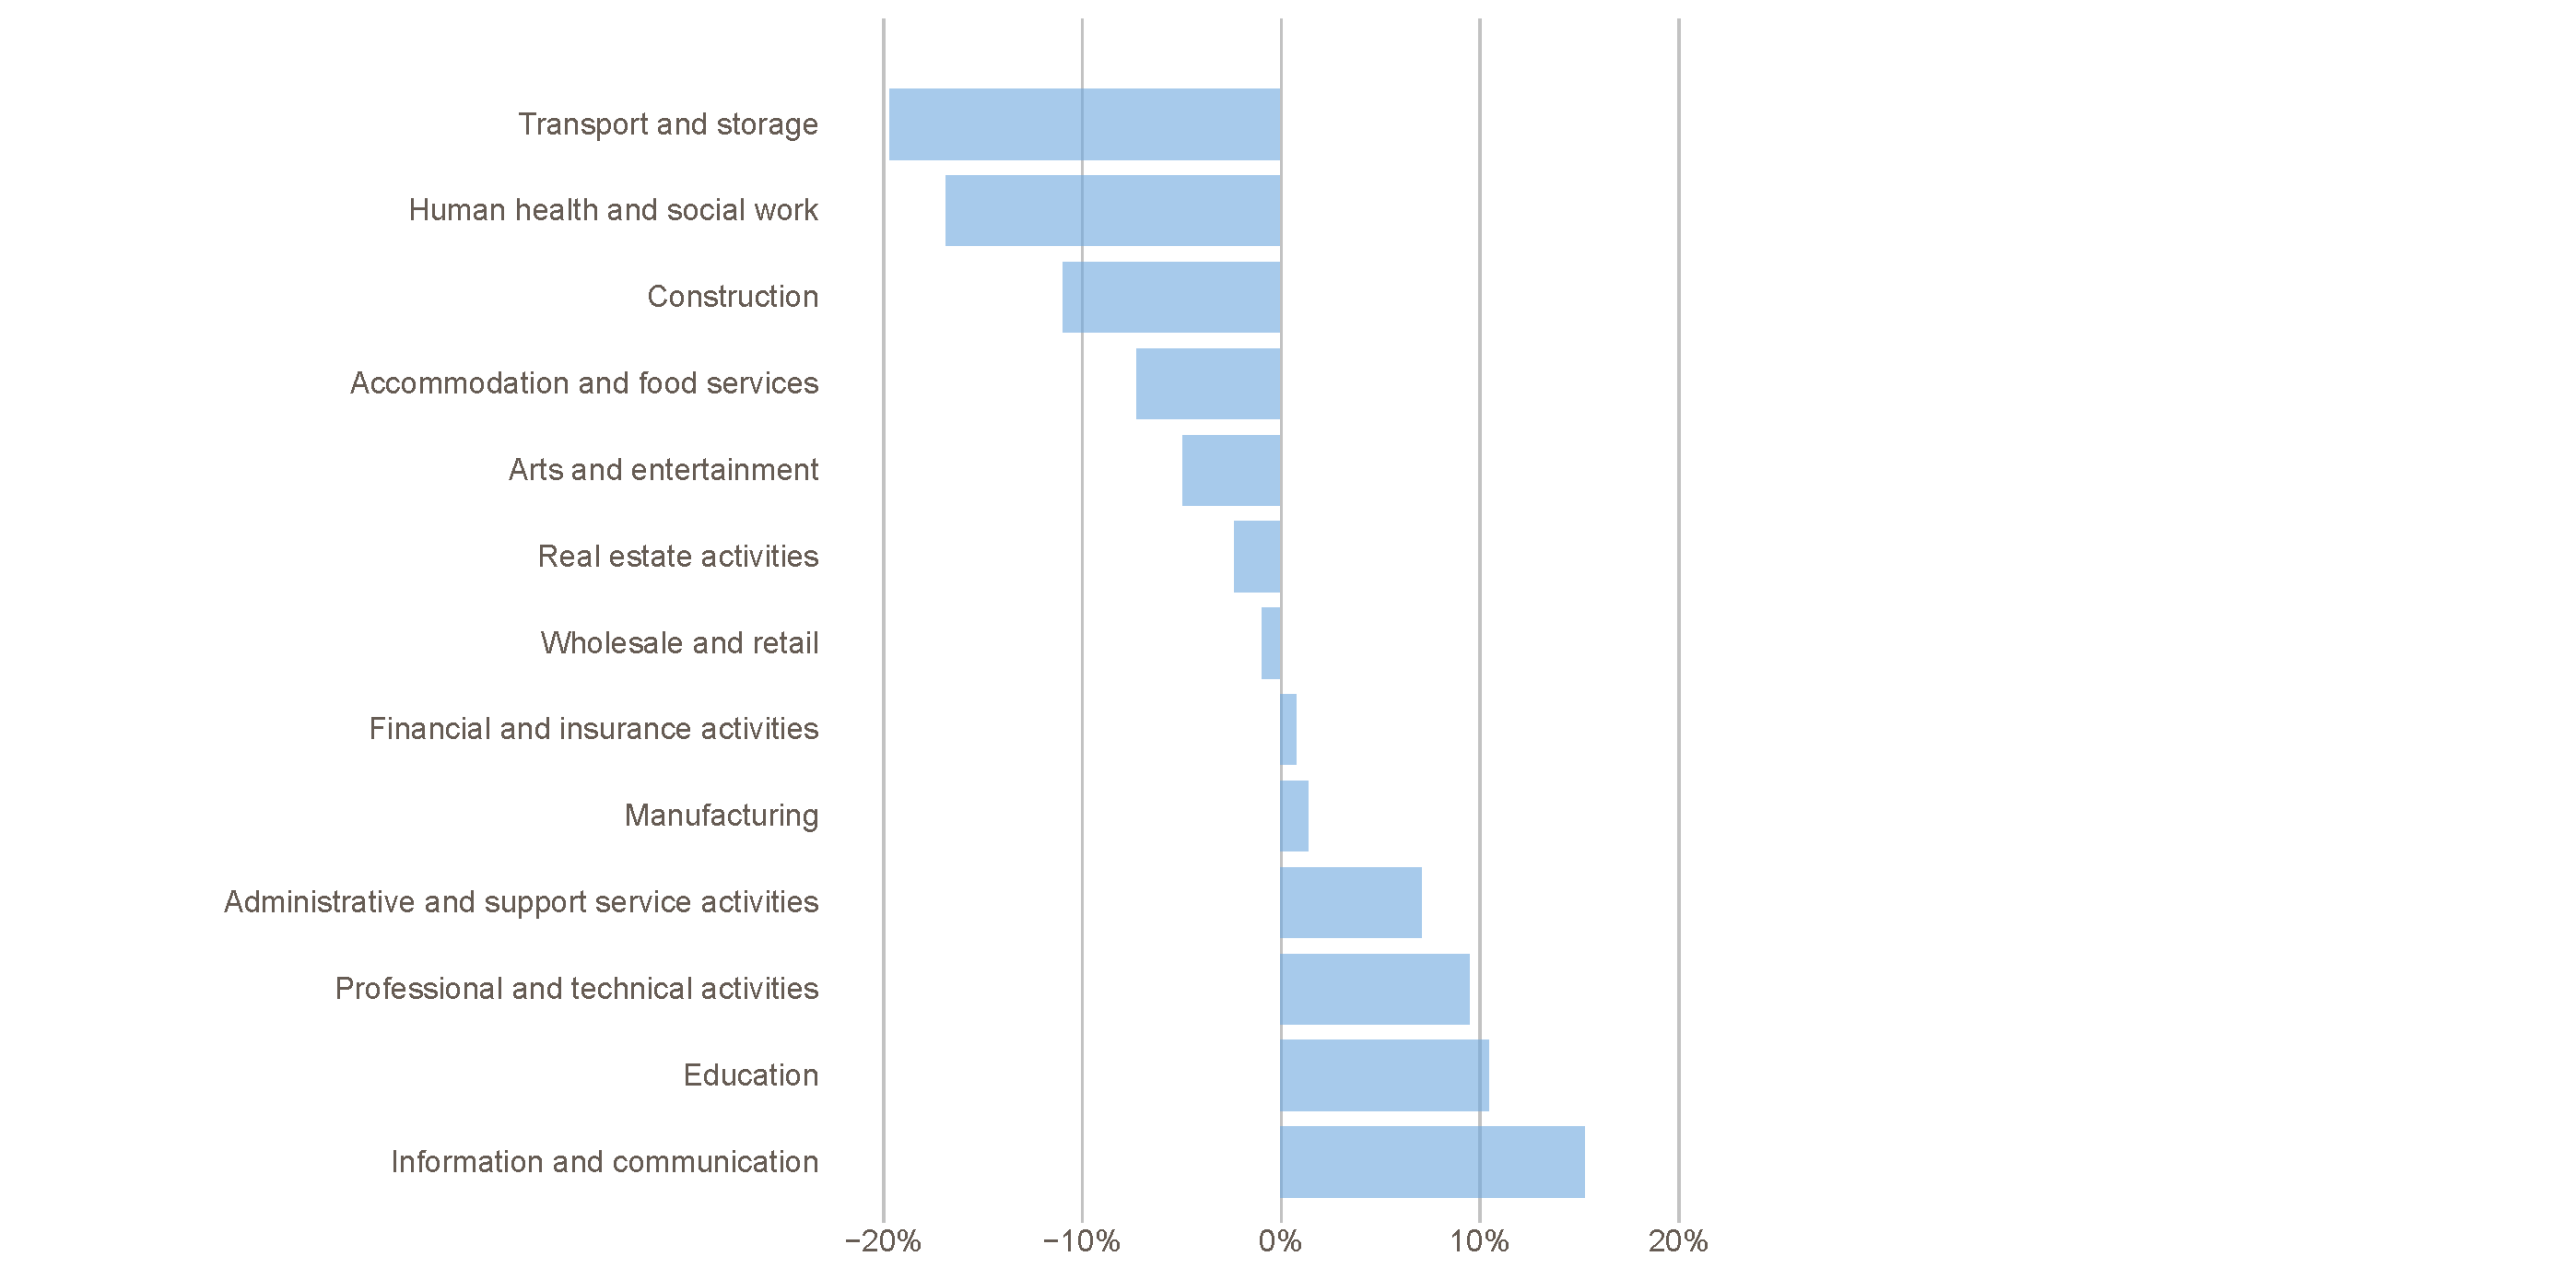
Source: GLA Economics based on ONS – UK regional GVA and GDP data. The following smaller industries have been excluded for simplification purposes: Primary sector and utilities, Public administration and defence, Other service activities, and Activities of households.
Information and communication expanded by over 15% relative to 2019, supported by ongoing demand for digital infrastructure, content, and services. Education and professional & technical activities also recorded strong growth -approximately 10-11% above pre-pandemic output. Transport & storage remain nearly 20% below its 2019 level – among the largest sectoral declines – reflecting continued changes in commuting, logistics and personal mobility. Human health & social work, accommodation & food services, and arts & entertainment also remain below pre-pandemic benchmarks.
Global Investment, Business Resilience and Tourism
Despite more recent sluggish economic growth, London continues to perform strongly in global competitiveness rankings. In 2024, the city ranked:
- 1st in the Anholt City Brands Index
- 1st in the Global Power City Index
- 2nd in the Kearney Global Cities Index
- 2nd in the Schroders Global Cities Index
These rankings highlight London’s continued strengths in areas such as international connectivity, skilled labour, innovation, business infrastructure, and culture. They provide evidence of London’s ongoing role as a major centre for global business and economic activity.
London’s strong global position continues to translate into real economic outcomes, particularly in attracting investment. Foreign Direct Investment (FDI) activity remained strong in 2024, with the capital securing 439 projects amounting to £7.1 billion in capital expenditure according to fDi Markets data[2]. While annual totals remain below the 2018 peak of £9.7 billion, investment levels in early 2024 suggest renewed momentum.
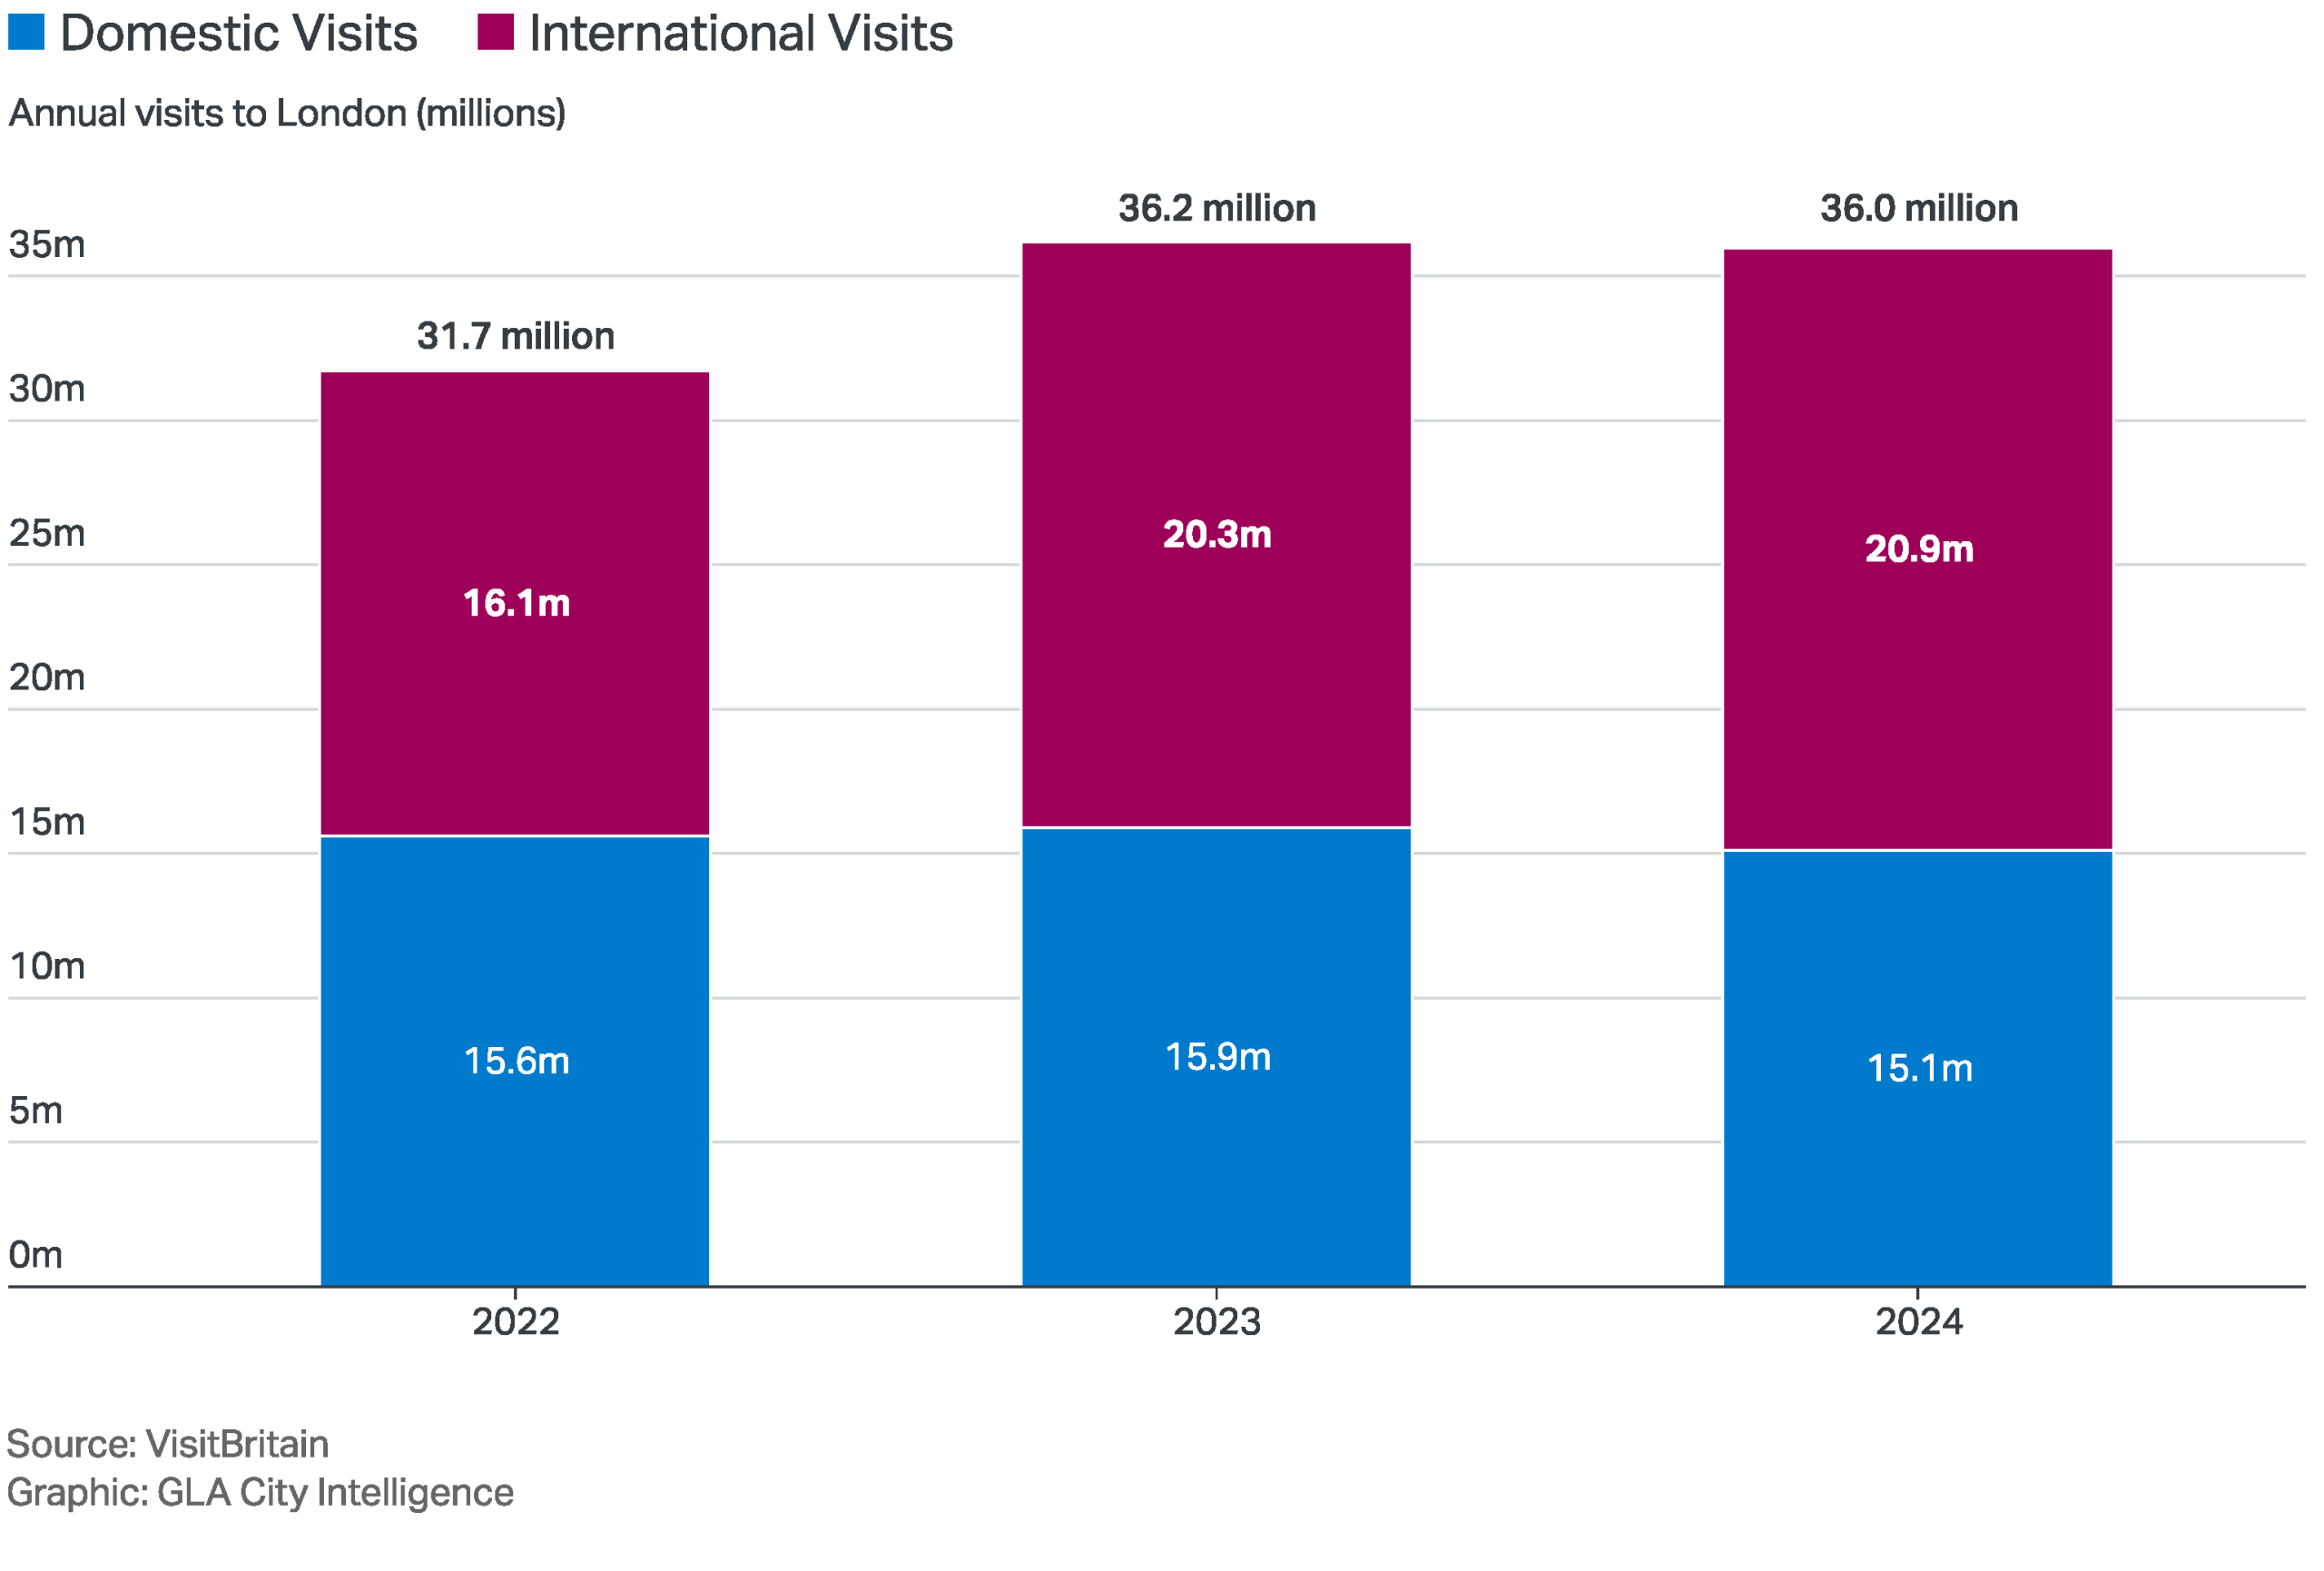
The city’s global appeal and improving business climate have also helped fuel a rebound in tourism (Figure A4). According to VisitBritain, total visits to London rose from 31.7 million in 2022 to nearly 36 million in 2024. This growth was driven primarily by international visitors, whose numbers increased from 16.1 million to 20.9 million over the same period. Domestic tourism remained relatively stable, although it dipped slightly in 2024 to 15.1 million. Tourism-related spending has followed suit. Total visitor expenditure grew from £16.9 billion in 2022 to £18.8 billion in 2024 (in 2019 prices). Most of this increase came from international tourists, with spend rising from £12.4 billion to £14.2 billion.
Figure A4: Visits to London
Domestic and International visits to London, 2022, 2023 & 2024
Labour Market Outcomes
In July 2025, London’s employment rate stood at 74.9% and its unemployment rate was estimated at 6.2%[3]. While the employment rate is high by historical standards, a closer examination reveals variation in the quality of jobs held by many Londoners (Figure A5). GLA Economics has compiled a new ‘job quality’ score which examines various dimensions of job quality such as pay, contract type, hours, and progression along with an overall ‘average job quality score’. This suggests a slight decline in job quality since 2020. According to ONS Labour Force Survey data, approximately 57% of employed residents report positive opportunities for progression, and nearly one in five cite irregular or insecure working hours. Around a third of workers regularly perform unpaid overtime.
Figure A5: Job quality in London
Average job quality indicator and components, % share of employees, 2022
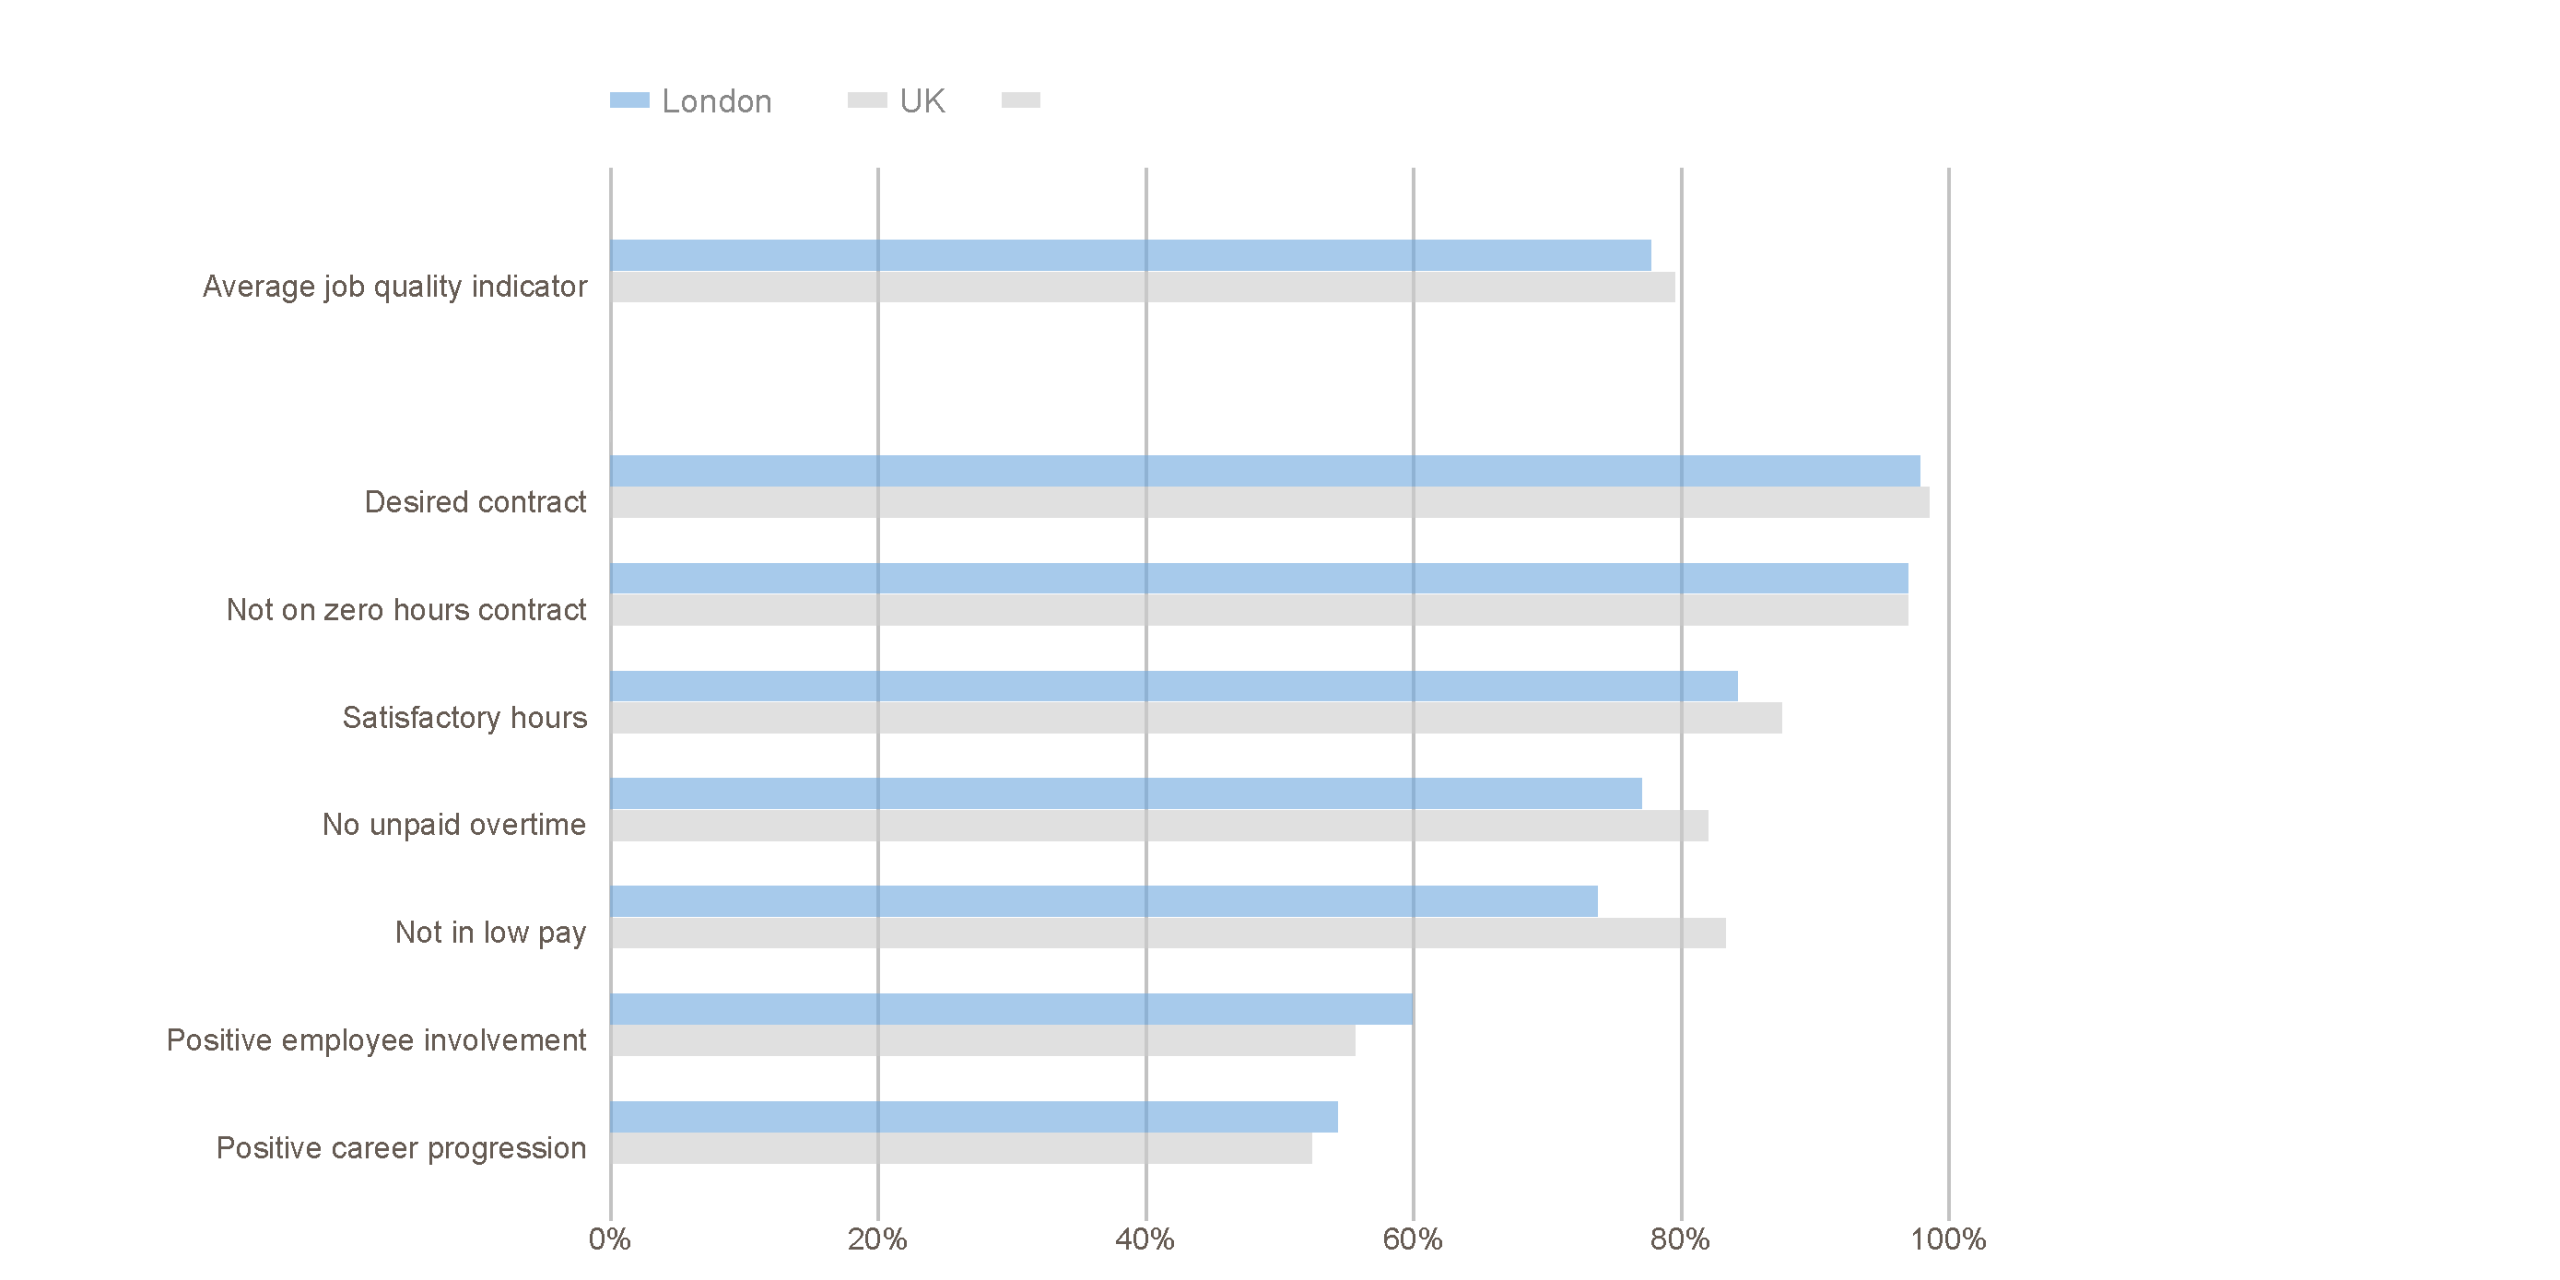
Source: ONS Labour Force Survey and GLA Economics
Income Inequality and Poverty
London remains the most unequal region in the UK with respect to household incomes. In 2022/23, DWP data revealed that the 90:10 income ratio after housing costs stood at 11.0 in London; in other words, the top decile of earners made 11 times more than the bottom decile (Figure A6). This is more than twice the UK average of 4.8, suggesting much higher income inequality. In absolute terms, the lowest-income Londoners earned 39% less than their counterparts elsewhere in the UK (after housing costs), while the highest decile earned 36% more.
Figure A6: Household income inequality
90:10 ratio of weekly equivalised household income (after housing costs), London and the UK (2021/22 – 2023/24, 2023/24 prices)
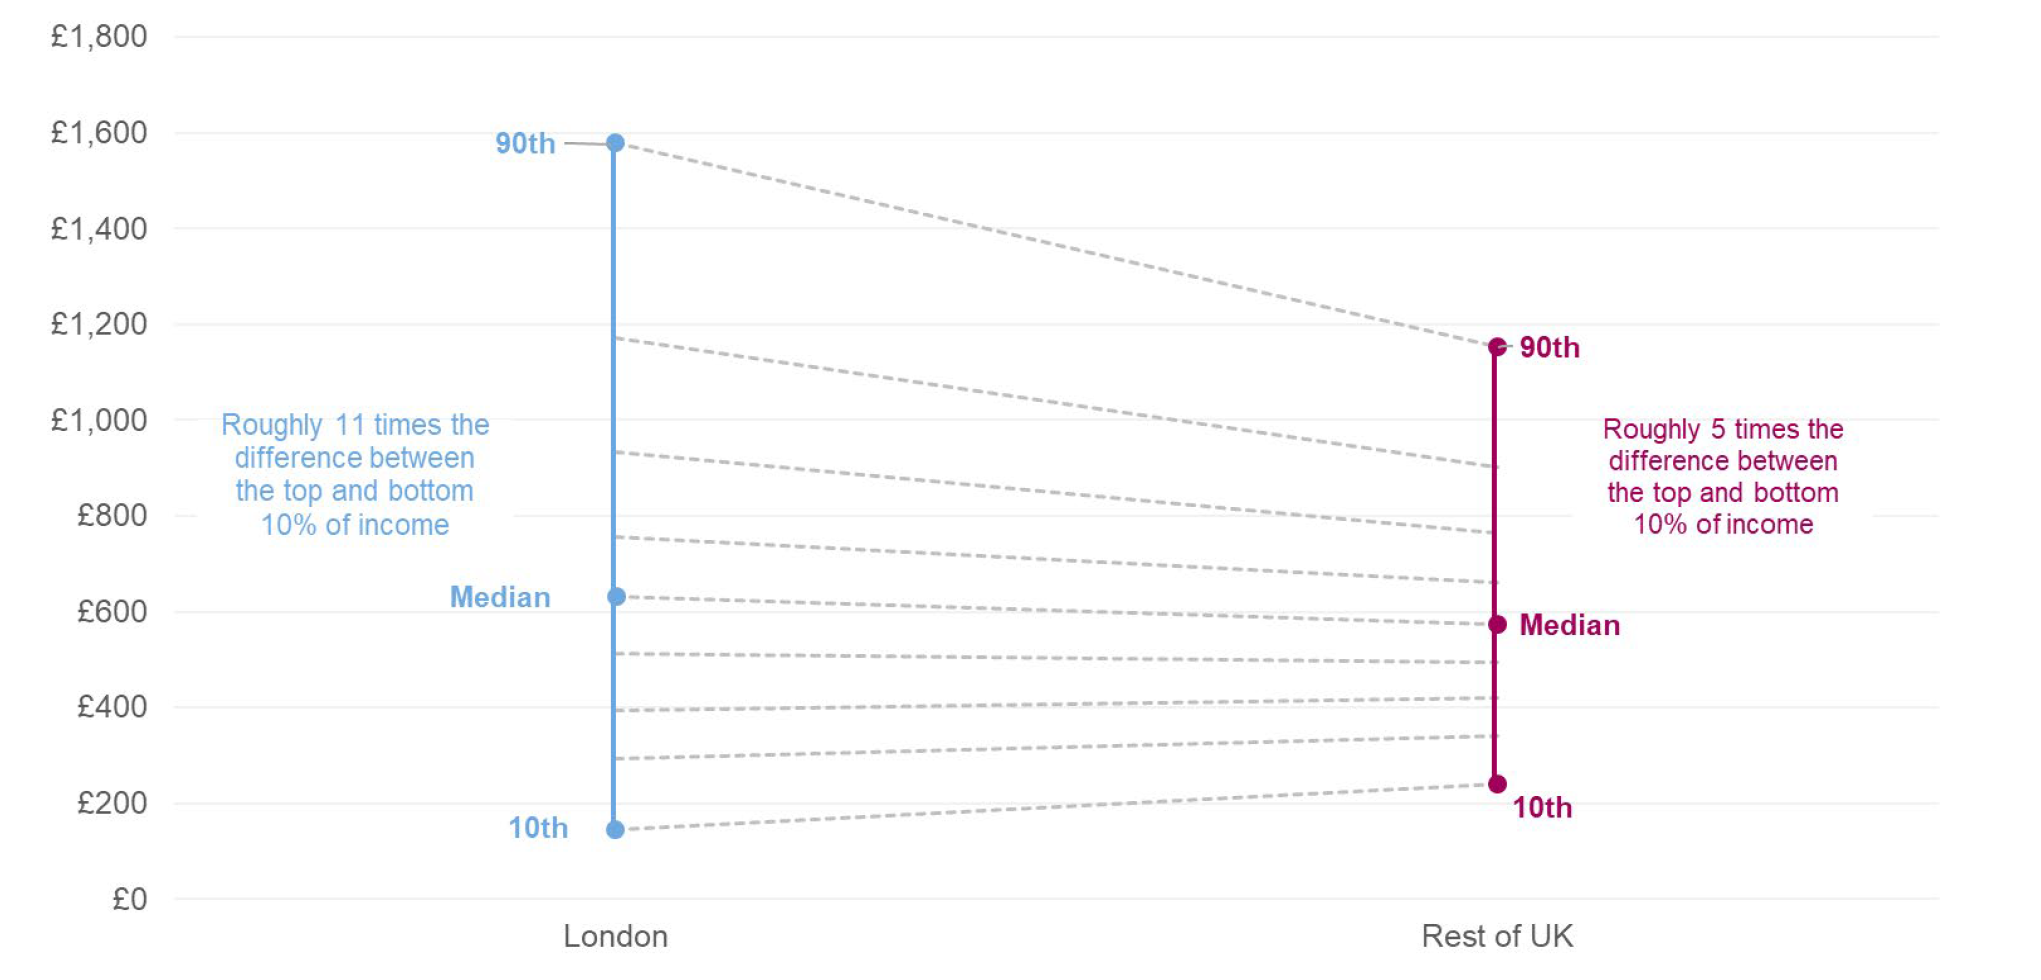
Source: GLA analysis of DWP HBAI data
Approximately 19% of Londoners (around 1.7 million people) live in relative poverty, defined as having income below 50% of the national median after housing costs. Across the UK, London is the region with the highest proportion of residents in relative poverty, with Inner London showing particularly high poverty incidence at 23%. Outer London, though lower at 18%, still has a higher poverty incidence than all other regions and countries of the UK. According to a YouGov survey Jan 2022-2025, around 17% of Londoners report that they are struggling financially[4]. Disabled Londoners, lower income groups, renters, Black Londoners and lower social grade Londoners were found to be more likely to say they were struggling financially.
Housing Access and Affordability
Housing affordability remains one of the most significant structural challenges in the capital. Housing supply has not kept pace with demand, resulting in rising costs across tenure types. As of early 2025, the average house price in London stood at £556,000, a value which is 107% higher than the UK average of £268,000.[5] The average private sector rents in London were £2,163 per month, 63% higher than the UK average of £1,326.[6]
Figure A7: Affordability in the private rental sector
Index of private rent, earnings and implied affordability (2015=100)
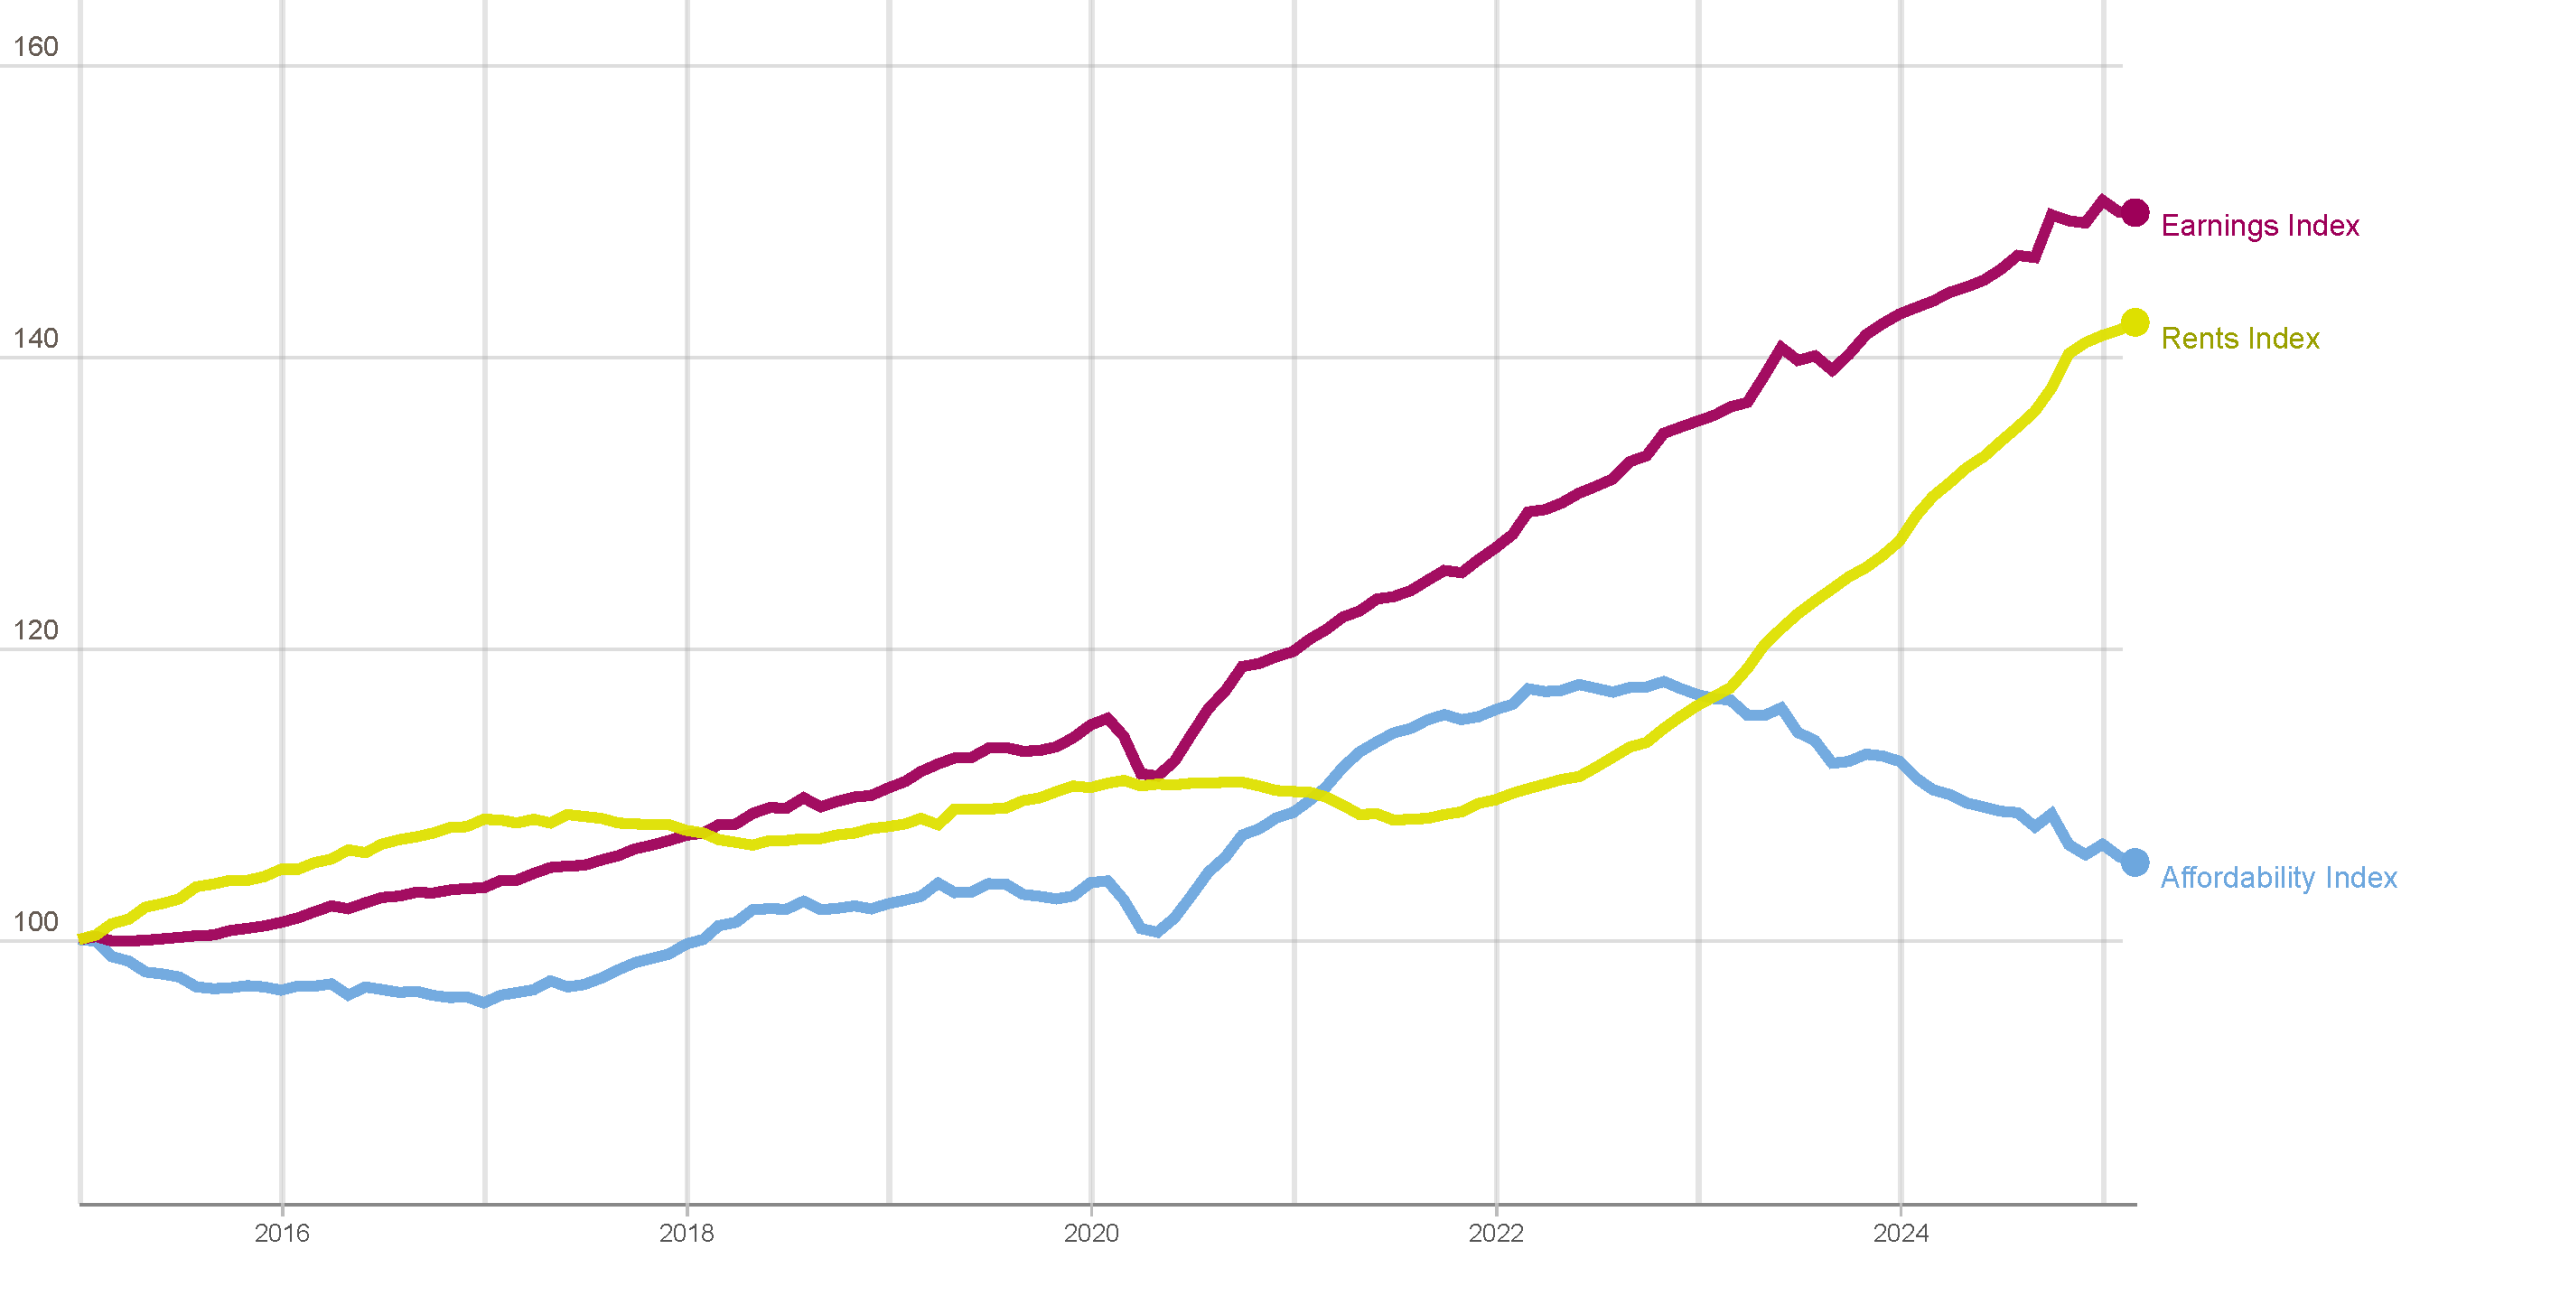
Source: ONS Pay As You Earn Real Time Information, ONS Price Index of Private Rents
The ONS Price Index of Private Rents reveals that rents increased sharply from 2022 onwards and are currently outpacing earnings growth, leading to a deterioration in affordability (Figure A7). The affordability gap is particularly pronounced for younger, lower-income, and minority households. For many, home ownership is increasingly unattainable, contributing to the polarisation of the housing market.
According to GLA cost of living data, 26% of Londoners reported difficulty paying rent or mortgage payments in early 2025, up from 21% in 2022[7]. Homelessness indicators are also trending upwards. The rate of rough sleeping rose to 28.5 per 100,000 residents in November 2024 – the highest level since data collection began in 2020 (Figure A8). Additionally, approximately 1.7% of households in London are living in temporary accommodation, compared to 0.2% in the rest of England.
Figure A8: Rough sleeping
Number of people sleeping rough over the month per 100,000 people.
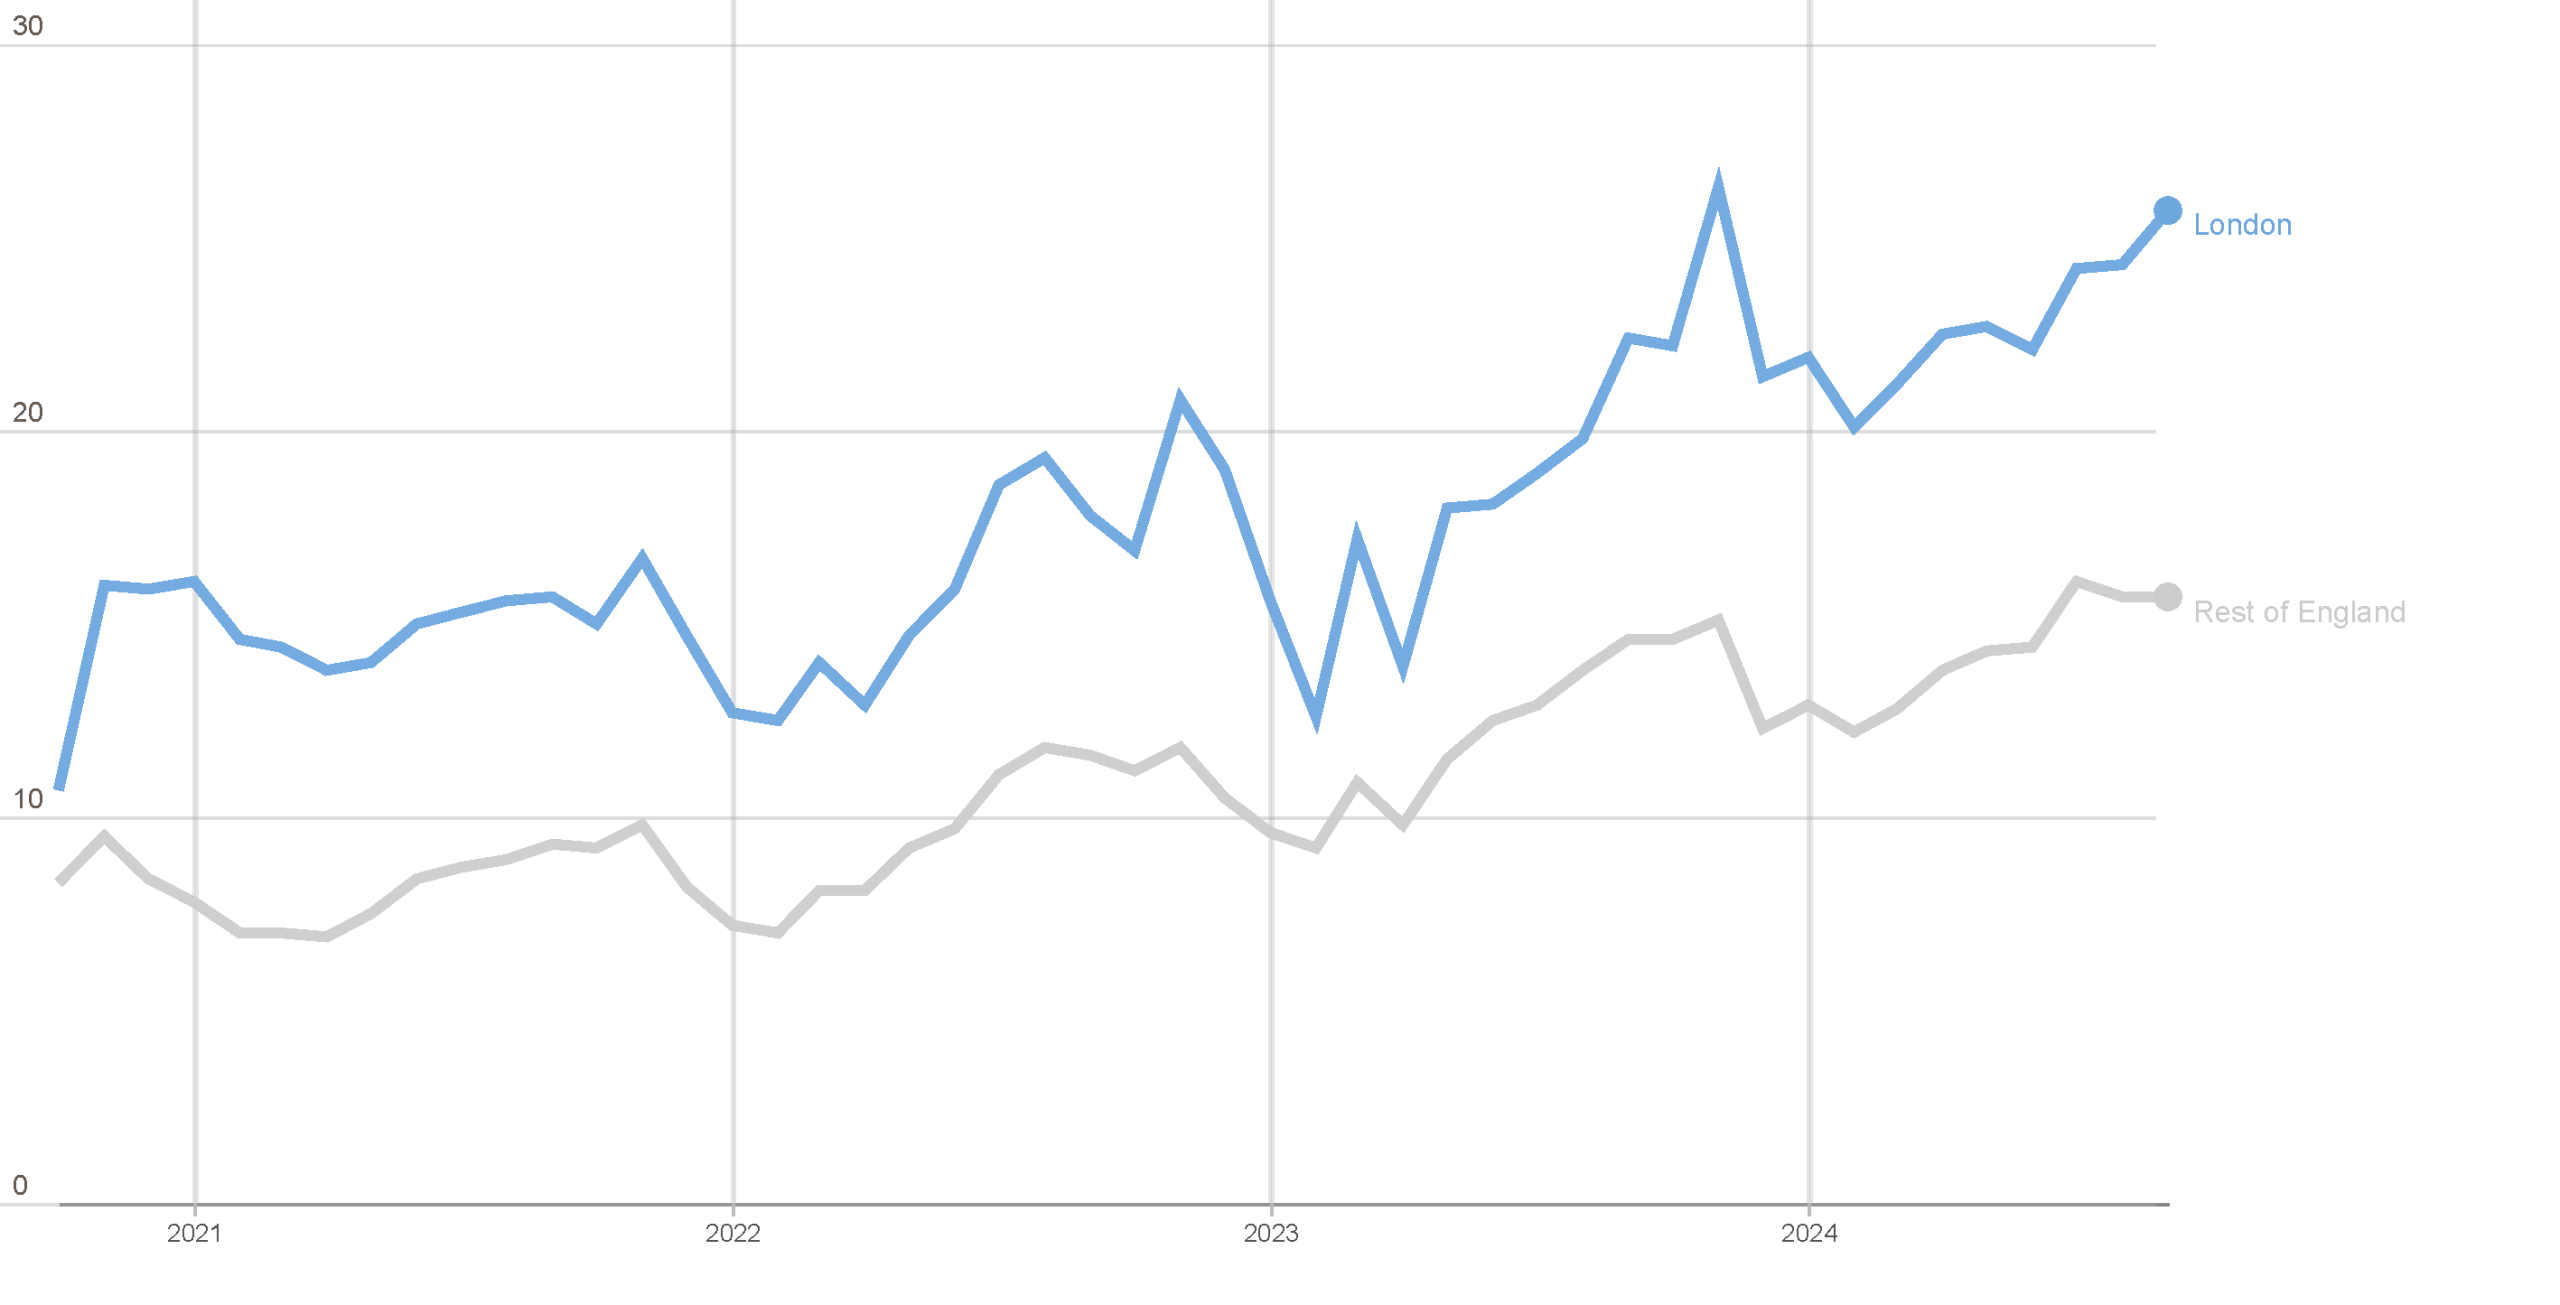
Source: MHCLG
Final Considerations
The 2025 State of London report paints a picture of a city that remains globally competitive and economically diverse yet marked by deeper structural constraints linked to inequality.
London’s economy has regained some momentum following the pandemic, with strong investment, job creation, and tourism. The city remains the UK’s most productive region and a global hub for finance, technology, and culture.
However, long-standing structural challenges persist. Labour market participation is high, but job quality is uneven. Economic output is growing, but productivity has faltered. Housing affordability is a persistent barrier to inclusivity, and income inequality remains pronounced.
Download the full report here: State of London 2025
[1] Financial Times- London’s productivity sinks to below pre-pandemic levels
[2] Financial Times – fDi Markets
[3] GLA Economics – London Labour Market Update July 2025
[4] GLA cost of living polling
[5] UK House Price Index for February 2025
[6] ONS: Private rent and house prices, UK: March 2025