
London's Economy Today editorial - May 2026
UK inflation drops in April
The latest data on Consumer Price Inflation (CPI) from the Office for National Statistics (ONS) showed that it slowed to 2.8% in the 12 months to April 2026, down from 3.3% in March (Figure 1). The slowdown in CPI inflation was below that expected by surveyed analysts who had expected it to stand at 3%. CPIH inflation (a broader measure that includes owner occupiers’ housing costs and Council Tax) also slowed, standing at 3.0% year‑on‑year, down from 3.4%.
Figure 1: CPI, goods, services and core annual inflation rates, UK, April 2021 to April 2026
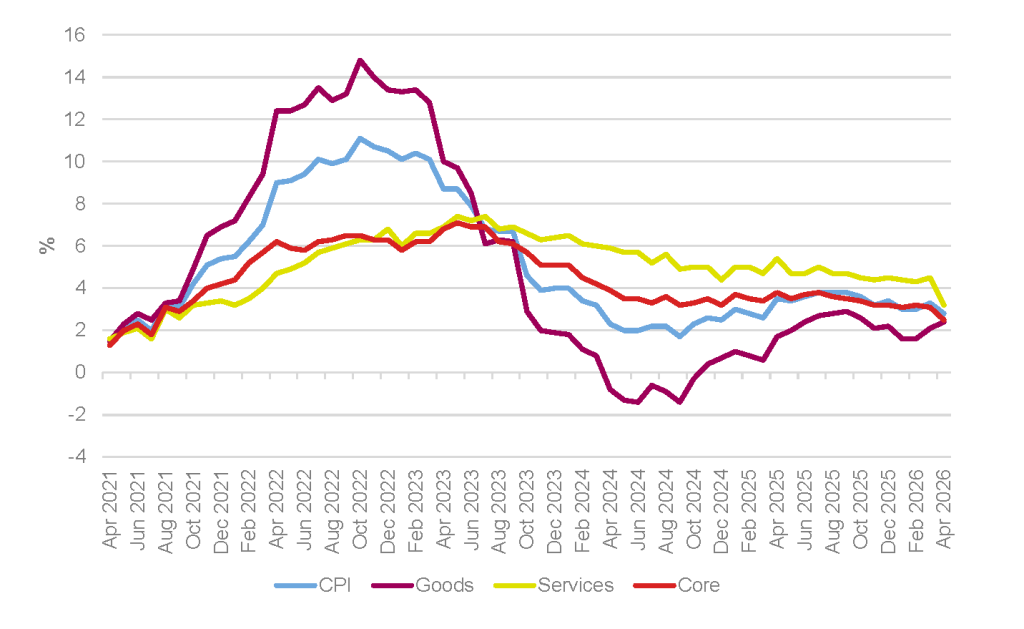
Source: ONS
The ONS notes that “housing and household services made the largest downward contribution to the monthly change in both CPIH and CPI annual rates; an upward contribution from a large increase in motor fuel prices was counteracted by downward effects from other categories in the transport division”. Core CPI fell (from 3.1% to 2.5%), with services inflation also falling (from 4.5% to 3.2%) but goods inflation picked up slightly (from 2.1% to 2.4%).
Inflation, although above the Bank of England’s 2% target, is now within the Bank’s ±1 percentage point tolerance band. The ONS observed that the UK’s CPI inflation rate of 2.8% was lower than the first (or “flash”) estimate of inflation for Germany (2.9%) but higher than that for France (2.5%) in April 2026. This is the first month since December 2024 that the UK’s rate of inflation has been below that of Germany. However, with the closure of the Strait of Hormuz and the associated inflationary pressures due to the disruption of the trade in key commodities, the latest downturn in inflation is likely to be a temporary reprieve with upward pressures expected to be seen in coming months.
As an indication of this, Ofgem has announced a rise in the energy price cap from July. The new cap will mean a typical annual household energy bill for a dual-fuel customer paying by direct debit will cost £1,862, an increase of £221 a year or 13%. For further analysis of inflation in London please see the supplement to this month’s publication.
UK economy saw good growth in Q1 2026, but the Middle East conflict dampens the outlook
The ONS also published data this month which showed that the UK economy grew quite strongly at the start of 2026. Output increased by 0.6% in Q1 2026 after growing by an upwardly revised 0.2% in Q4 2025 (Figure 2).
Figure 2: UK real quarterly GDP growth, Q1 2024 to Q1 2026
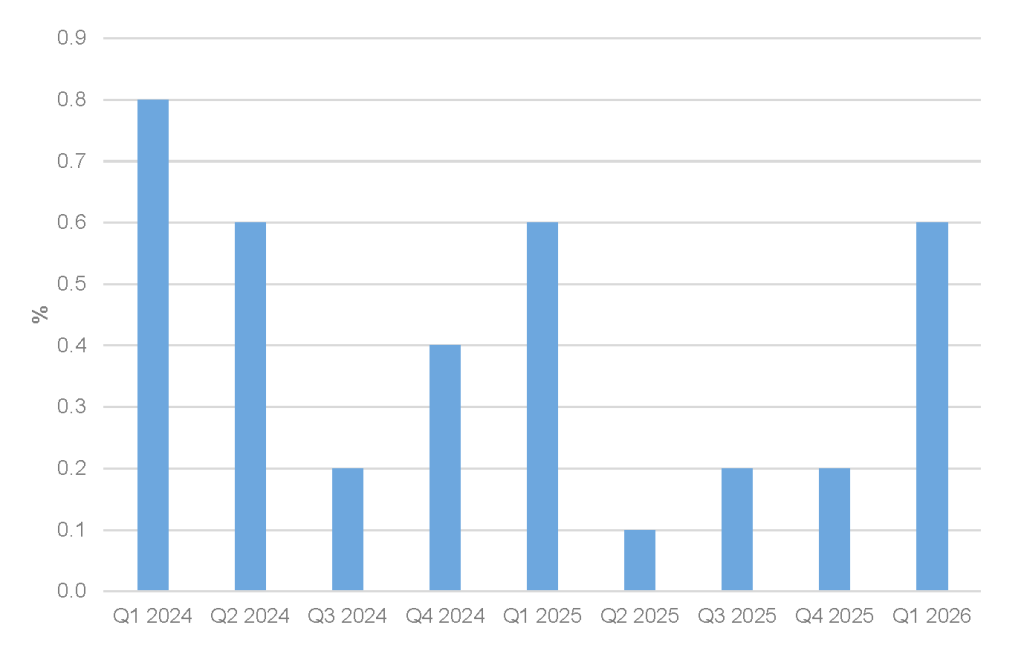
Source: ONS
The annual growth rate for 2025 was also revised upwards with GDP now estimated to have grown by 1.4% in 2025 as a whole, faster than the revised downwards 1.0% annual growth seen in 2024.
Looking at the major sectors of the economy the ONS observes that the services sector, an important sector for London, grew by 0.8% in Q1 2026 compared to growth of 0.2% in Q4 2025, and the construction sector grew by 0.4% in the quarter “but remains 1.3% lower compared with the same quarter a year ago”. However, the production sector saw growth of 0.2%, slower than the growth of 1.3% seen in the previous quarter. Real GDP per head grew by 0.6% in Q1 2026 after growing by 0.1% in the two previous quarters. Compared to the same quarter a year earlier GDP per head was 0.9% higher.
Alongside the published GDP numbers the ONS also published a blog looking at how the ONS deals with seasonal effects in the data. In this, James Benford, the ONS director-general for economic statistics, observed that the seasonal effect of Christmas on the data has become smaller post the pandemic. A number of factors could be causing this but he noted that businesses had told them that turnover had been weaker in the run up to last year’s Budget “because firms and households were waiting for the autumn Budget before making significant financial decisions”. It has therefore been expressed by some that a move to a single fiscal event in the year may have led to the quarter following the event measuring artificially higher growth due to problems in adjusting for seasonality.
Bank of England scenarios point to a weaker UK growth outlook
The Bank of England’s April 2026 Monetary Policy Report presents a more uncertain outlook for UK growth than in February. While the February report expected UK GDP growth to strengthen gradually over the forecast period, the April report sets out three scenarios “to illustrate a range of possible outcomes for the UK economy”. These see that four-quarter GDP growth is expected to remain weak in the near term, at 0.7% in 2026 Q2, before recovering to around 1.7% by 2028 Q2.
The change mainly reflects the impact of the Middle East conflict on global energy prices. Higher oil and gas prices are expected to push up inflation, squeeze real household incomes and weaken demand. The Bank also notes that financial conditions have tightened, with market expectations for a Bank Rate higher than at the time of the February report. Still, in more positive news for the UK the International Monetary Fund slightly improved their forecast this month for GDP growth in 2026 to 1.0%, up from the 0.8% growth they had forecast last month.
For London, these weak growth forecasts point to a more challenging external environment. While the capital’s economy has continued to expand, recent indicators show signs of softening in consumer confidence, business activity and the housing market. A weaker UK growth outlook could therefore weigh on London through slower household spending, weaker business investment and continued pressure on interest-rate sensitive sectors.
Chancellor announces several measures to address the economic impact of the Middle East conflict
In response to the ongoing economic shock due to the closure of the Strait of Hormuz the Chancellor of the Exchequer, Rachel Reeves, announced several support packages. These included a “Great British Summer Saving Scheme” from when schools break up in Scotland at the end of June until they return in England, Wales and Northern Ireland on 1 September with a temporary VAT rate cut from 20% to 5% on summer attractions such as theme parks, zoos etc. While under 16 bus travel will also be free in England in August. Other measures include a £350m critical chemical resilience fund, a £120m fund to support the ceramics sector to help with efficiency and energy costs and extending the 5p fuel duty cut until the end of year. Also, tariffs on over 100 different foods sold in supermarkets will be suspended to reduce costs on customers (with the expectation that supermarkets will pass these savings on to consumers).
New evidence on recent UK productivity performance
Recent analysis from the Centre for Economic Performance argues that the UK’s recent productivity performance is stronger than earlier estimates have indicated. Drawing on payroll‑based measures of employment and hours, rather than the Labour Force Survey (LFS) alone, the analysis finds that output per hour has risen faster over the past year than previous figures implied – largely because the number of total hours worked in the economy seems lower than LFS data suggests. This is consistent with analysis from the Resolution Foundation, which estimates that productivity grew by around 3% between early 2024 and late 2025 – more than in the previous seven years combined.
This work underlines the importance of measurement in understanding the UK’s productivity performance. Traditional statistics tend to capture investment in physical capital (such as buildings and machinery) more accurately than investment in intangible assets like software, data and organisational know‑how. In a services‑heavy economy, where an increasing share of business investment takes these intangible forms, both output and business investment can therefore be understated, and productivity growth can appear lower than underlying performance would imply.
For London, this matters because any improvement in the UK‑wide productivity picture is likely to be reflected in the capital. London also has a large concentration of high‑productivity, knowledge‑intensive services that rely heavily on hard‑to‑measure intangible investment, so if the national picture on productivity and intangible investment has been understated, London’s underlying performance is likely to have been understated too.
Softer house price growth, but persistent rental rises
The latest UK House Price Index shows that average UK house prices in March 2026 were broadly unchanged on a year earlier (at around £270,000). London remains the highest priced region but has seen weaker nominal house price growth than most other parts of the UK over the past year, continuing a recent pattern of relative underperformance. At the same time, data on private rent and house prices for the UK confirms that London’s private rents remain the highest in the country, with annual growth still above most other regions.
This combination of softer sale prices and rising rents has mixed implications for affordability. For higher‑income households looking to buy, slower house price growth and a gradual easing in mortgage rates offer some improvement in buying conditions. For lower‑income renters, the main challenge remains high and ever-increasing rents relative to earnings, alongside limited access to social and affordable housing. Recent GLA housing statistics and monitoring show that affordable housing starts and completions are improving, but still fall short of estimated long‑term needs.
For London’s economy, persistently high rental costs may make it more difficult for lower‑ and middle‑income workers to live close to employment centres, widening spatial and income inequalities within the city. Over time, this risks expanding spatial mismatches between where jobs are located and where workers can afford to live, making it harder for firms to recruit and retain staff – reducing how efficiently London’s labour market can match workers to jobs.
GLA Economics will continue to monitor these (and other) aspects of London’s economy over the coming months in our analysis and publications, which can be found on our publications page and on the London Datastore.