
HSDS Research & Insights
The Greater London Authority (GLA) High Streets Data Service (HSDS) provides its members with regular analytical briefings on the key issues facing retail areas across all of London. Our analysis project results are summarised below.
Friday Effect Update
June 2024
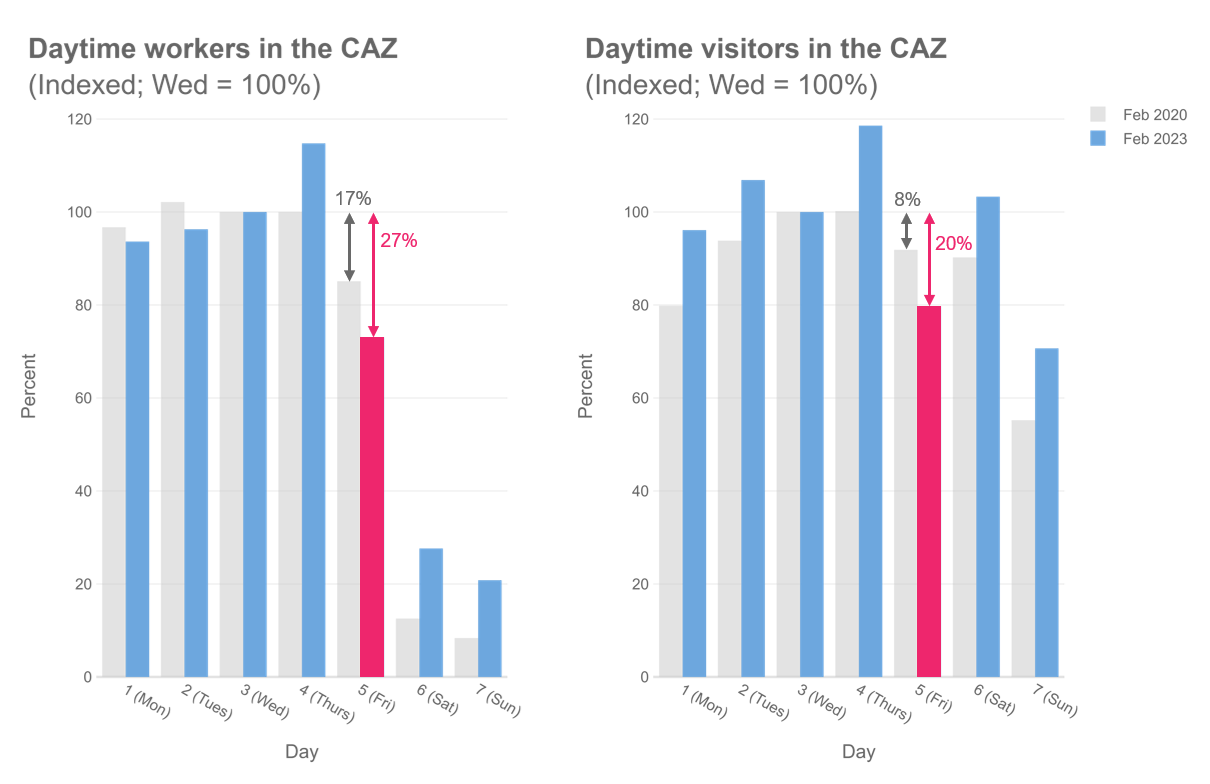
Analysis Question: Is there a “Friday Effect” (drop-off in activity on Friday) in London’s Central Activity Zone (CAZ), and what does it mean for local businesses?
What we learned
- The Friday Effect phenomenon is still very present in London. It is most prevalent in the daytime and in the central activity zone (CAZ).
- The Effect is more prominent amongst workers than visitors, which may indicate that workers who can, are opting to work from home on Fridays.
- Friday night-time activity is strong. Compared to other weekdays, footfall, total transaction values and transaction volumes are highest on Fridays.
- High value purchases are more common on Fridays than other weekdays.
For the full story, see: The 2024 Update – Friday Effect in the Central Activities Zone (CAZ) presentation by Damilola Emiola, HSDS Data Scientist, GLA.
Housing Completions & Town Centre Vitality
June 2024
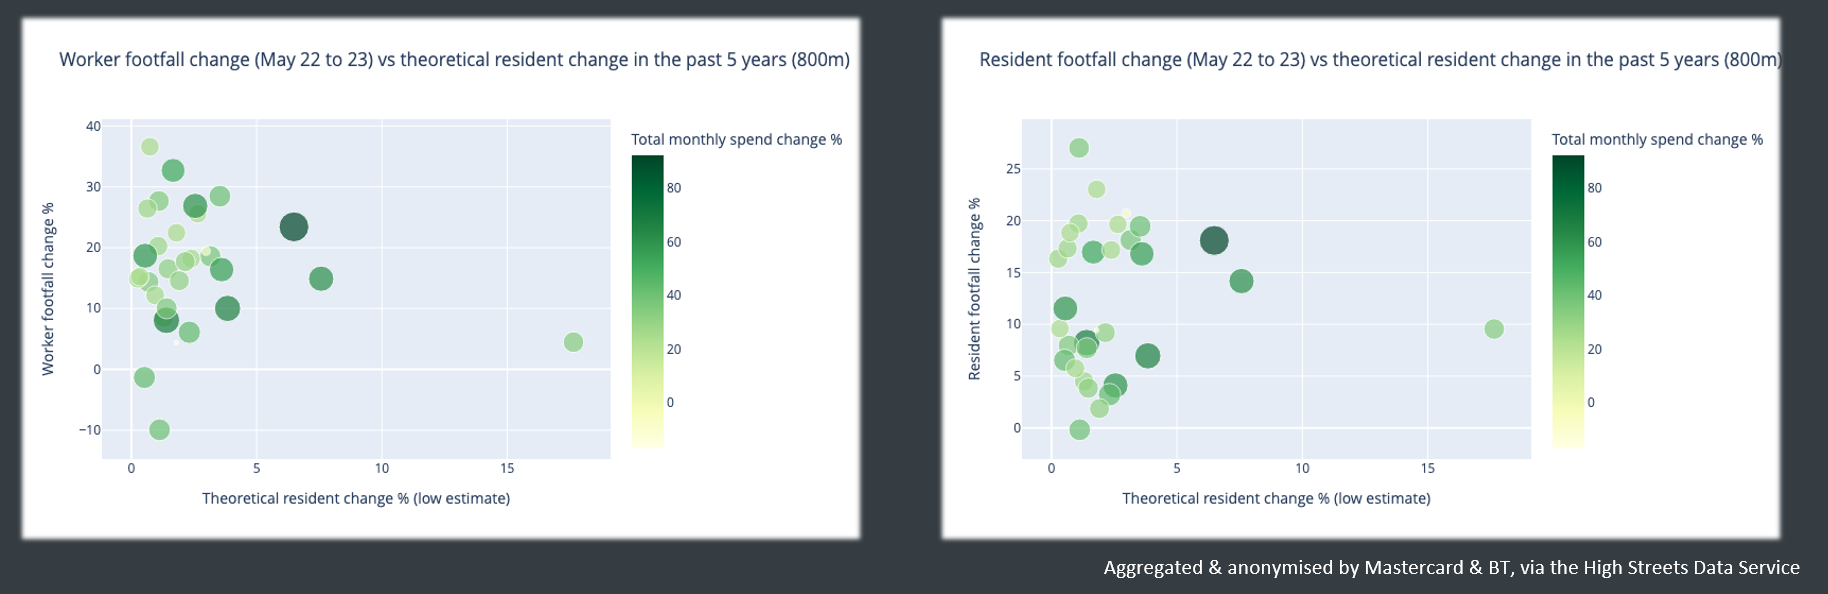
Analysis question: How does the change in residential developments near major town centres impact the vitality of the town centre (measured using footfall and spend data)?
What we learned
- Both residential and non-residential development has a positive relationship with footfall change within town centres. All town centres with recent housing growth also saw increased visitor footfall and worker footfall.
- However, not all footfall is attributable to development: some town centres saw footfall growth without many recent completions.
- Resident, visitor, and worker footfall tend to increase together. Potential factors include the impact of planning policy, such as mixed-use developments, or other ‘agglomeration’ effects of increased residential and commercial occupancy and retail use.
For the full story, see: HSDS x Residential Completions by Matt Xi, Data Science Intern, GLA Planning + Regeneration
Impact of Major Sporting & Cultural Events
May 2024
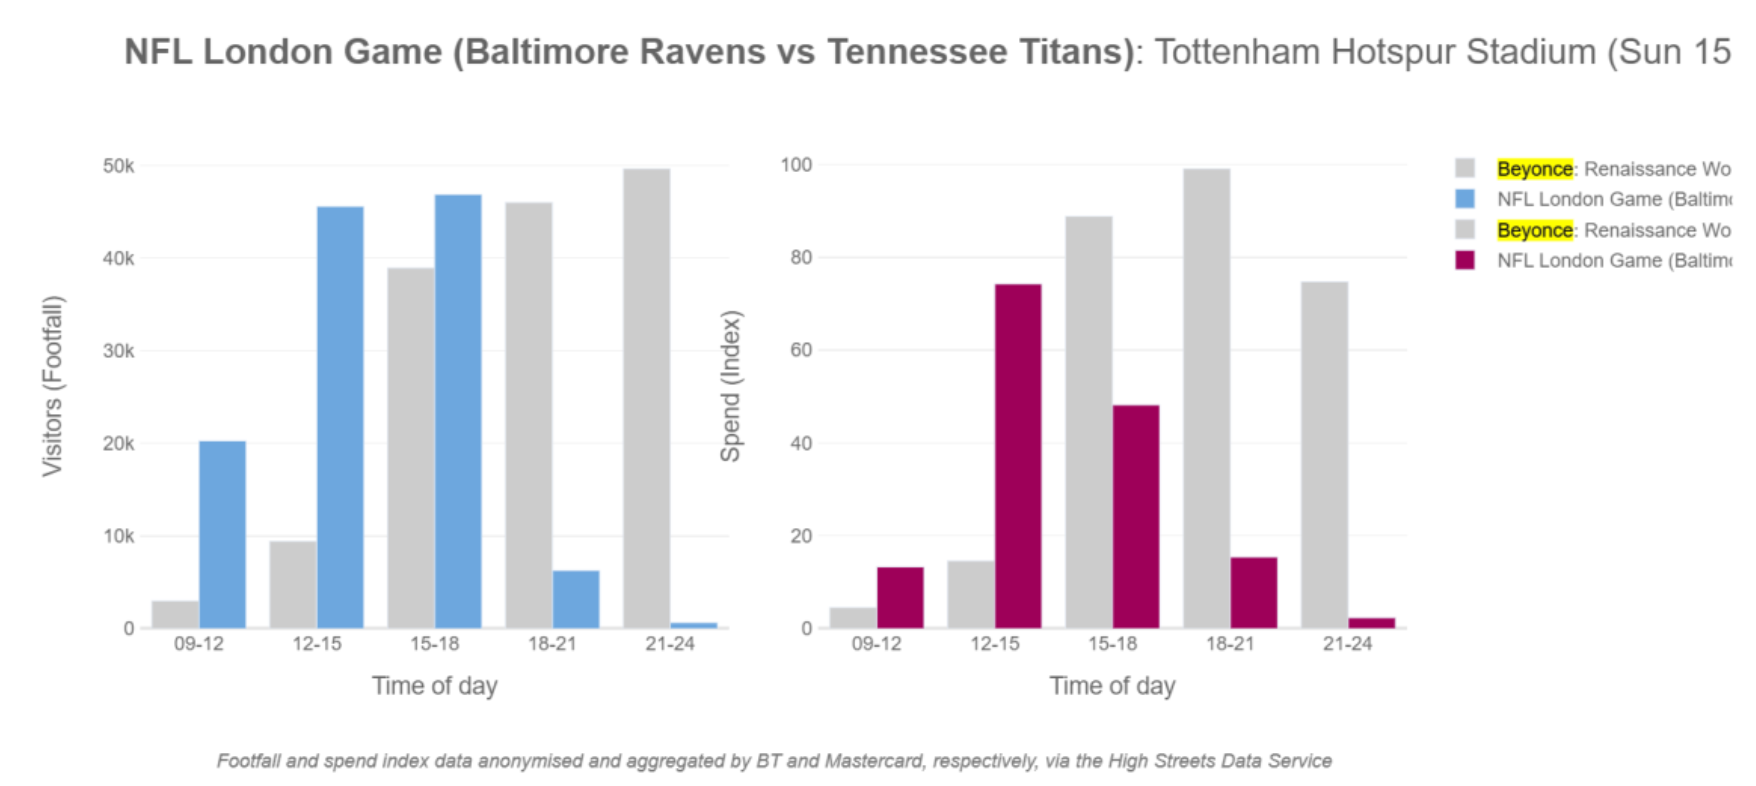
Analysis Question: What is the impact of major sporting and cultural events on local footfall and spend? How are businesses near venues impacted on event days?
What we learned
-
For the Formula E London E-Prix at the Excel, comparing event days to ‘comparator’ non-event days illustrated their potential to double spending in the surrounding area – although spend growth did not match increases in footfall. :
- Visitor footfall increased 8x between 3-6pm in the event location and 19.5x in post-event hours (9pm-12am)
- The largest change in spend occurred between 9pm-midnight (+128.9%) in the event location and between 3-6pm in the surrounding area (+105.3%)
- Comparing multiple event types at the same venue showed differences in unique crowds’ impact on local area. At Tottenham Stadium, peak spend on event day for the Beyoncé Renaissance World Tour concert was 33.7% more than peak spend for the afternoon NFL London Game.
- Time-series plots 30 days before and after the event shows spikes in visitor footfall on event days
For the full story, see: Major Events Analysis – London Datastore by Rachel Humphries, HSDS Data Scientist, GLA.
24 hour London Evidence Base update
March 2024
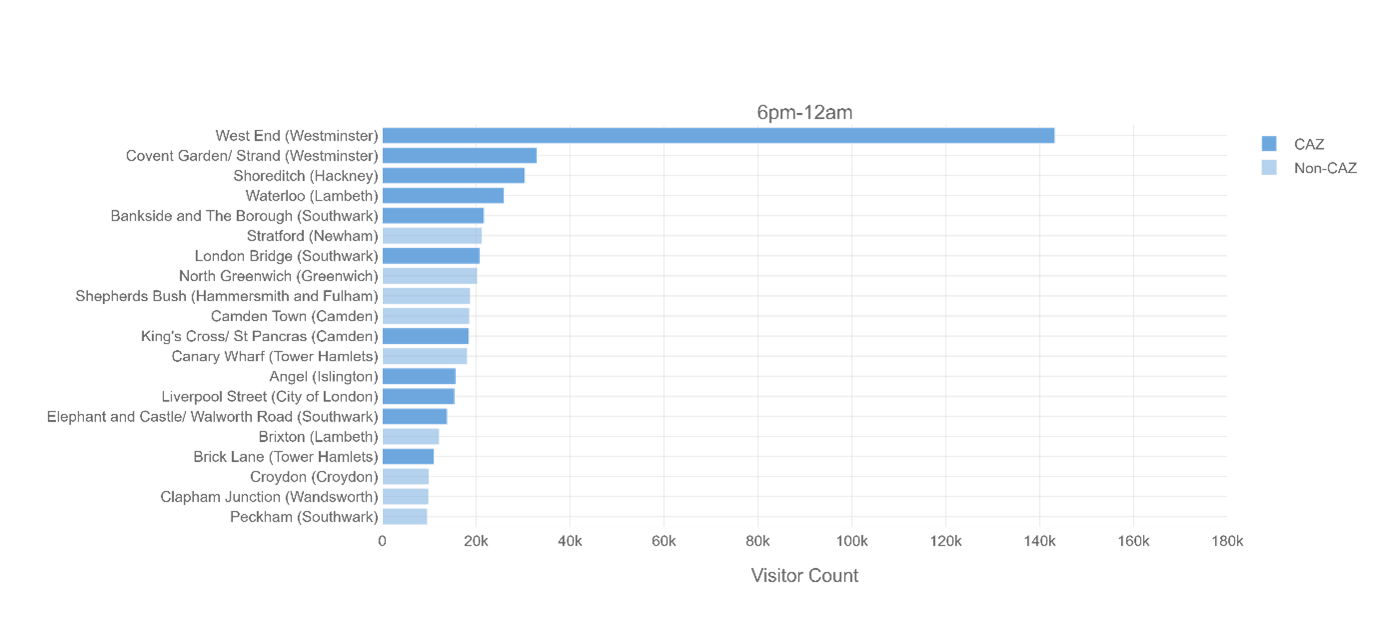
Analysis Question: How has activity across London after 6pm night has changed since 2018?
What we learned
- One in every four pounds is spent at night. Night-time spend typically peaks on a Friday evening in London as a whole. However, in the CAZ, spend peaks on Thursday evenings.
- Over 2 million visitors are out-and-about in London on a typical weekend night between 9pm and midnight. Around 1 million are out even later, between midnight and 3am, while the early evening (6pm-9pm) typically sees 3-4 million visitors.
- The West End and other iconic destinations are the most visited town centres in the CAZ. The West End is by far the busiest destination from 6pm to midnight, with more than 140,000 visitors on a typical Thursday to Saturday night.
- Travel hubs are also important for night-time activity. Town centres around many of London’s largest national rail stations are well represented in the top 20 hotspots.
For the full story, see: London at night by Nick Jacob & Yiqiao Chen, Economists, GLA Economics
“Holiday 2023 compared to 2022” – How was the pre-Christmas period this year?
February 2024
Analysis Question: How did 2023 pre-Christmas visitor footfall and spend compare with 2022?
What we learned
- On average, visitor footfall and spend increased at every time of the day and on all days of the week across London.
- The CAZ saw more of an increase in daytime visitor footfall whereas the non-CAZ saw more of an increase in night-time visitor footfall.
- At peak shopping times (12pm-3pm), 92% high streets and 97% BIDs saw an increase in visitor footfall.
- There were a few large peaks in mid-week spending across London midnight-3am, potentially caused by an increase in Christmas parties in comparison to 2022.
For the full story, see: Pre-Christmas Period presentation by Rachel Humphries, HSDS Data Scientist, GLA.
“The Friday Effect” – Are London’s workers disappearing?
August 2023
Analysis Question: Is there a “Friday Effect” in London’s Central Activity Zone (CAZ), and what does it mean for local businesses?
What we learned
- There is indeed a Friday Effect, but it’s not new. There have always been fewer daytime workers in London on Fridays, compared to the rest of the workweek.
- The Friday Effect is only prevalent in the daytime. Night-time activity is strong, with TfL stations in the CAZ seeing 21% more evening travellers on Fridays than midweek.
- The Friday Effect has become more obvious post-pandemic, but not because fewer people are coming into the CAZ on Fridays, but because midweek foot traffic is increasing about twice as quickly as Friday foot traffic.
- Overall spending isn’t impacted by the Friday Effect, despite fewer daytime transactions on Fridays, as visitors tend to spend more per transaction on Fridays than during midweek.
For the full story, see:
- The Friday Effect in the Central Activities Zone (CAZ) presentation by Lauren Wool, HSDS Data Scientist, GLA.
- Friday Effect Explorer tool (HSDS members only)
Low Traffic Neighbourhoods and their impact on local high streets
September 2023
Analysis Question: How does the implementation of Low-Traffic Neighbourhoods (LTNs) impact the activity on nearby high streets?
What we learned
- After the introduction of LTNs in Haringey, nearby high streets did not experience significant immediate change in footfall. The number of visitors, the amount of time they spent on the high street, and how often they came back (“loyalty”) stayed consistent with pre-LTN numbers.
- Spending activity on nearby high streets was not significantly impacted following the implementation of an LTN.
- There were also no immediate-term improvements on high street activity following the implementation of an LTN.
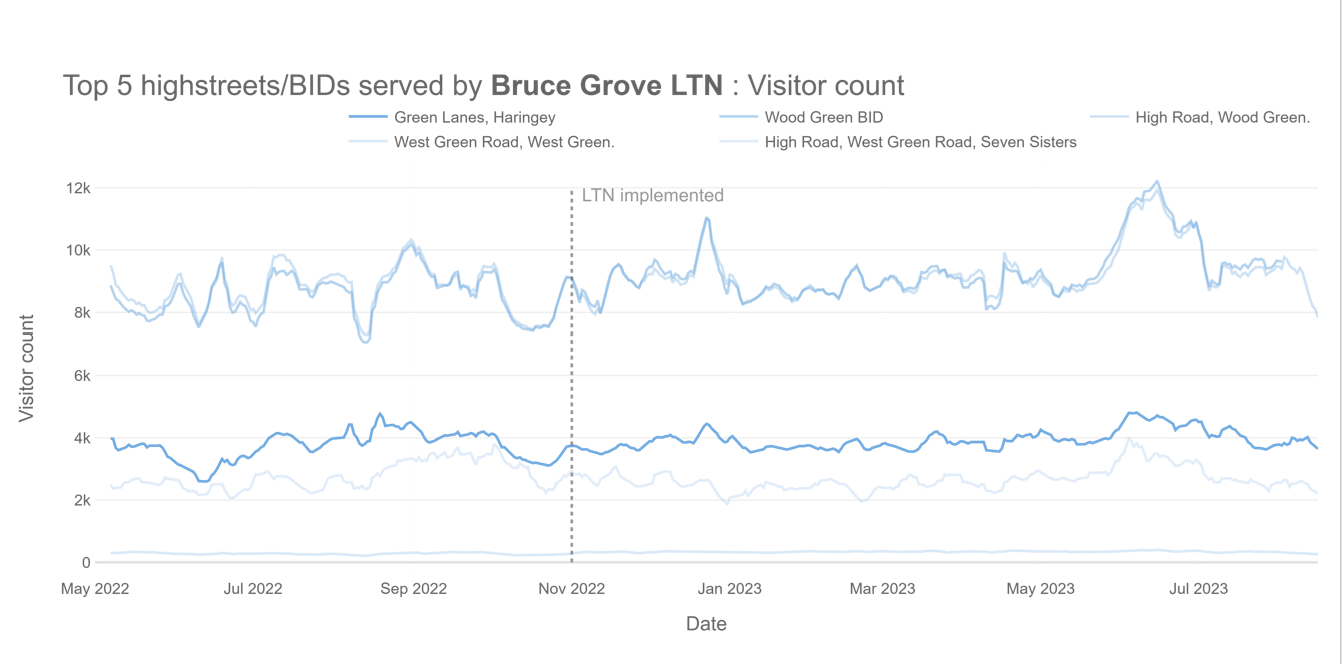
For the full story, see: Low Traffic Neighbourhoods: Impact on Local High Streets presentation by Lauren Wool, HSDS Data Scientist, GLA.
Climate resiliency – The effect of green space on high street activity on hot days
October 2023
Analysis Question: On extremely hot days, do areas with more green canopy cover attract more people than non-leafy areas?
What we learned
- Areas with more green canopy cover did not experience higher foot traffic compared to less leafy areas on extremely hot days.
- In areas with more green canopy, visitors tended to linger longer – i.e., the leafier the area, the more time people spent there.
- On days above 35°C, there were fewer people outside compared to control days, but those that were out stayed out longer than usual.
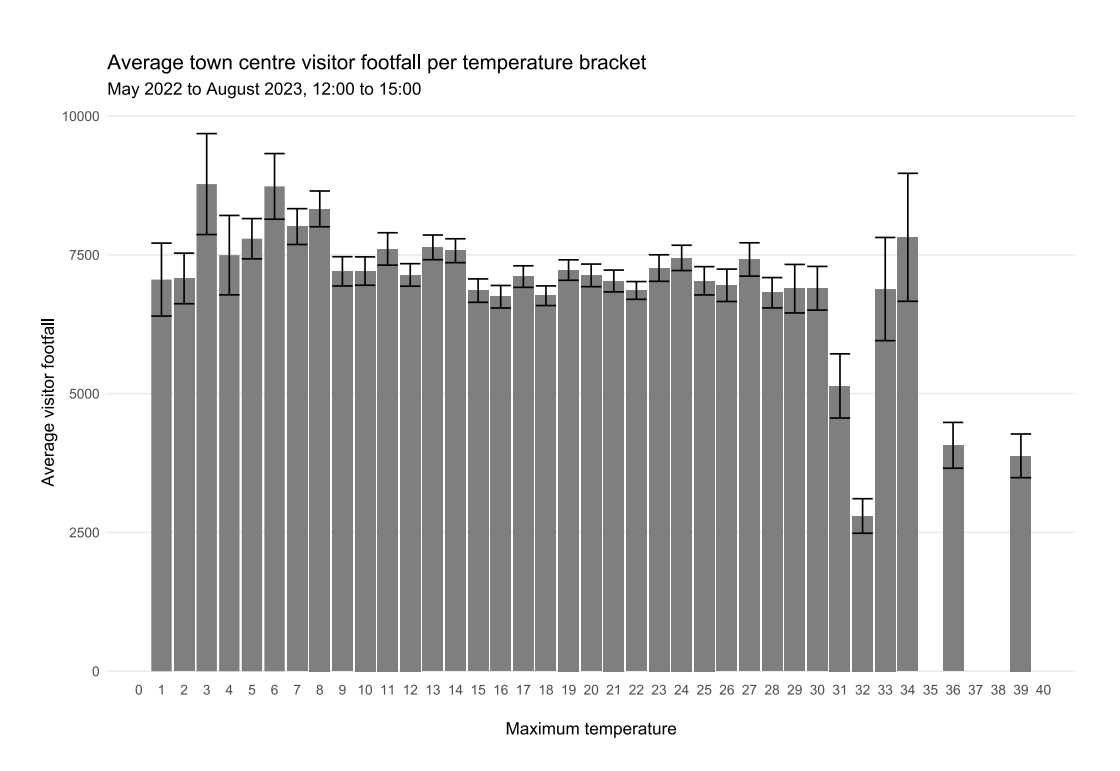
For the full story, see: Green Canopy Cover and Visitor Activity presentation by Amanda Robinson, Associate Director, PRD.
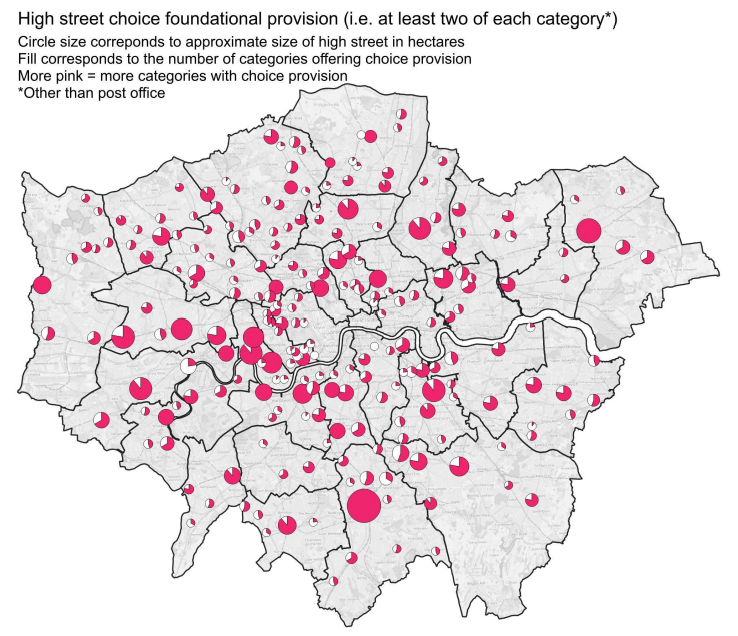
Foundational Economy – how well are high streets meeting Londoner’s needs?
August 2023
Analysis Question: What does the foundational economy look like in London’s town centres, and how do London’s high streets measure up?
Background: The Foundational Economy is an evolving approach to socio-economic development, developed by a group of academics to understand the critical role of essential goods and services in societal well-being and stability.
What we learned
- In the sample of high streets tested, only 17% featured at least one service within each foundational economy category.
- While food basics and retail are generally well provided in high streets and town centres, but childcare provisions and banking services were available in less than half of the surveyed high streets.
- In the leisure category, entertainment venues such as cinemas, performing arts centres and museums are notably sparse compared to dining-out options such as restaurants, cafes, and pubs.
For the full story, see:
- Foundational amenities & services review presentation by Amanda Robinson, Associate Director, PRD.
- Are High Streets Meeting Londoners needs? case study by Amanda Robinson, Associate Director, PRD.
- The Foundational Economy collective