Who wants to live forever?
Increasing life expectancy has been one of the wonders of the last century. About a third of babies born today can expect to celebrate their 100th birthday. But improving life expectancy has less obvious impacts on many aspects of your life, for example, an increase in the state-pension age, people living longer in ill health, and it can even affect your life insurance premiums.
Life expectancy is the most widely used measure of health, although it should be borne in mind that it only takes into account the length of people’s life and not their quality of life. Certainly, healthy life expectancy has not increased at the same rate as overall life expectancy.
There are several factors that affect your life expectancy. The two single most important factors are when you were born and your gender. Improving education has led to better diet, lifestyle, and fitness, while healthcare has also improved to keep us alive longer. Therefore people born more recently can expect to live longer, while women live about four years longer than men.
Life expectancy changes over time. That’s because as a person ages, people who died at a younger age have been factored out. As a person continues to out-live others who have died, the life expectancy of that individual increases. It is common now to present life expectancy at both birth and age 65. In London, the expectancy at birth for babies born between 2009 and 2013 is 81.8 years, whereas for people aged 65 between 2009 and 2013, they can be expected to live until they are 85.4 years (or an additional 20.4 years). Over a third of people who died in these years lived beyond the age of 85.
Life expectancy has increased in London more than any other region in England and Wales over the past five years – up 1.8 years since 2004-08. London is now on a par with the other high life expectancy regions, East, South East and South West. Incredibly, a Londoners average life expectancy increased by over four months in the past year, compared with less than three months for the England and Wales average.
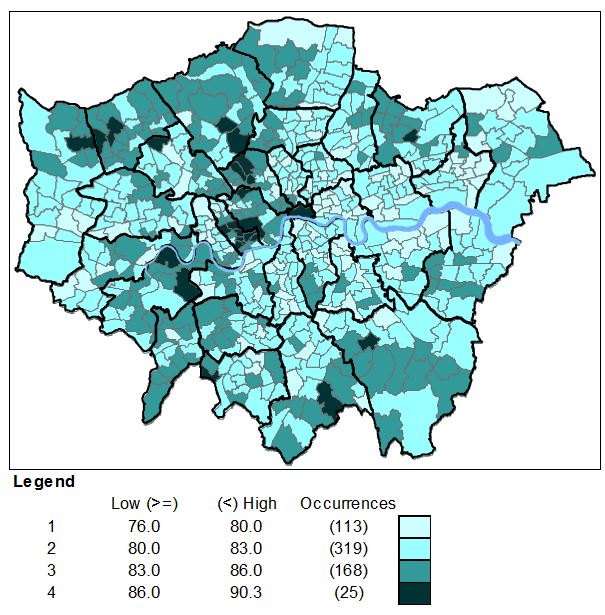
Data published today (6th January) by the Greater London Authority, shows life expectancy at ward level in London. The highest figure is once again in Knightsbridge and Belgravia at 90.3 years, although this has fallen by over two years over the past two years. It is not clear why it has fallen so much in such a short space of time. It may be a statistical blip, or there may be demographic changes in the ward that have caused the change. This year, New Cross in Lewisham has the lowest life expectancy in the capital at 76.0 years. This gives a difference of just over 14 years between the top and bottom wards.
Life expectancy at birth, 2009-2013
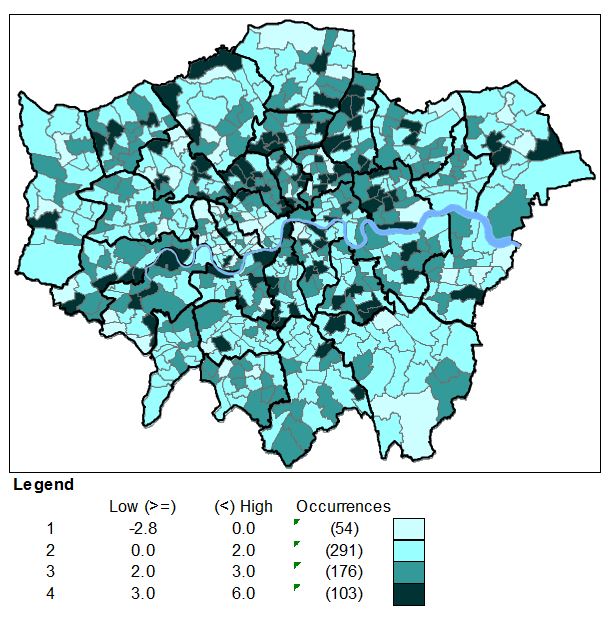
The greatest improvement in life expectancy from birth over the last five years has been in Cazenove ward, Hackney – up by 6.0 years. In contrast, Earl’s Court ward in Kensington and Chelsea, has had the largest fall, dropping 2.8 years. Explore the data to see what other patterns you can find.
Five year change in life expectancy at birth, 2004-2008 to 2009-2013