
The State of London Report and Dashboard
Regular readers of LET will know that this supplement normally takes a deep dive into a piece of research or analysis about London’s economy that we have been working on. This edition takes a slightly different form, bringing your attention to a new GLA publication called ‘The State of London’, a collaboration between analysts in City Intelligence (the wider Unit within which GLA Economics sits).
The State of London report provides data and analysis of trends across a range of topic areas – including the economy and labour market – but also many others, with chapters on:
- Demographics
- Community participation and engagement
- Crime and safety
- The environment
- Housing
- Income, poverty and destitution
- Transport and digital infrastructure
- Young people and education[1].
Alongside the report we also published the State of London Dashboard where readers can find (nearly) all the charts that are in the report with some more interactive features.
The project’s aim was to provide the Mayor and the London Assembly with data on key social and economic outcomes in London, with the primary objective of helping to frame the GLA’s corporate reporting process. However, it soon became apparent that the report would have a wider appeal and use to stakeholders interested in these topics and that we should make it public.
Bringing together data on such a diverse range of subject matters into a single document is hopefully useful for those needing a high-level overview of London’s performance without the need to delve into several documents and data sources. While it is by no means an exhaustive collection of data on each topic it is a good place to start, providing readers with what our analysts think are some of the most important charts and also links to further information.
The outbreak of COVID-19 saw a clamour for more timely data on the impact of the pandemic on people, society and the wider economy, with a call for more regional and local levels of granularity. The ONS and other organisations responded by releasing more data, commissioning new surveys and releasing some datasets that updated almost in ‘real time’. Out of the crisis there was considerable innovation in the way data was collected, processed, analysed and published in order to meet demand and this promises to help analysts and policymakers alike in their work into the future.
At the GLA, City Intelligence (among many other things) provided regular reports to the London Recovery Board and released a Resilience Dashboard with the most timely and meaningful statistics available. The State of London is an evolution of this work; it has the same ambition of providing datasets that update frequently and with less of a lag so readers are working with the most up-to-date figures available. This also applies to indicators that relate to London’s longer-term structural challenges that are less to do with the impact of Covid. For example, London’s chronic housing shortages for which official data on starts and completions still comes with a considerable lag and where proxies such as the number of Energy Performance Certificates issued can be used to give a sense of market sentiment.
The State of London Dashboard is built using the same software as the Resilience Dashboard. In the longer term this will provide analysts in City Intelligence with greater scope to automate the work of updating the charts– indeed some indicators on the dashboard in the labour market section already update automatically and hopefully free up resources within the team to focus on other more in-depth analysis.
There are over 120 charts in the report and on the dashboard. It provides stakeholders with a repository of data and a description of it for readers to interpret and use as they wish.
If one were to try to summarise, the report shows many positive signs of recovery from Covid, for example, in terms of London’s economic output (GVA), its resilient labour market, and a pick-up in levels of economic activity seen in expenditure patterns and public transport usage (although the latter is still below pre-pandemic levels). In terms of demography, we saw a return of young people to London from the spring of 2021 and have seen a recent up-tick in the birth rate after a number of years of decline.
However, quite clearly, significant challenges remain – footfall in some High Streets is still less than 80% of pre-Covid footfall and consumer confidence is low (though higher in London than the rest of the UK). Unemployment remains higher than the rest of the UK – a persistent long-term challenge. While the State of London does not go into detail on this, the effects of inflation and the rising cost of living are also major economic headwinds as shown in this month’s LET editorial. Given London’s high poverty rates and inequality, the same low-income groups that were most affected by the pandemic are also likely to bear the brunt of the cost of living crisis.
There are two charts in the Economy chapter that may be of particular interest to LET readers: the first on trends in business births and closures (Figure A1), and the second on Foreign Direct Investment (Figure A2).
Figure A1: Business births and closures
Number of births and closures (four-quarter moving average)
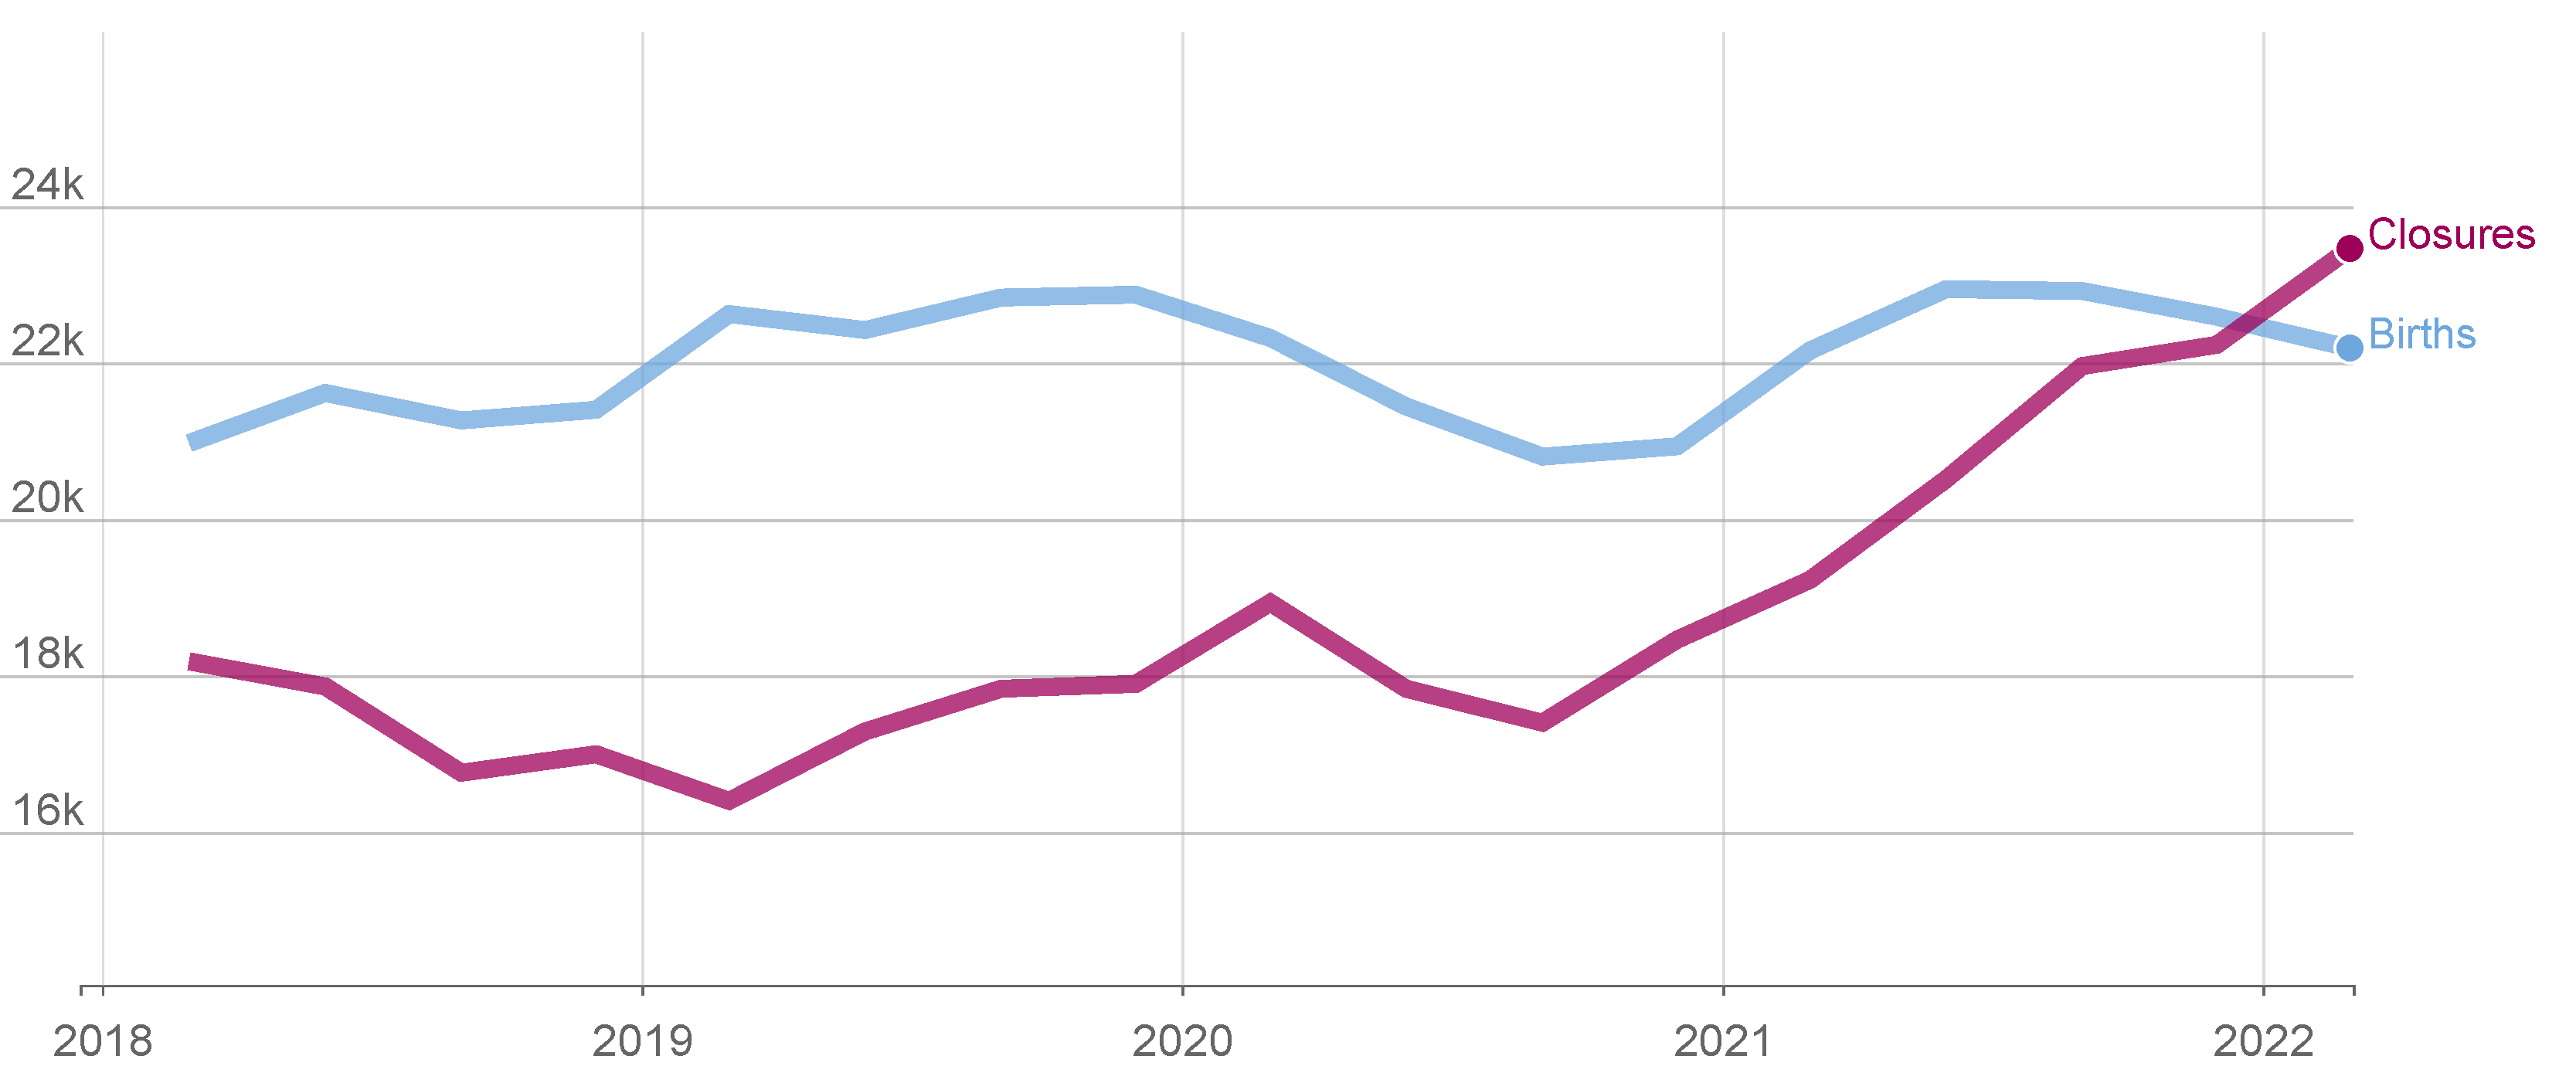
Source: ONS Business Demography. Note: experimental data.
Historically, London’s vibrant business sector has been a net generator of businesses, with the number of business births exceeding closures[2]. However, latest ONS business demography data suggest that business closures now exceed business births in the capital.
Following a dip in both business births and closures at the outbreak of the pandemic in 2020, both then began to rise suggesting a high rate of churn. Of concern is that while business births appear to plateau and fall slightly in recent quarters, business closures continued to rise. This has caused the net growth in business numbers normally seen in London to evaporate with closures now exceeding births. Taking the average of the last four quarters, business closures (23,500 per quarter) were higher than births (22,200 per quarter) for the first time in this series.
Research commissioned by GLA Economics[3] on the migration patterns of businesses showed that many businesses that start life in London go on to move to other parts of the UK. So this should be of concern to the wider UK economy as well as London’s, and is hopefully a temporary phenomenon.
Figure A2: Foreign Direct Investment (FDI) into London
Number of projects (top series) and Capex £m (bottom series)
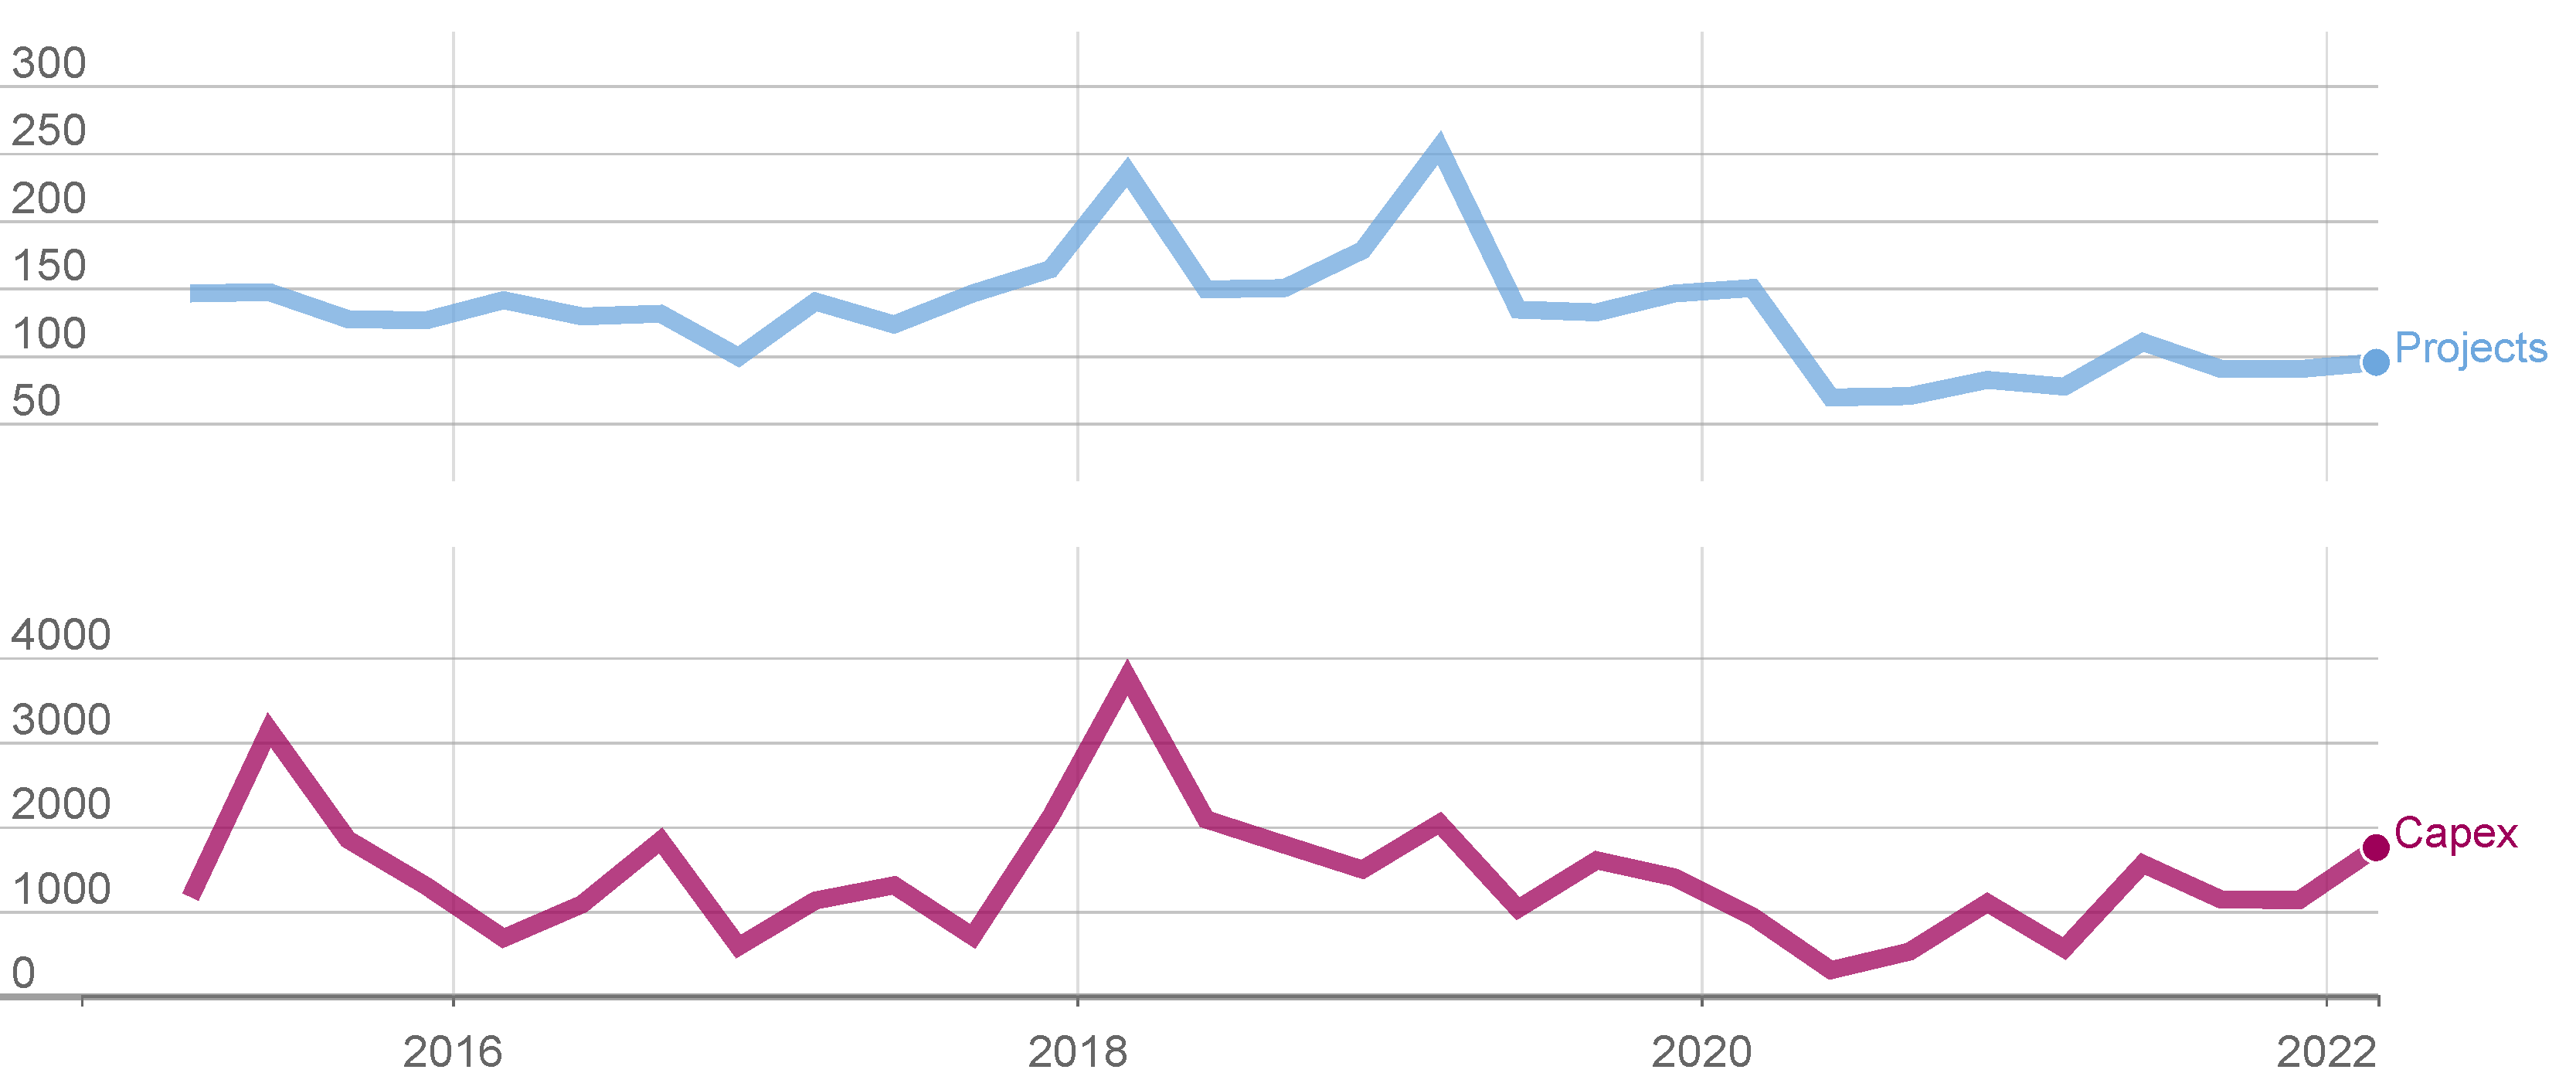
Source: fDi Markets, from the Financial Times Ltd 2021
Recent data suggests there are some positive signs of recovery in Foreign Direct Investment to London. Following the outbreak of the pandemic, much investment had to be put on hold or worse, cancelled. Latest estimates suggest capital expenditure has recovered to 2019 levels and the volume of projects appears to be slowly improving.
Between January and March 2022 there were an estimated 95 FDI projects into London, worth £1.75bn in capital expenditure according to fDi Markets. This is an improvement on previous quarters during the pandemic. In the five years before the pandemic the average was around 150 projects worth £1.57bn per quarter, suggesting that while the number of investment projects remains comparatively low at the start of 2022, those transactions taking place were of a high value.
We hope that readers of LET needing a wider range of indicators on London’s performance (beyond the economic indicators found in this publication) will find the State of London report and Dashboard useful. The Dashboard is in Beta form while it continues to be developed and we would welcome feedback on both the report and the Dashboard via email to: intelligence@london.gov.uk.
[1] A health and wellbeing chapter will be added at a later stage when work on a wellbeing measure is complete.
[2] Note that the data is an experimental statistic from ONS and has been smoothed using a four-quarter moving average. Data refer to businesses added or removed from the Interdepartmental Business Register (IDBR) and has several caveats, see ONS (2020) ‘Business demography, quarterly statistics, UK: April to June 2020’.
[3] See Trends Business Research Ltd. (2016) ‘The changing spatial nature of business and employment in London’: Working Paper 73.