The Sectoral Composition of UK Investment: Divergences Abound!
It is commonly acknowledged that the UK in general, including London, has experienced low rates of investment especially since the 2008 Financial Crisis. This idea, however, masks divergences in the sectoral composition of UK investment over the past 25 years, which in some cases contributed to that relative slowdown.
In a previous supplement to London’s Economy Today (also published as a blog on the London Datastore) we have examined investment in London and how it compared to that of other UK regions as well as the capital’s international peers. This supplement provides a detailed breakdown of investment by sector and asset, instead of focusing solely on source. It will do so, looking at the UK using a combination of recent experimental data from the Office for National Statistics (ONS) as well as the OECD.
Before delving into the details, it is worth reminding ourselves of the definitions used by the ONS[1] to define certain important terms:
- GFCF: an estimate of net capital expenditure by both the public and private sectors.
- Business investment: Net capital expenditure by businesses within the UK; they exclude expenditure on dwellings and the costs associated with the transfer of ownership of non-produced assets, and capital expenditure by local and central government.
- Chained volume, seasonally-adjusted data: This supplement will only look at chained volume, seasonally-adjusted GFCF data as it would adjust for the impact of inflation over time as well as reveal underlying movements rather than incorporate seasonal variation in investment. For example, retailers typically hold more inventories in the run-up to Christmas and government organisations tend to spend more in Quarter 1 of each year at the end of the financial year. The seasonally-adjusted data removes such effects.
Figure A1 presents detailed definitions of asset types defined by the ONS.
Figure A1. Definition of Asset Types
| Published Asset | Includes | Definition | Examples (N.B. not exhaustive) |
| Dwellings | Dwellings | Dwellings are buildings, or designated parts of buildings, that are used entirely or primarily as residences, including any associated structures, such as garages, and all permanent fixtures customarily installed in residences | Houses, mobile homes and caravans. However, it should be noted that dwellings does not include prisons, boarding schools or hospitals |
| Transport | Transport equipment | Transport equipment consists of any equipment used to move people and objects. | Motor vehicles, trailers, ships, trains, trams, aircraft, motorcycles, and bicycles |
| Intellectual property products (IPP) | Research and development | This is the value of expenditure on creative work to increase the stock of knowledge, which developers can market or use for their own benefit when producing goods and services. | Development of software programs or design for a new aircraft |
| Mineral exploration | This is the value of expenditure on exploration for petroleum and natural gas and for non-petroleum deposit and the subsequent evaluation of the discoveries made. | License and acquisition costs, appraisal costs, costs of test drilling and boring | |
| Software and Databases | Software consists of computer programs and supporting systems for both systems and application software. | Packages such as Microsoft Office and VLC Media Player | |
| Entertainment | This consists of the original films, recordings, manuscripts, tapes, etc which drama performances, radio, television programmes, sporting events and etc are recorded and embodied. | Films, tapes, recordings, radio and television programmes and books | |
| Other buildings and structures and transfer costs | Other buildings | Other buildings are buildings that are not dwellings. This includes industrial buildings, commercial buildings, educational buildings and health buildings. | Schools, hospitals, prisons, religious, sport, amusement and community buildings |
| Transfer costs | Transfer costs, sometimes known as cost of ownership transfer, are the costs associated with buying or selling an asset | Transportation costs, legal fees and stamp duty. | |
| Information and communication technology equipment (ICT) and other machinery and equipment | ICT | This mainly consists of computer hardware and telecommunications equipment such as computers and mobile phones | Computers, laptops, mobile phones and gaming consoles |
| Other machinery and equipment including weapons | Other machinery and equipment consists of all equipment and machinery that is for general or special use. General use machinery includes engines, turbines, ovens, etc. Special use machinery includes machinery for mining, domestic appliances, agricultural equipment, etc | Typically large electronic equipment (e.g. equipment used in the production of goods and services) | |
| Cultivated | Cultivated assets are livestock for breeding (including fish and poultry) | Livestock not for slaughter, orchards, vineyards, dairy draught |
Source: ONS
UK Investment by Sector
The ONS presents seasonally-adjusted data on annual gross fixed capital formation by sector. Sectors include business, government, public corporations, and private sector (excluding private business). Figure A2 looks at investment (in real terms) by sector over a 26-year period from 1997 to 2023.
Figure A2: GFCF by sector in real terms
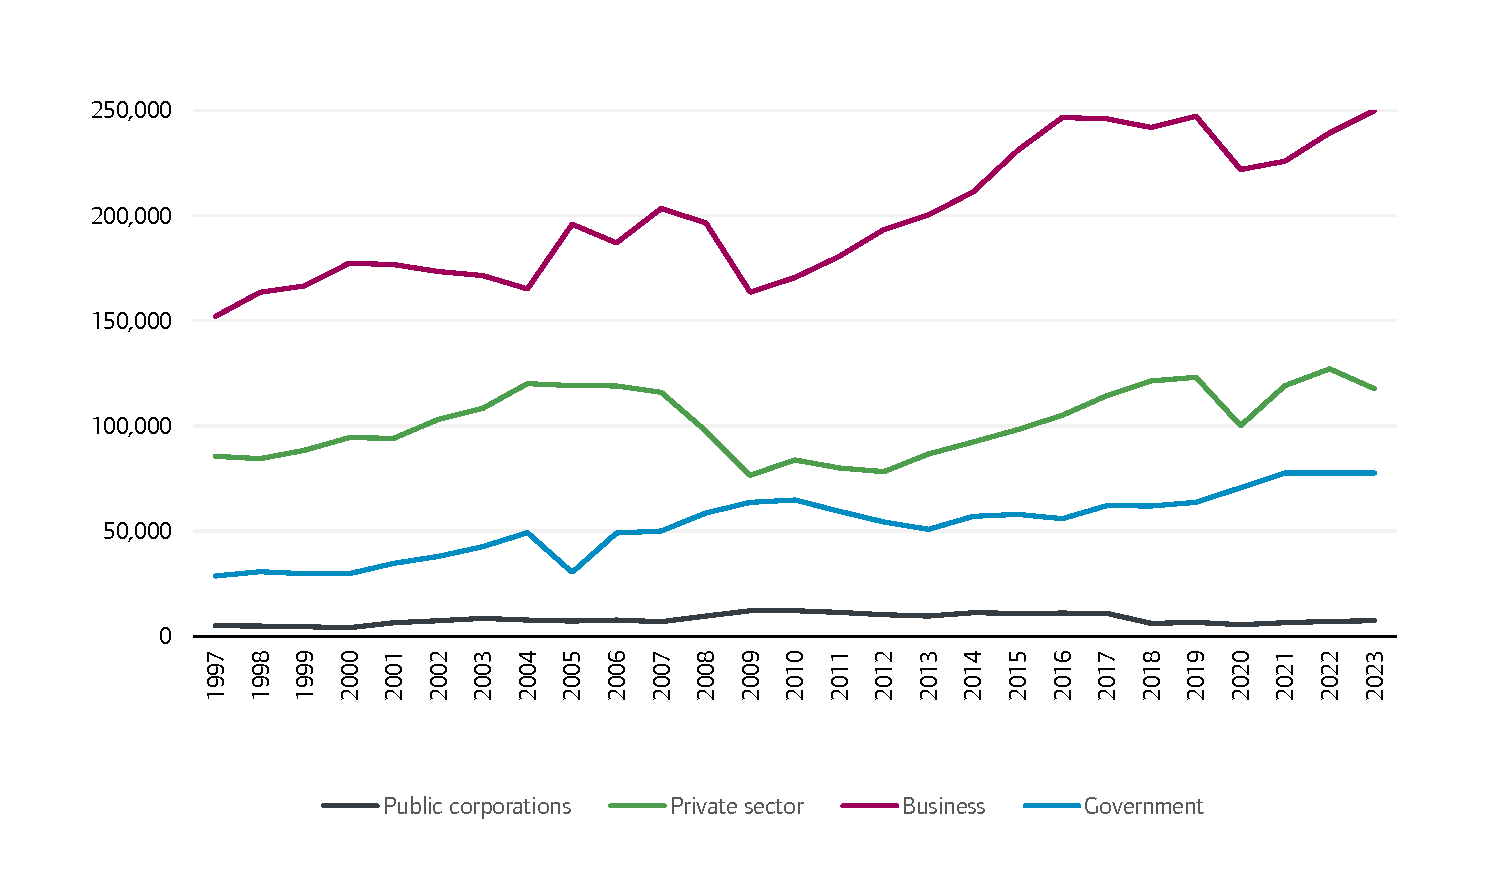
Source: ONS
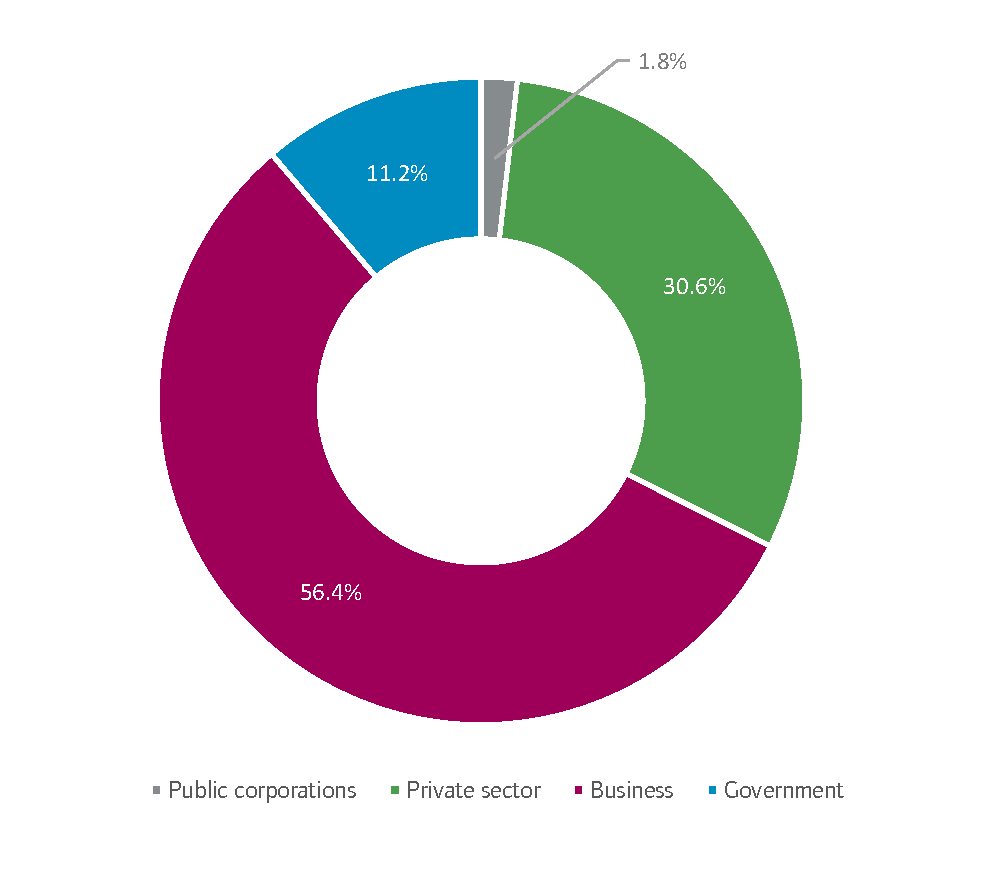
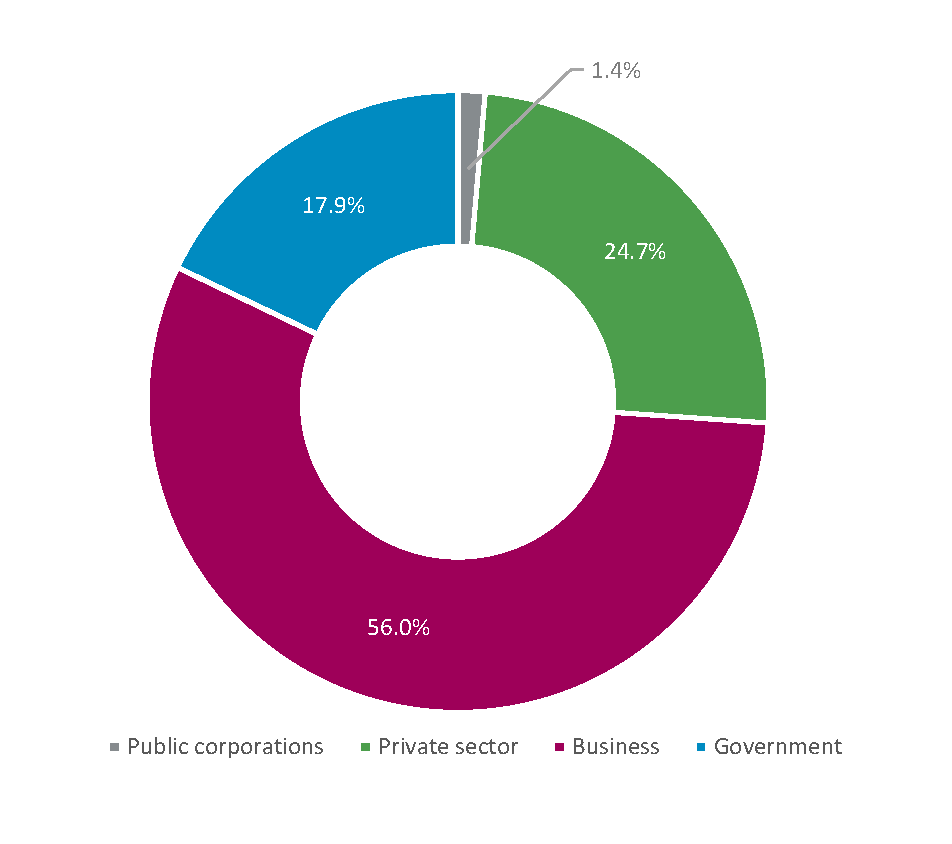
Over the past 25-30 years, businesses have been the major sector in terms of investment volume, comprising more than 50% of total gross fixed capital formation in the UK in each and every year. In fact, in 1997, businesses were responsible for 56% of UK GFCF, and that is the percentage for 2023. That said, the sectoral composition of said investment is quite different when examining the trends for other sectors, as the pie charts in Figure A3 reveal.
Figure A3: Sector composition of UK investment (1997 and 2023)
1997
2023
Source: ONS
These figures show that between the late 1990s and 2023, two shifts occurred in UK GFCF:
- The share of government investment has risen by nearly 7 percentage points, and
- The share of other private investment (excluding private businesses) decreased by nearly the same number of percentage points.
Therefore, the past 25 years or so have seen a growing role of government investment in the UK economy, while private sector investment (particularly in dwellings) diminished. It is important to note, meanwhile, that the UK’s public-sector productivity has been generally flat since 2008 (and this has contributed to the country’s poor overall productivity record). This would suggest that the increased share of government investment has not facilitated productivity growth, and thus it did not help the country reverse its poor GDP growth especially since the Financial Crisis.
Figure A4 reveals the growth rates of both GFCF and national GDP (in real terms) from 2000 to 2019. Broadly speaking, there’s a correlation between growth in investment and GDP. However, that correlation is stronger and clearer prior to the Financial Crisis. Since then, the relationship has weakened; this would suggest that the Financial Crisis introduced additional variables or factors that have ‘diluted’ the role of public and private investment in boosting growth.
Figure A4: Growth of real GDP and real GFCF (2000-2019)
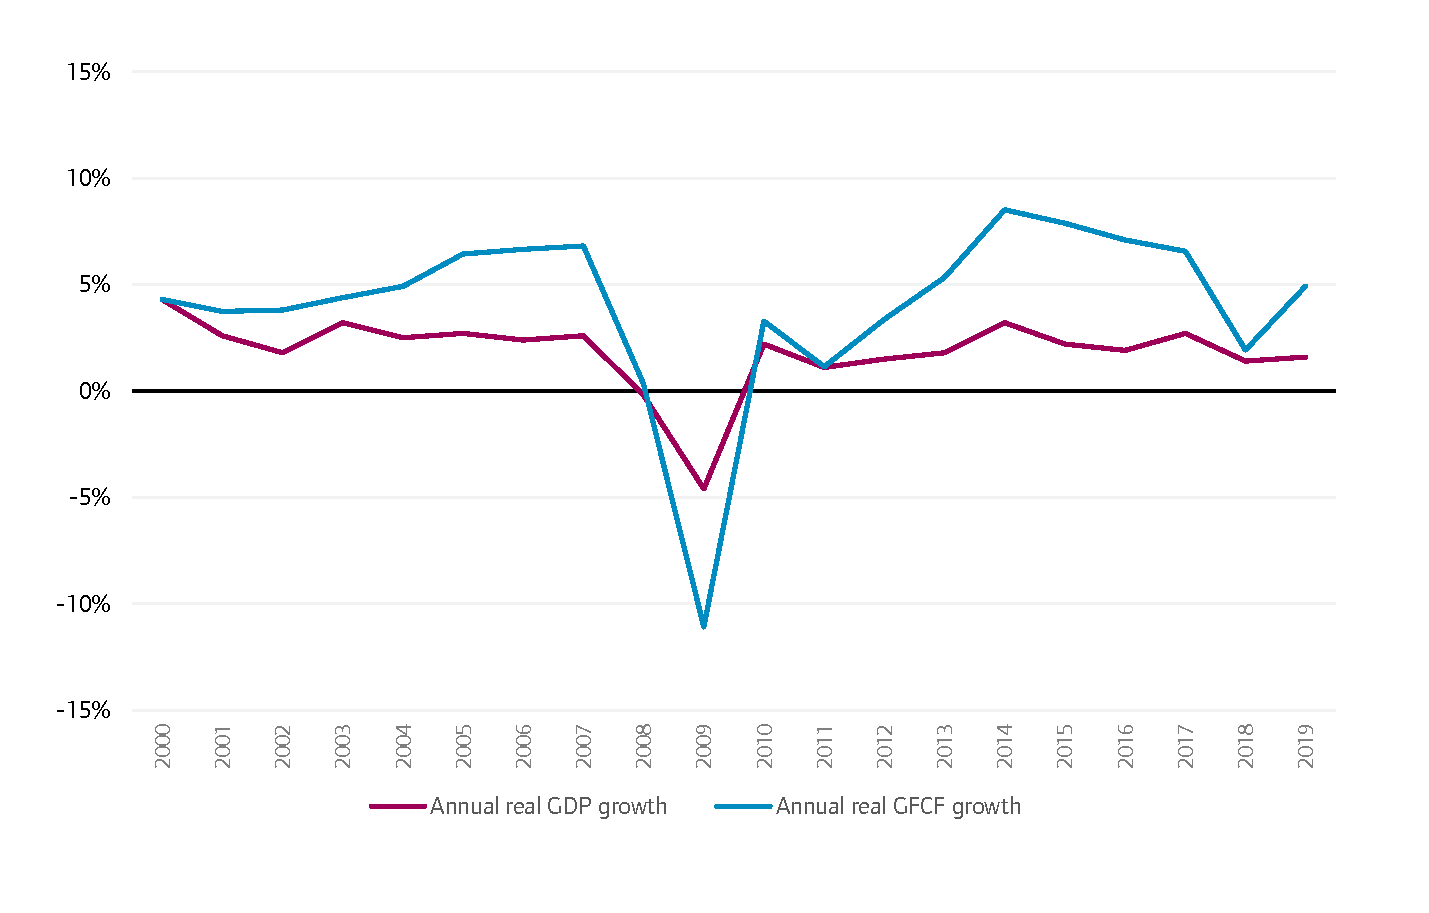
Source: ONS
Earlier, it was noted that the share of government investment out of total investment grew by nearly 7 percentage points between the late 1990s and 2023. Looking at government investment exclusively, it grew by nearly 180% in real terms between 1997 and 2023. This compares to a 73% growth rate in total investment over the same period, 72% in business investment, and 39% for private investment.
That said, despite the increase in share of government investment in recent years, the UK still underperforms the OECD average. Figure A5 presents government investment as a share of total GFCF by OECD country for 2019, and the UK lagged most G7 countries (except Italy and Germany).
Figure A5: Government investment as a % of total GFCF by G7 country
Source: OECD
This also seems to corroborate data from the Office for Budget Responsibility’s (OBR) 2020 Economic and Fiscal Outlook[2], which showed that when it comes to government investment,
“the UK was consistently positioned within the bottom quarter in terms of government investment as a share of GDP – more specifically, it was ranked between 23rd and 27th out of 30 countries in every year. UK government investment was a little higher as a share of GDP in 2017 than in 2007, having first risen during the crisis then fallen back. The large increase over the next five years will take it to around the present OECD median. But it will still fall well short of levels in countries whose governments invested most over the past decade – in South Korea, Estonia and Latvia investment averaged around 5 per cent of GDP a year”. – OBR EFO March 2020 page 100.
There are two takeaways from this:
- Despite the UK increasing its share of government investment, this has not translated effectively into growth over the past 15 years.
- Despite that increase in share, the UK still lags the OECD average and most other G7 countries.
UK Investment by Asset
In addition to examining the data by sector, it is worth looking at the asset composition of UK investment. ONS data breaks down GFCF investment by the following five asset types: transport equipment, ICT equipment and other machinery/equipment, dwellings, other building structures and transfer costs, and intellectual property products. Figure A6 looks at real investment by asset from 1997 to 2023.
Figure A6: GFCF by asset
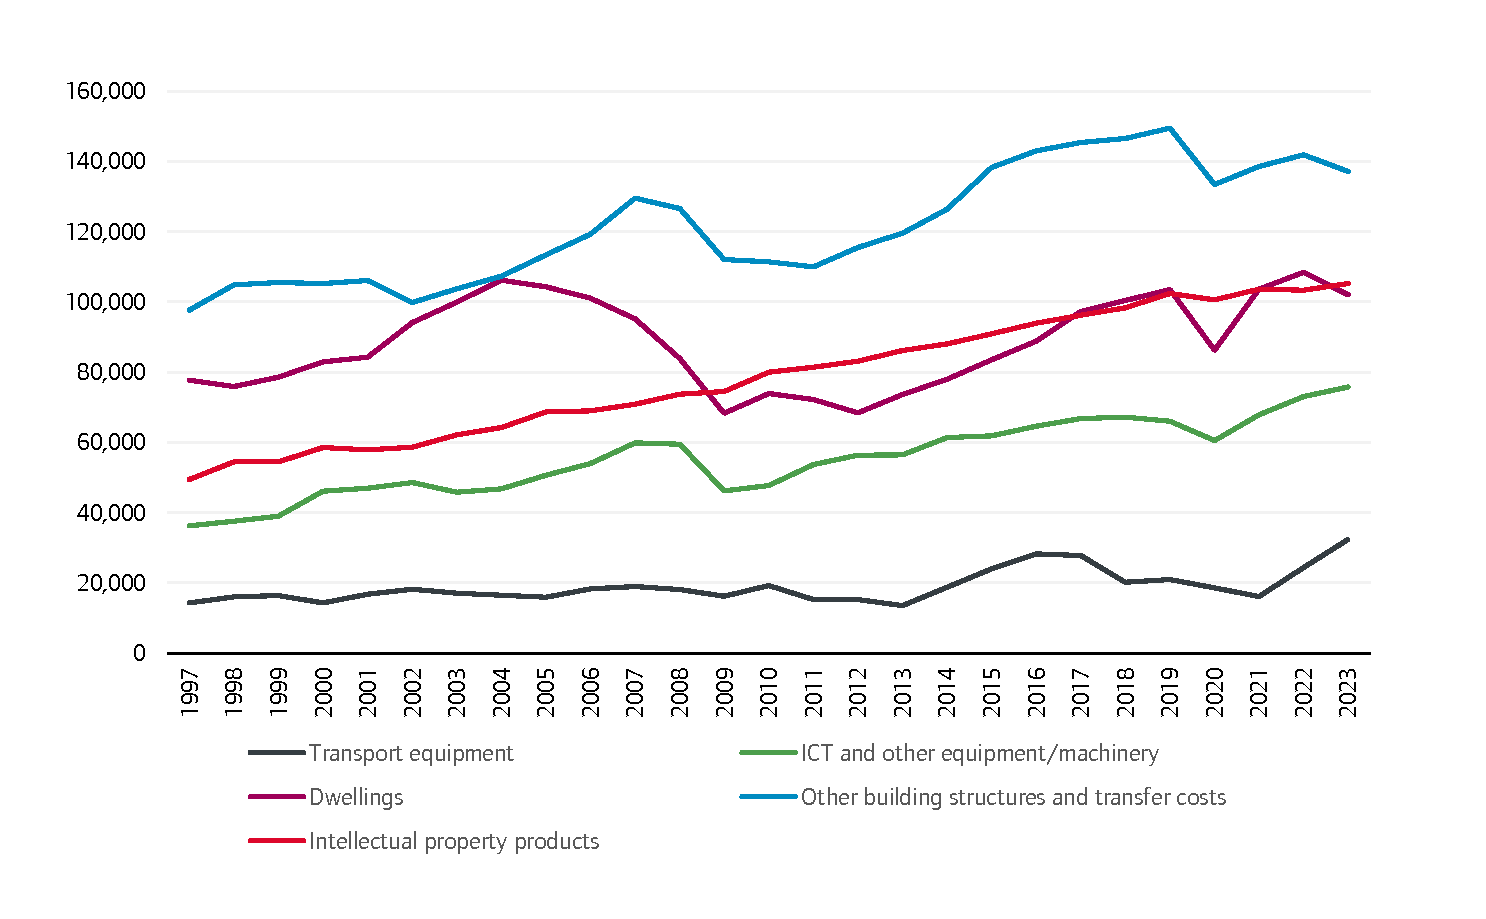
Source: ONS
Over that period, dwellings and other building structures represented at least 50% of investment assets in each year. That said, their share of total investment dropped from 63% in 1997 to 53% in 2023. With that in mind, the asset composition of said investment is quite different when examining the trends for other assets, as the pie charts in Figure A7 reveal.
Figure A7: Asset composition of UK investment (1997 and 2023)
1997
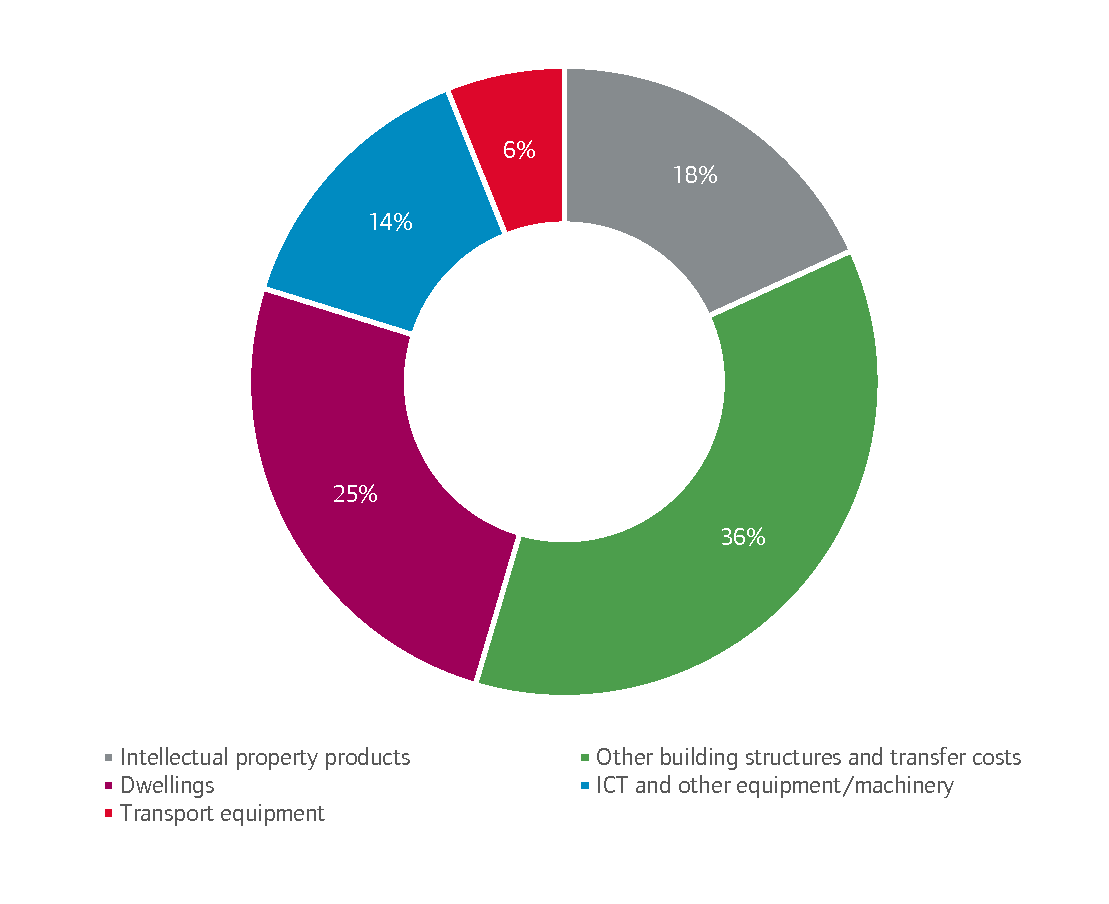
2023
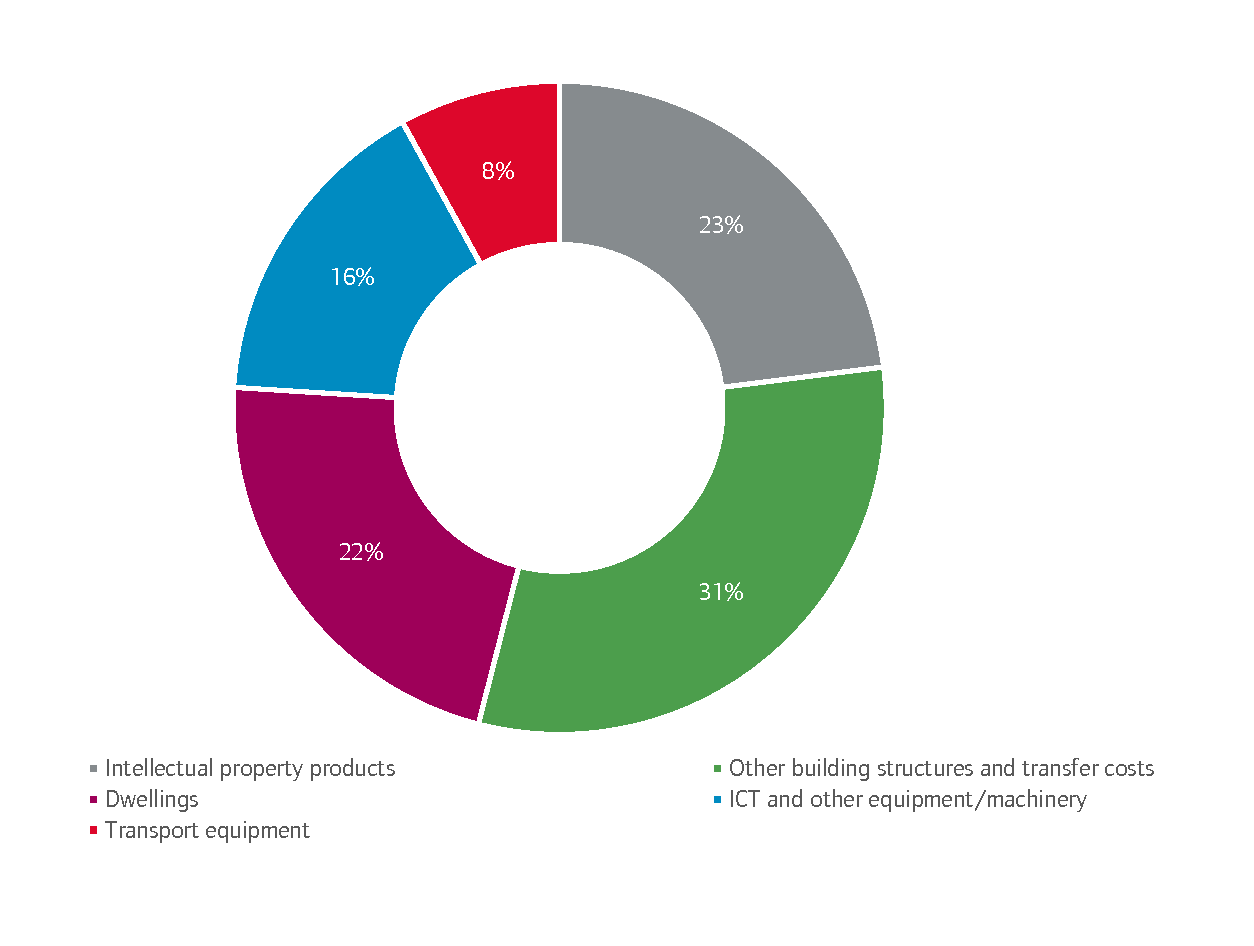
Source: ONS
The pie charts show that between 1997 and 2023, the share of dwellings and other buildings has decreased, whilst being offset by investment in machinery, transportation, and intellectual property. This could reflect, in part, the UK economy’s changed industrial structure away from manufacturing towards professional services over the past several decades. An economy that relies more heavily on service provision would likely benefit from greater investment in assets that support this type of activity.
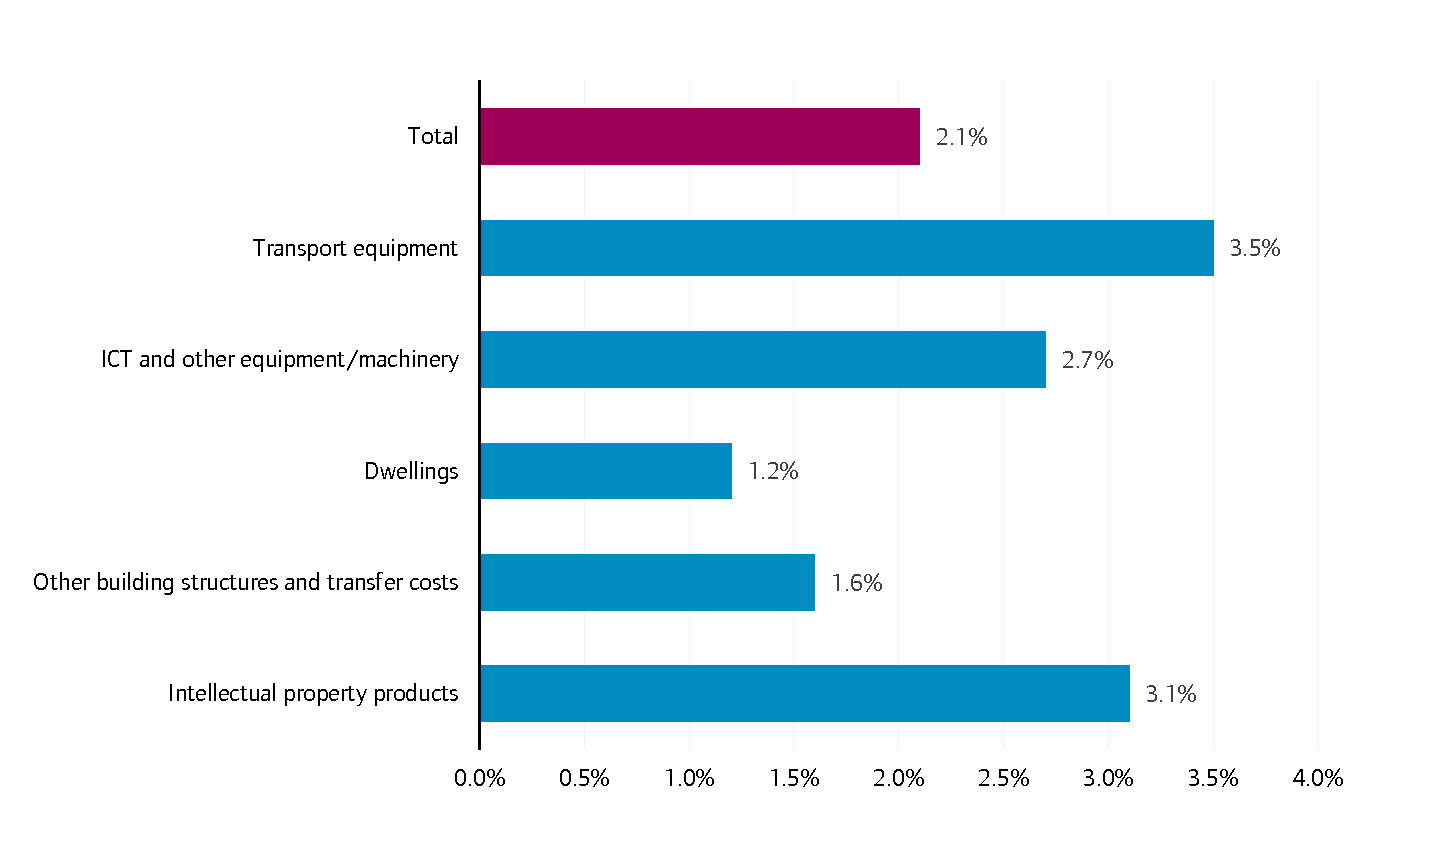
Figure A8 looks at the annual growth rate of investment by asset type between 1997 and 2023. Total GFCF (in real terms) grew annually by 2.1% over that period; to put this in context, this compares to an annual real GDP growth rate of 3.6% between 2000 and 2019. Meanwhile, the annual growth rates in real GFCF differ by asset type: investment in transport equipment, for example, grew annually by 3.5% in real terms. Intellectual property investment, meanwhile, grew by 3.1%. At the other end of the spectrum, investment in dwellings grew by 1.2%, while that for other buildings grew by 1.6% annually- which explains their declining share of total GFCF over the course of the 26-year period.
Figure A8: Annual real growth rate of investment by asset type (1997 to 2023)
Source: ONS
Looking at investment by asset type again, the share of investment in transport, machinery, and intellectual property offset the drop in the share of investment in dwellings and other buildings. In particular, investment in intellectual property has grown by 5 percentage points in real terms, whilst experiencing a 119% growth in total; this is only exceeded (in percentage terms) by the 142% growth in investment in transport equipment over that period.
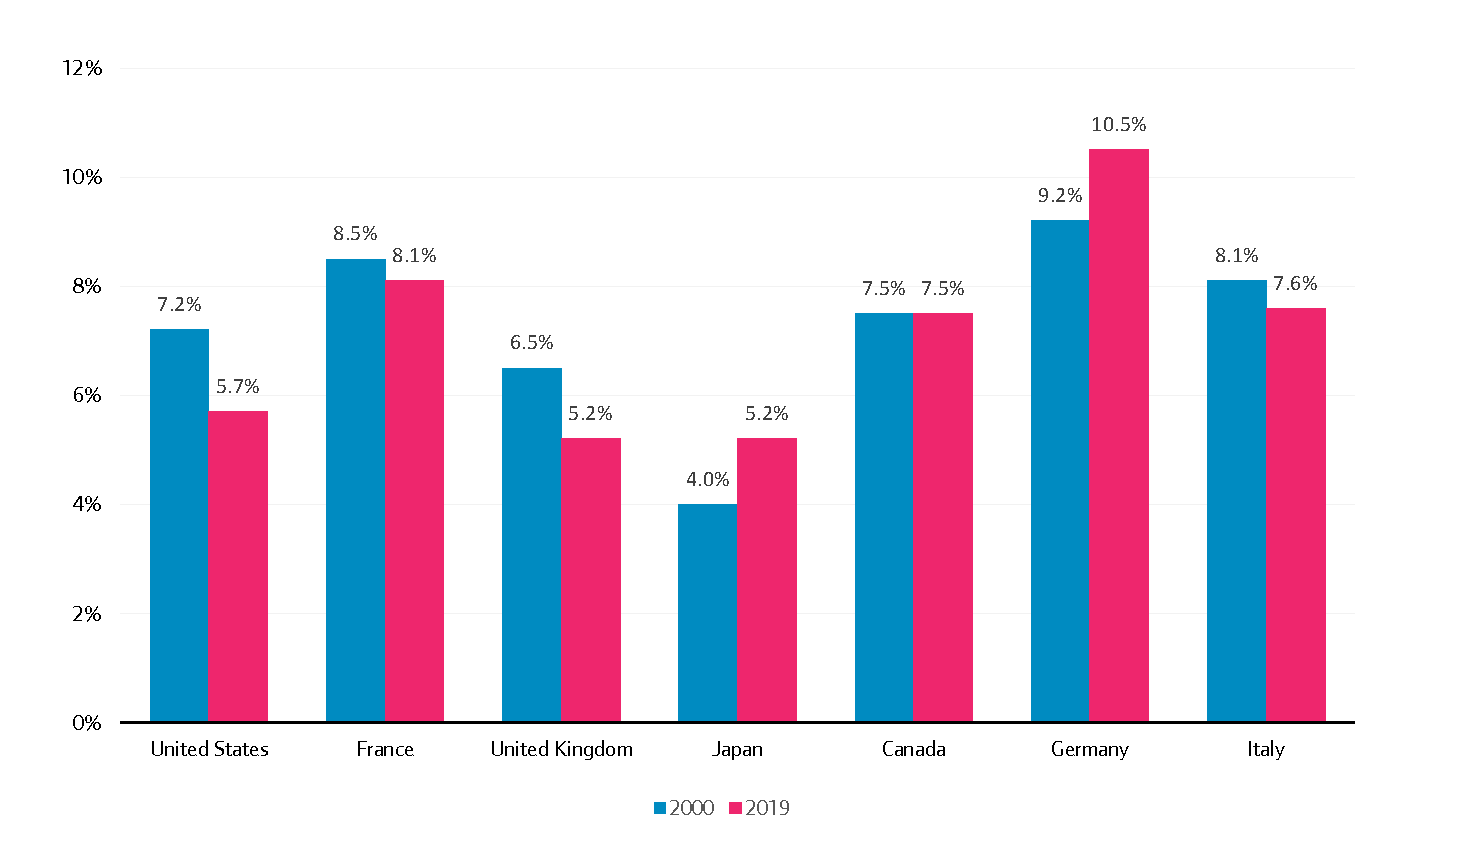
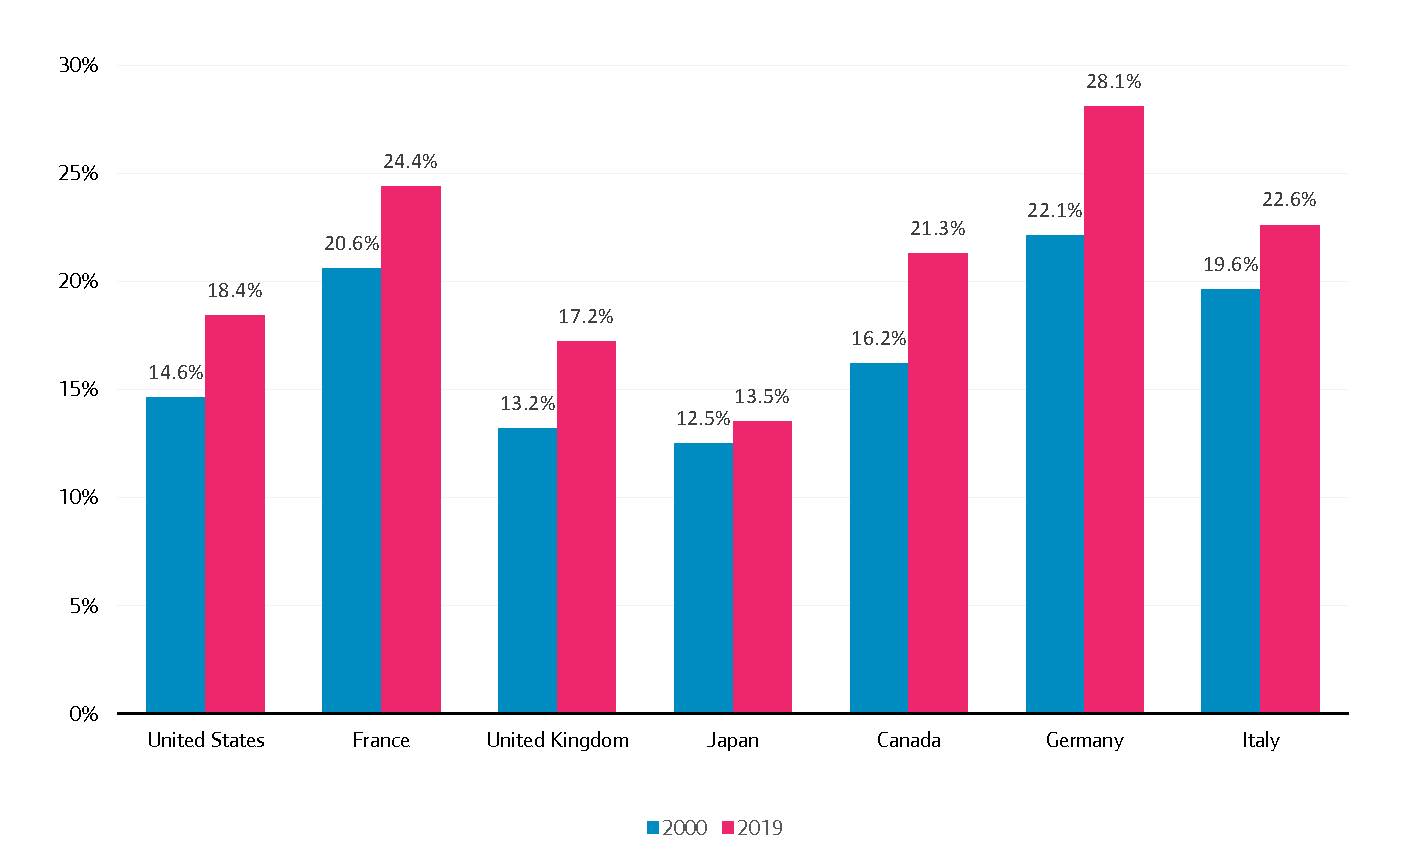
Finally, a comparison of investment breakdowns by asset across the G7 in 2000 and 2019 reveal a few interesting trends (see Figures A9 and A10):
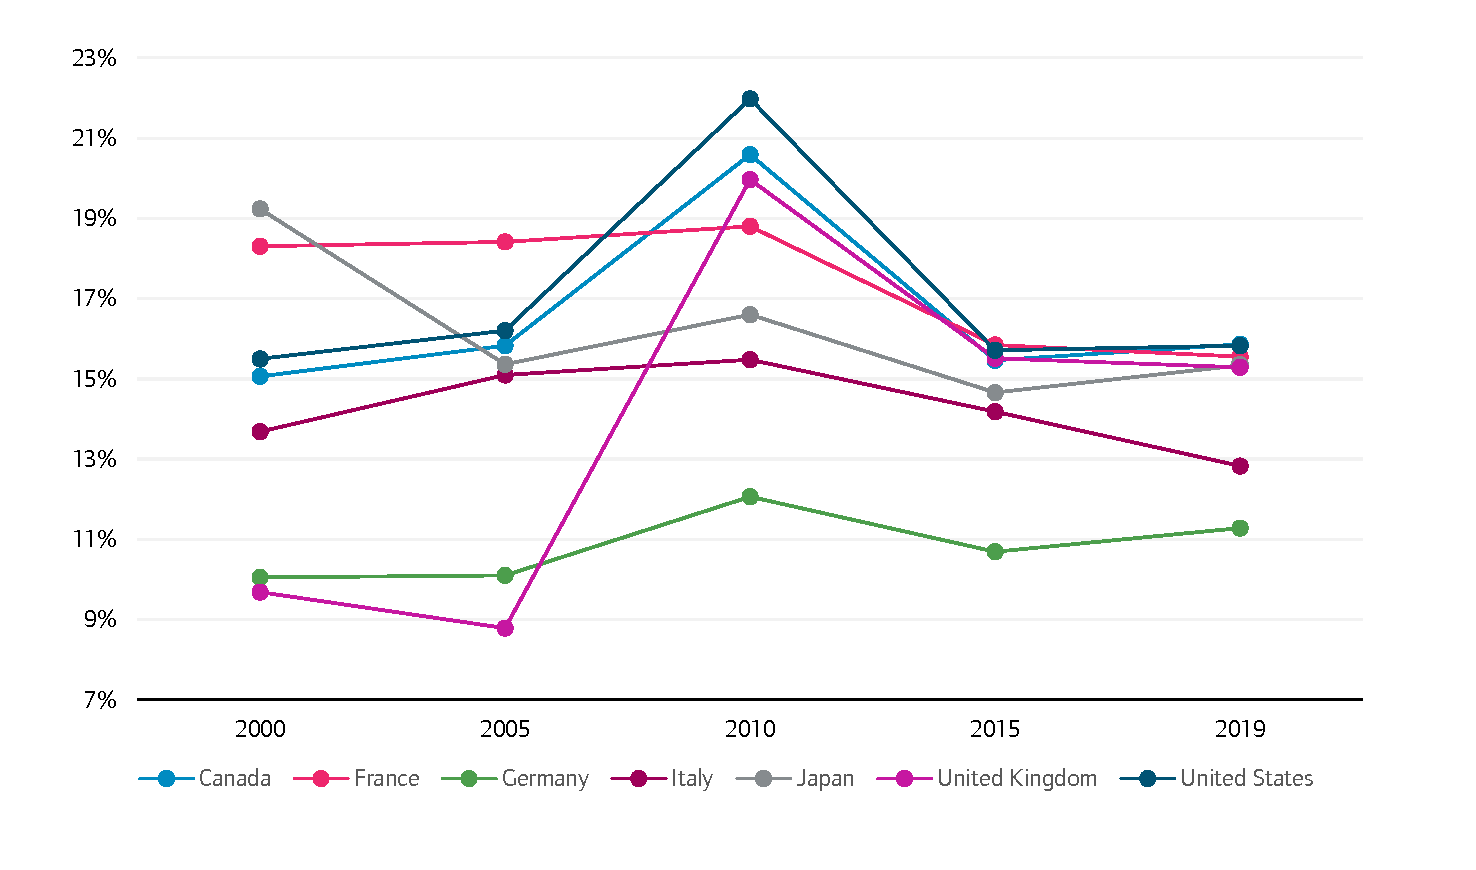
- While the share of UK investment in intellectual property has increased over the past 25 years, that investment as a share of total GFCF remains lower in the UK than it is in all G7 countries except Japan; that ranking has not changed in 2019 compared to 2000.
- Investment in transportation as a share of total GFCF remains lower in the UK than it is in all other G7 countries (tied in last place with Japan).
- This would suggest that the UK relies more on investment in other building structures than other G7 countries.
Figure A9: Investment in transport as a % of total GFCF by G7 country (2019 vs. 2000)
Source: OECD
Figure A10: Investment in intellectual property as a % of total GFCF by G7 country (2019 vs. 2000)
Source: OECD
With all this in mind, there are a few takeaways:
- The asset composition of UK GFCF, while still disproportionately reliant on dwellings and other buildings, has shifted towards investment in transport, machinery and intellectual property over the past 25 years.
- That said, the asset composition of UK GFCF differs slightly from that of most other G7 countries. Building structures still compose a large share of total GFCF in the UK, and the country’s share of investment in transport and intellectual property still lags that of most other G7 countries (as it has been since 2000).
The afore-presented takeaways potentially point to the challenges facing the UK as it attempts to promote productivity and growth via greater investment. While investment by asset type is transitioning away from dwellings and other buildings towards assets that lend themselves to supporting the country’s service-based economy (especially transport and intellectual property), there has been little in the way of evolution by sector over the past 25 years, with government slightly increasing its share at the proportionate expense of private entities. That said, the challenges become more apparent when comparing UK GFCF with that of other G7 and OECD economies. In one sense, the UK differs from other G7 countries when it comes to the investment mix by sector and asset, with a reliance on asset types (e.g., other building structures) that these other countries broadly do not share. In addition, the amounts invested (whether as a percentage of GDP or per capita) tend to lag the averages for both the OECD and G7 economies.
[1] Taken from: ONS (2017). ‘A short guide to gross fixed capital formation and business investment’.
[2] OBR (2020). ‘Economic and fiscal outlook – March 2020’.