
The facts about transport spending in London
By Mark Wingham.
You often hear in the media that London receives a lot more in transport spending than any other region. And yes, more is spent in London in total than anywhere else in the UK – around £8.5 billion was spent by the public sector in 2015-16, more than a quarter of the UK total. However, that comparison is flawed.
It doesn’t consider the demand or need for transport in a region. In London, there are acute capacity issues with its transport network. For example, there were around 31.5 million daily journeys in 2015 – almost a quarter more than in 2000 – and means that overcrowding on trains and the number of hours idling in traffic in the capital is worse than other UK cities. You can read more about the issues facing London’s transport system in Chapter 6 of the Economic Evidence Base for London.
It also isn’t necessarily appropriate comparing investment in terms of the total amount spent. That’s because it doesn’t consider the benefits of the investment itself or the size of the economy it supports. The latter point is especially important as a good transport system is essential in supporting an economy. For example:
- Faster, more efficient journeys can lead to time and cost savings.
- It can provide access to new markets enabling firms to sell their products to a larger audience.
- It can allow people to access more jobs across a larger area.
- It can stimulate private sector investment.
- It can lead to agglomeration benefits where positive externalities (such as productivity gains) arise from specialised economic activity taking place in a spatial concentration.
Comparisons with London and other UK regions aren’t necessarily on a like-for-like basis either. Transport is likely to represent a larger proportion of spending in an urban rather than rural area. Given that London is entirely urban, whereas other regions are a mix of urban and rural areas, the capital is likely to be compared at a disadvantage. Instead, it may be more appropriate to make comparisons with the Greater South East (GSE) – London, South East and East of England – which is more balanced in terms of land use. London also has a large number of commuters who use the capital’s transport system giving further argument for using the GSE in comparisons.
Given these points, the facts around transport spending across the UK are quite different to those presented by the media. For instance:
- Transport spend per head across the GSE is around half that for London on its own, though still above the UK average.
- Looking at the actual number of transport users gives a much more accurate representation of demand for transport. On this basis, the amount spent on railways per rail passenger journey and the amount spent on roads per 1 million vehicle miles in London was one of the lowest in Great Britain (see Figure 1).
- Transport spending as a share of economic output (measured using gross value added) in London was largely on par with Wales and Scotland; while for the GSE more generally, it was in line with the UK average. This means that transport expenditure in London and the surrounding area was proportionate to the size of its economy.
- It is also worth considering public sector expenditure in terms of the amount of tax a region generates. On this basis, London raised more in tax than it received in total public sector spending.
Figure 1: Road and railway public sector expenditure per user for London and Great Britain in 2015-16
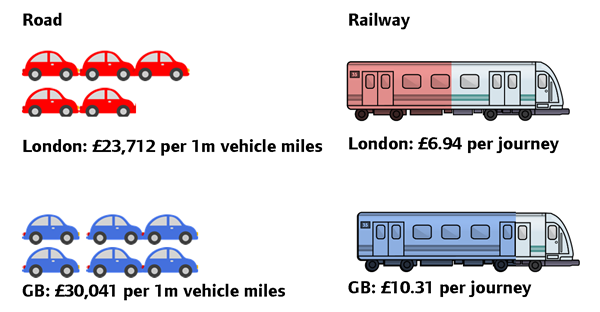
Source: HM Treasury Public Sector Expenditure Analysis, Department for Transport Road Traffic Statistics, Office for Rail and Road Regional Statistics, GLA Economics calculations
It should also be noted that London is increasingly paying directly for its own transport investment. For example, more than half of the cost of Crossrail 1 is funded directly by London businesses and Londoners. This includes the Crossrail business rate supplement which is an additional tax on London businesses only and, being a new tax, does not ‘subtract’ funds from other transport projects. However, the fact that London is directly contributing to the cost of its transport projects is not shown in the public sector expenditure data used above. Consequently, again, the above comparisons may give a misleading view of transport spending.
Investing in London’s transport network should also not be seen as being at the expense of other parts of the UK. On the contrary, with the Growing Together II report by GLA Economics suggesting that London’s growth is beneficial to the rest of the UK. This can be in the form of investment creating demand for goods and services along the supply chain to ensuring London remains internationally competitive which otherwise means business would go to other global cities rather than other parts of the UK.
So, overall, while initially London receives more than a quarter of the UK’s expenditure on transport, it is reflective of the demand and need for transport in the capital. That is, London has one of the lowest amounts of railway expenditure and road spending per ‘user’ in Great Britain; total spending is in proportion to the size of the economy; and London receives less in public expenditure as a whole than what it contributes in tax. London is also directly contributing to the cost of its transport projects, something not captured in the statistics. And investing in London’s transport system should not be seen as a ‘zero-sum game’ as essentially when London grows, the rest of the UK grows too.
More information about London’s transport expenditure can be found in GLA Economics Current Issues Note 54 which is available to download from the GLA Economics publications webpage.