
Payrolled employments by nationality
The share of payrolled employee jobs among London residents that are held by non-UK nationals has been increasing since the UK’s formal exit from the European Union and the start of the pandemic in early 2020. A big increase in jobs held by non-EU/non-UK citizens has been driving this change, even as the number held by EU citizens has fallen. We have recently published analysis looking into this.
It examines payrolled employee jobs over the period from July 2014 to December 2023, using HMRC data. This includes three years of the new points-based immigration regime implemented in January 2021, which corresponds to the end of free movement between the EU and the UK.
Last week, HMRC released new data for the same time period, which further breaks-down the trends shown here by gender and by age and will be the subject of further analyses in the future.
Figure A1
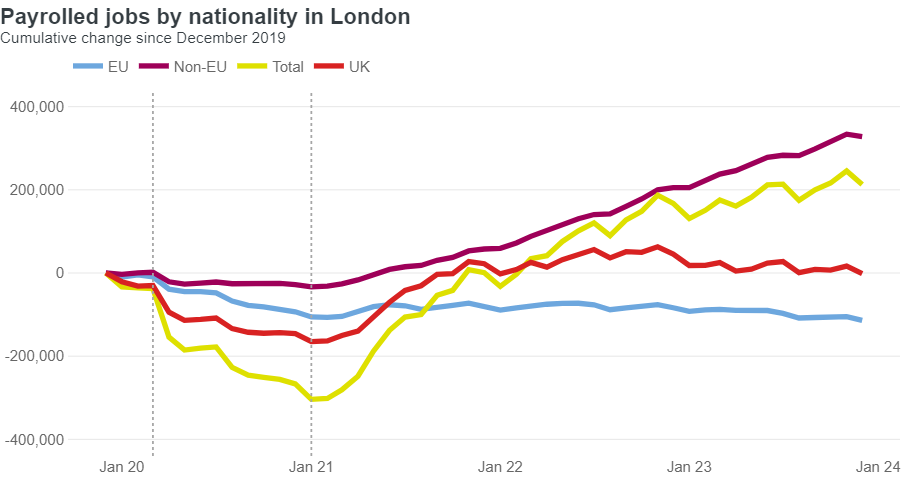
Source: HM Revenue and Customs – Pay As You Earn Real Time Information (non-seasonally adjusted) and Migrant Worker Scan.
Note: Estimates are based on where employees live. Vertical lines indicate beginning of lockdowns in March 2020, and end of free movement in January 2021, respectively.
The data shows that the number of jobs among London residents held by non-UK/non-EU workers – henceforth Rest of the World (RoW) – reached nearly 1.18 million in December 2023, up from around 850,000 four years earlier. Jobs held by EU workers fell to around 740,000 from 850,000, and UK worker employments held steady at 2.73 million.
Figure A1 shows the cumulative change in workers by nationality group in London since the eve of the pandemic: the gain of more than 300,000 payrolled employee jobs from the Rest of the World has sustained most of the payrolled employee growth in London over the period.
Jobs held by EU workers in London are now below their June 2016 level, and way below the number of jobs held by RoW workers, whereas just before the pandemic, in December 2019, there were roughly as many EU and RoW payrolled jobs in London.
Figure A2 shows the importance of the non-UK workforce by region/country of the UK.
More than 40% of payrolled jobs of Londoners are held by non-UK workers (25.4% RoW and 15.9% EU), compared to 18% nationally, and 19% in the South-East, the second region with the most non-UK jobs.
The London rate is more than four times bigger than the rate in Wales, the country/region with the lowest number of jobs held by non-UK citizens.
Figure A2
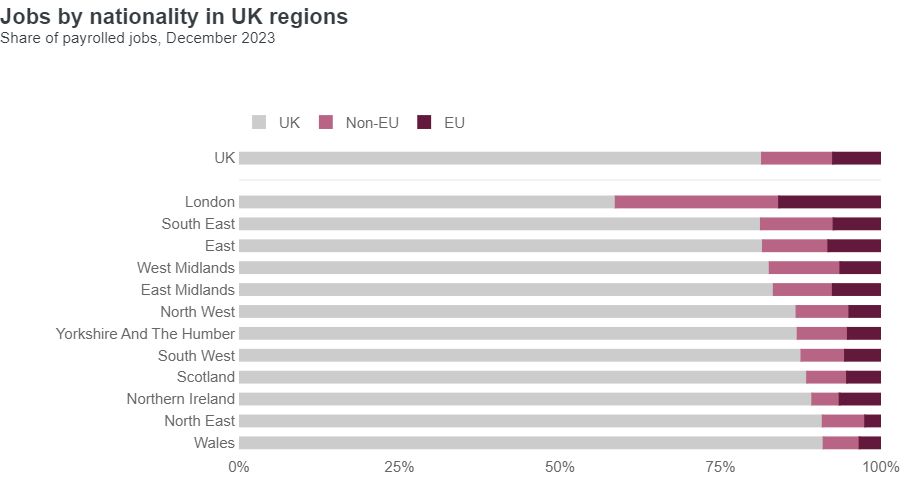
Source: HM Revenue and Customs – Pay As You Earn Real Time Information (non-seasonally adjusted) and Migrant Worker Scan.
Note: Estimates are based on where employees live.
But London has seen smaller proportional gains of RoW jobs than the rest of the country since free movement with the EU ended and lost slightly more EU-held employments, as shown in Figure A3.
Figure A3
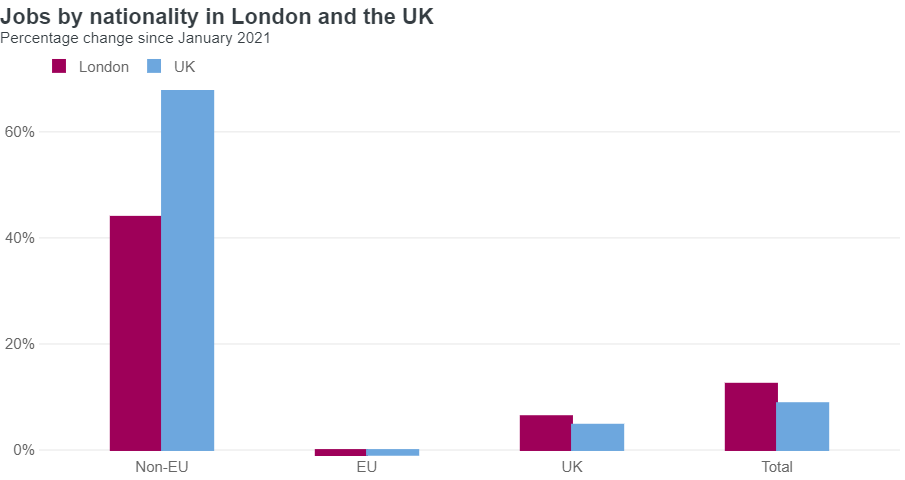
Source: HM Revenue and Customs – Pay As You Earn Real Time Information (non-seasonally adjusted) and Migrant Worker Scan.
Note: Estimates are based on where employees live.
There are also important variations in how much different sectors of London’s economy rely on UK, EU and RoW workers, and in the sectoral changes over time in the number of workers by nationality group, which Figure A4 explores.
In December 2023, the three biggest industries in terms of payrolled jobs in London were the Health & Social Care sector (576,800 payrolled jobs), the Wholesale and Retail sector (559,800), and the Professional Services sector (549,700).
The number of London residents’ jobs in Health & Social Care was just under 600,000 at the end of 2023. The post-2020 rise in payrolled jobs in the sector is almost entirely supported by RoW workers.
The number of payrolled jobs in retail is still below pre-pandemic levels and it is the only sector in London under pre-pandemic levels as of December 2023, with fewer EU and UK workers but more RoW workers.
Figure A4
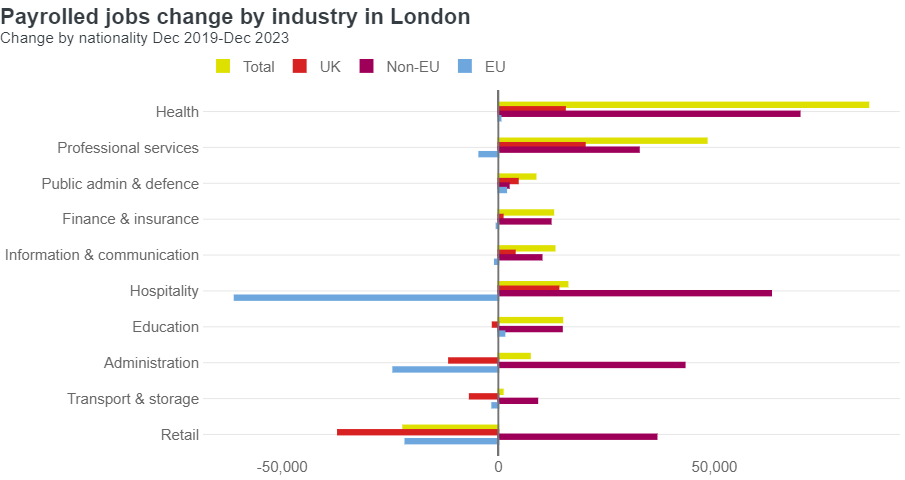
Source: HM Revenue and Customs – Pay As You Earn Real Time Information (non-seasonally adjusted) and Migrant Worker Scan.
Note: Estimates are based on where employees live.
Professional services jobs have grown throughout the 2020-2023 period, with the sector gaining nearly 50,000 payrolled jobs between December 2019 and December 2023. The rise in RoW workers is the key component of this growth, with the number of UK workers also rising.
How the Finance & Insurance sector would fare in the post-Brexit context has generated a lot of public debate and research. There were more jobs in the sector in December 2023 than in December 2019, despite a small fall in the number of EU-held jobs in that period. That fall seems to be linked to the onset of the pandemic, as the number of EU-held jobs in the industry rose in the more recent period between January 2021 and December 2023.
Finally, the hospitality sector lost many jobs during the lockdowns, affecting workers of all nationality groups. From 2014 to 2020 there were more EU workers in hospitality than there were UK or ROW workers. But the jobs recovery after the loss of around 100,000 jobs (or 25% of the pre-pandemic workforce) during lockdowns, was uneven.
In hospitality, there were only 113,000 payrolled EU jobs in December 2023, down from 174,000 in December 2019. This has been compensated by a rise in UK and RoW payrolled jobs. UK jobs rose from 156,00 to 171,000 over the same period, while RoW jobs rose from 92,000 to 155,000.
Overall, the story in London is a rise in the number of payrolled employee jobs held by non-UK workers, with a sharp increase of RoW jobs, a fall in EU jobs, and a steady number of jobs held by UK citizens. London stands-out in the UK in terms of how much its workforce relies on non-UK workers. 32.3% of all payrolled employee jobs in the country that are held by non-UK nationals are located in London, though this is down from 39% a decade ago. Different sectors of the economy rely on different nationality mixes in their workforce, and have fared differently regarding changes in UK, EU, RoW and total workers since 2019.
These issues and more are explored in details in our latest release on employment by nationality in London, which offers more trends and a deep-dive into a selected few sectors of the economy facing shortages of workers. We regularly update this analysis as new data becomes available, and as part of our wider research and analyses of the London labour market, which can be found on the London Datastore.