
London's creative industries - 2017 update
By Christopher Rocks, Economist.
Since 1998 the Department for Culture Media and Sport (DCMS) has grouped together sub-sectors as wide ranging as visual arts, advertising and computer services to classify and measure the ‘creative industries’. These sub-groups are described as:
‘those industries which have their origin in individual creativity, skill and talent and which have the potential for wealth and job creation through the generation and exploitation of intellectual property’[1].
At GLA Economics we have regularly adopted the DCMS definition to analyse the creative industries at a London level. In a recently published report[2], we revisit a variety of official statistics to provide our latest understanding of the sector in terms of output, employment, and productivity. This article summarises some of the key findings.
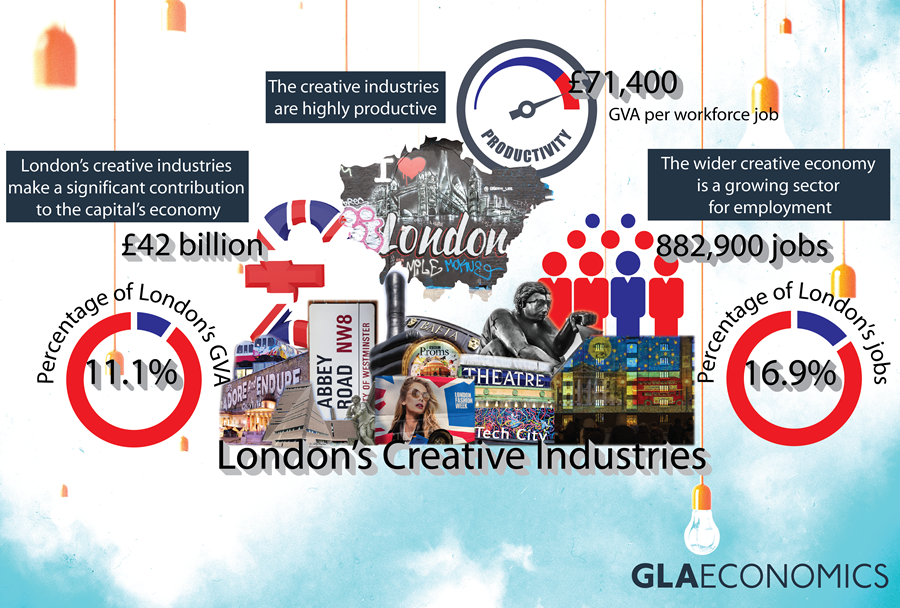
The creative industries are an increasingly significant part of the London economy – led by IT, software and computer services
In 2015 the output (as measured by Gross Value Added (GVA)) of the creative industries in London was estimated at £42.0 billion. This accounted for 11.1 per cent of total GVA in London, and for just under half (47.4 per cent) of the sector’s output nationally.
Indeed, the sector has become increasingly important to the London economy in recent years. Since 2009 the GVA of London’s creative industries increased by 38.2 per cent in nominal terms, compared to 30.6 per cent growth across all sectors of the capital’s economy – with evidence suggesting that the clustering of creative businesses and workers is key to the sector’s performance[3].
Like in the rest of the UK, IT, software and computer service accounts for the largest share of London’s creative industries output – contributing 38.0 per cent of the sector’s GVA in 2015, and for over half of its growth since 2009. At the other end of the scale, Crafts contributes the least to measured GVA, followed by Museums, galleries and libraries[4] (see Table A1).
Table A1: GVA for the creative industries groups, London and Rest of the UK, 2015
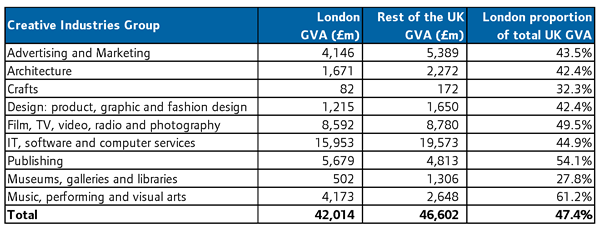
Source: GLA Economics calculations
Across London’s creative economy, employment is up by over a quarter since 2012
Turning to jobs, London’s creative industries also make up a considerable share of the capital’s employment. There were 622,600 jobs in London’s creative industries in 2016 – 11.9 per cent of all jobs in the capital, compared to 4.9 per cent in the rest of the UK.
Using the wider definition of the sector – which includes creative jobs outside of the creative industries – there were 882,900 jobs in London’s creative economy. Again, this follows strong growth, with employment up by almost a quarter (24.2 per cent) since 2012 (see Figure A1). This was a significantly higher rate of jobs growth than for London as whole (14.4 per cent) or for the sector in the rest of the UK (16.5 per cent).
Figure A1: Change in creative economy employment and total employment, London and the Rest of the UK, 2012-2016 – Index 2012 = 100
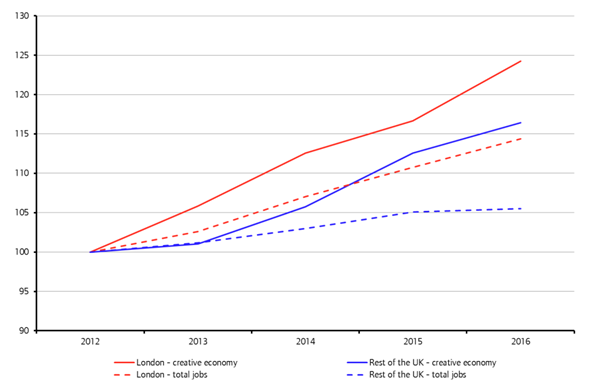
Source: GLA Economics calculations based on ONS Annual Population Survey (APS), 2012-2016
The fastest growing area of London’s creative economy employment since 2012 has been Advertising and marketing. Between 2012 and 2016 the number of jobs in the sub-group rose by 41.7 per cent; this was closely followed by Music, performing and visual arts (+40.5 per cent) and IT, software and computer services (+37.2 per cent).
Jobs in the creative industries tend to be well-paid and highly productive
At £20.38 per hour, gross median hourly pay for ‘creative’ employees was almost a third higher than for those working outside the creative economy in 2016. This reflects the sector’s occupational structure – with the vast majority of jobs found in higher-paid occupational groups. At the same time, just over 1 in 4 creative economy jobs are held by self-employed workers (27.8 per cent, compared to 16.8 per cent in the non-creative economy), and these are not covered in the analysis of earnings.
In-line with higher employee pay, London’s creative industries are also highly productive[5]. Based on GLA Economics analysis, it is estimated that the GVA per workforce job in London’s creative industries was equal to £71,400 in 2015. This was 22.2 per cent higher than the average across all sectors of the London economy, and 35.5 per cent higher than for the creative industries in the UK as a whole.
However, there is significant variation in productivity across the creative sub-groups. The more productive parts of London’s creative industries tend to be in knowledge-intensive and tradable activities. As Figure A2 shows, GVA per workforce job is particularly high in three sub groups: Film, TV, video, radio and photography (£83,200); Publishing (£89,400); and IT, software and computer services (£96,600). Less productive sub-groups are more likely to focus on domestic markets and be more labour intensive[6].
Figure A2: GVA per workforce job for the creative industries, London and UK, 2015
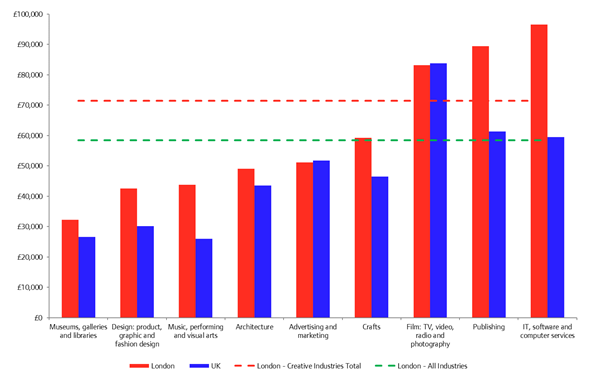
Source: GLA Economics calculations
This report and other GLA Economics analysis can be downloaded from our publications website.
[1] Department for Culture, Media & Sport, April 2001, ‘Creative Industries Mapping Documents 2001’.
[2] The analysis contained within the report uses DCMS definitions for the creative industries and the wider creative economy. Broadly speaking, the creative economy consists of three main groups, the first two of which make up the creative industries:
- Job and industry are both creative;
- Industry is creative but job is not creative (or unknown);
- Job is creative but industry is not creative (or unknown)
The creative industries groups are defined as follows: Advertising and marketing; Architecture; Crafts; Design: Product, graphic and fashion design; Film, TV, video, radio and photography; IT, software and computer services; Publishing; Museums, galleries and libraries; Music, performing and visual arts.
[3] NESTA, July 2016, ‘The Geography of Creativity in the UK’.
[4] Note, some caution should be taken with these GVA estimates. The value of output may be underestimated in sub-groups with a high proportion of small-scale economic activity or where services are provided free at the point of use (i.e. publicly-funded activities).
[5] Note, while this is a widely-recognised measure of labour productivity, it does not fully account for differences in working patterns in different sectors, such as the mix of part-time and full-time workers.
[6] Arts Council England, February 2015, ‘The Economic Impact of Museums in England’.