
Local authority level gross value added estimates for London, 1997-2014
By Gordon Douglass, Supervisory Economist
In December 2015, the Office for National Statistics (ONS) released provisional estimates of regional, sub-regional and local gross value added (GVA) for 2014[1]. These data showed that in 2014, London’s total GVA was over £364 billion, up 6.8 per cent on 2013. London now accounts for 22.5 per cent[2] of the UK’s total GVA (up from 18.9 per cent in 1997). GLA Economics published analysis of these data in March 2016[3]. In this analysis estimates of local authority (LA) level GVA for London for 2014 were calculated for those LAs in London that do not form a unitary NUTS3 geography. Since the publication of this work however the ONS has published estimates of LA level GVA for England only[4] for the years 1997 to 2014. It should however be noted that this data does not have national statistics standing. Still, in order to inform and undertake future analysis on this new data GLA Economics has undertaken a scoping analysis of this data which is given in a recently published current issues note from GLA Economics[5] and which is summarised in this article.
Examining output at the LA level, using the May 2016 estimates from the ONS, Figure A1 shows that Westminster had the highest level of GVA of any London LA in 2014 with it producing output worth £51.0 billion, followed by the City of London at £48.1 billion, while Barking and Dagenham had the lowest GVA of any London LA in 2014 at £3.5 billion.
Figure A1: GVA (I) in London by local authority in 2014
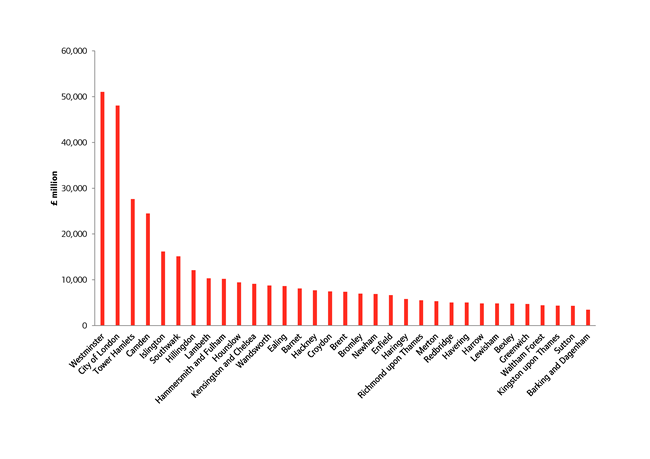
Source: ONS
In terms of the importance of different LAs to the total level of London’s output, the data shows differences between Inner and Outer London over the years 1997 to 2014. For instance the data showed the growing importance of the City of London with it accounting for 9 per cent of London’s output in 1997, rising to 13 per cent in 2014, while Westminster remained important with it accounting for 14 per cent of all London’s output in 2014. In fact a number (but not all) LAs in Inner London, saw their share of London’s total GVA rise or remain constant over this period, while Outer London LAs, despite seeing rises in their nominal GVA over this time period, generally saw a static or declining share of London’s total GVA.
In order to examine the productivity of the different LA’s of London, GVA per employee job has been calculated. As can be seen from Figure A2 there exists a great variance between output per employee job between London’s LAs, with the City of London producing GVA per employee job of £119,755 in 2014, while Hillingdon produced a GVA per employee job of £59,748. However both LAs still produced a higher level of GVA per employee job than the average for Great Britain, 115.2 per cent higher for the City of London and 7.4 per cent higher for Hillingdon. In terms of growth of GVA per employee job between 1997 and 2014, the fastest growth was seen in Kingston upon Thames with a 26.1 per cent increase, while Islington saw the lowest growth with a 1.5 per cent increase. Interestingly it appears that GVA per employee job grew on average quicker in Outer London compared to Inner London over the period 2009 to 2014, while growth in nominal GVA over this period has varied between Inner and Outer London. A likely explanation is that employee jobs generally grew more quickly in Inner London than Outer London over this time period.
The ONS also published data on output per LA by broad industrial sector. This showed that between 1997 and 2014, no London LA saw an increase in Production[6] as a share of its total GVA, while all LAs saw an increase in Real estate as a share of their total GVA. Looking at the data in more detail, Merton saw Business services[7] increase its share of the borough’s GVA from 13 per cent in 1997 to 22 per cent in 2014, while Financial and insurance activities increased in importance in the City of London with it rising from being 60 per cent of total GVA in 1997 to 67 per cent in 2014.
In terms of total London output by broad sector the City of London dominates in Financial and insurance activities accounting for 47 per cent of all London’s output in that sector in 2014, with Tower Hamlets accounting for a further 21 per cent and Westminster 12 per cent. While in terms of Business services Westminster accounted for 16 per cent of London’s total output in that sector followed by the City of London at 13 per cent, Camden at 10 per cent and Southwark at 7 per cent. For Information and communication, Westminster again led with 19 per cent of London’s total output in this sector, followed by Camden (10 per cent), the City of London (9 per cent), Tower Hamlets (7 per cent) and Hounslow (7 per cent). Finally, in 2014 Westminster also had the highest share of London’s output in Other services and household activities[8] (20 per cent of London’s total), Real estate activities (13 per cent of London’s total), Distribution; transport; accommodation and food[9] (14 per cent of London’s total) and Public administration; education; health[10] (13 per cent of London’s total).
Figure A2: Headline GVA (I)[11] per employee job[12] at London local authority level, 2009-2014, current prices
Source: ONS and GLA Economics calculations
If this supplement has whet your appetite then further detailed analysis on local authority GVA in London can be found in Current Issues Note Number 47.
[1] Office for National Statistics, December 2015, ‘Regional Gross Value Added (Income Approach)’.
[2] The share reported here is calculated as London’s GVA divided by UK GVA without taking into account a statistical discrepancy of £6,136 million. If the statistical discrepancy is subtracted from UK’s GVA, London’s share of UK GVA is 22.6 per cent as reported by the ONS.
[3] Douglass, G., March 2016, ‘Current Issues Note 46: Regional, sub-regional and local GVA estimates for London, 1997-2014’. GLA Economics.
[4] ONS, May 2016, ‘Regional GVA(I) by Local Authority in England 1997 to 2014’.
[5] Douglass G., July 2016, ‘Current Issues Note 47: Regional gross value added estimates for London by different geographies, 1997-2014’. GLA Economics.
[6] ‘Production’ refers to Standard Industrial Classification 2007 (SIC07) codes B, C, D and E.
[7] Business services relate to SIC07 codes M and N.
[8] Other services and household activities relate to SIC07 codes R, S and T.
[9] Distribution; transport; accommodation and food relate to SIC07 codes G, H and I.
[10] Public administration; education; health relate to SIC07 codes O, P and Q.
[11] Estimates are for workplace based GVA allocating incomes to the region in which the economic activity takes place.
[12] Calculated by dividing headline GVA by annual employee jobs data from BRES.