
GLA 2020-based population and household projections
On 30th September the GLA Demography Team published the 2020-based population and household projections[1]. Most of our projections are updated annually, incorporating the latest data as it becomes available. This round of projections comprises both variant trend projections, based on the continuation of past trends in population change, and housing-led scenario projections which incorporate considerations of future housing delivery into the projection process. The projections take the ONS 2020 mid-year estimates (in which London’s population is 9.002 million) as their starting point and project to a horizon of either 2050 or 2041 depending on the projection.
Trend projections
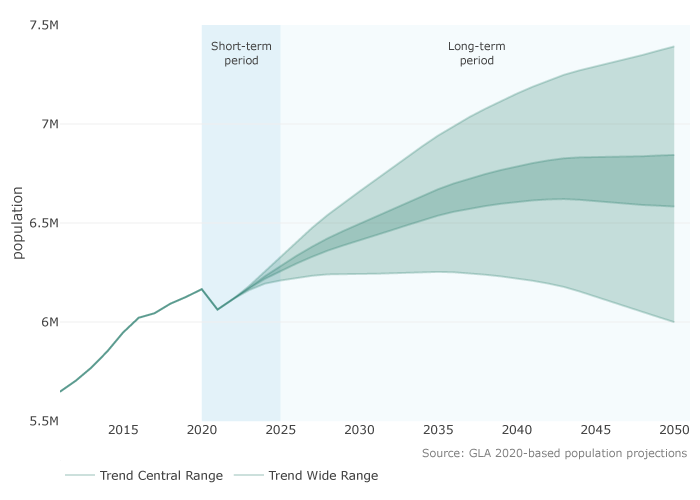
Trend projections are recommended for use in longer-term strategic planning at higher spatial levels (i.e., regional/national). The 2020-based trend projections include four main variants: two projections which bound a central range, and two which bound a wider range. The Central Range is consistent with a continuation of past observed migration trends, while the Wider Range reflects possible futures in which there has been a step change in international migration. The difference between the variants is in the assumptions about future migration behaviour, both internationally and domestically.
- The Central Range spans a projected population of between 10.32 and 10.71 million in 2050.
- The Wider Range spans a population of between 9.55 million and 11.46 million in 2050.
Housing-led projections
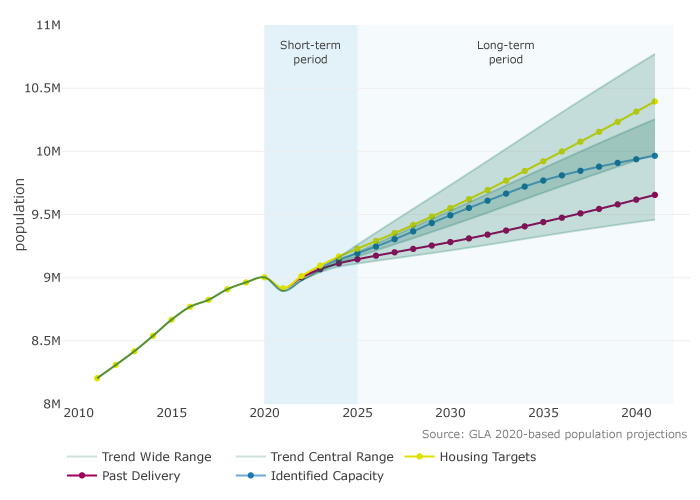
Housing-led projections explicitly incorporate assumptions about future housing capacity. They are recommended for most uses at borough, MSOA (Middle layer Super Output Area) or ward level. The 2020-based housing-led projections include three scenario projections based on different levels of future housing delivery. They are the Identified Capacity scenario which uses a development trajectory adapted from the Strategic Housing Land Availability Assessment (SHLAA); the Past Delivery scenario which assumes average of delivery over the last eight years will continue, and; the Housing Targets scenario in which the London Plan target of 52,287 units is delivered in each year of the projection. In producing the projections no assumption has been made about the likelihood of these delivery scenarios coming forward – the projections are designed to illustrate how the population might change under the conditions described in the scenarios.
Due to limited information about potential development sites in the very long term, the housing-led projections have a projection horizon of 2041 (Figure A1).
- The Identified Capacity scenario projection has a population of 9.965 million in 2041.
- The Past Delivery scenario has a population of 9.655 million in 2041.
- The Housing Targets scenario has a population of 10.395 million in 2041.
Figure A1: Total projected population, London
Expert Panel
In setting the assumptions for the previous round of projections (the 2019-based) the GLA sought the guidance of an expert panel of academics and professional demographers. The panel were consulted on the economic and social drivers of population change in both the short-term and long-term, as well as the specifics of component trajectories. Their input was key in shaping the assumptions which formed the 2019-based variant projections.
The same panel of experts were consulted for the 2020-based projections. The Panel advised on revisions to the migration assumptions and aspects of the modelling approach, such as how quickly trends might take to return to their long-term levels.
Trend projections: Short-term assumptions
The initial short-term period of the projections (up to 2025) accounts for the on-going impacts of the COVID-19 pandemic and Brexit on London’s population. Assumptions about migration patterns during the first two years are consistent across all variants. Over the following two years (2023-2024) migration assumptions diverge as levels of both international and domestic migration transition incrementally towards the long-term values set for each variant. These long-term levels come into effect in 2025.
The impacts on population of these short-term migration assumptions, along with the increase in mortality from COVID-19 are the key drivers of population change in the short-term. The population in the 2020 base year for London is 9.002 million. This falls by 108 thousand over the year to 2021. Then, from a low of 8.895 million the population grows again as migration patterns move towards their long-term levels.
Trend Central range
The two projections bounding the Central Range each use the same assumptions about international migration in the longer-term (based on an average of ten years’ observed data). Net international migration to London over the past 20 years has remained relatively stable within a range of 69,200 and 126,400. The ten-year average (2010-2019) used in the modelling is 95,500 persons. More recent data are excluded from the averaging due to concerns about how ONS have distributed recent estimates of international migration.
The difference in the Upper and Lower bound projections of the Central Range is in the assumptions about future rates of domestic migration. The Upper Bound uses a ten-year average (2011-2020) of past migration patterns. This provides an average based on migration behaviour over an economic cycle and so is perhaps the more conservative variant. The Lower Bound uses a five-year average (2016-2020) which results in greater levels of migration. As the balance of domestic migration at the London level is for greater outflow than inflow, a system in which the volume of migration is increased will lead to greater net out migration from London and consequently lower population growth.
The Central Upper projection projects annualised growth of 60,400 per year over the period to 2050 while the Central Lower projects 47,500. This is in the context of average growth of 94,100 per year in London over the last decade.
Trend Low population variant
The Low Population variant provides an indication of how London’s population might change in response to a sustained reduction in international migration while holding domestic net migration at relatively high levels.
This variant assumes a level of net international migration substantially below that observed over the last 20 years for the duration of the projection. Such a scenario might be consistent with a decline in the attractiveness of the UK as a destination for international migrants and/or a shift to more restrictive migration policies.
Domestic migration rates in the Low Population variant are held at the ten-year average. These domestic migration rates can be considered relatively high in the context of lower levels of international migration. In the long-term, total net migration (the sum of international net and domestic net migration) in this variant ranges between -32 thousand and -36 thousand per year meaning growth in the population is largely the result of natural change rather than migration.
Annualised growth over the 30-year projection period 2021-2050 is 21,700 persons per year in the Low Population variant.
Trend High population variant
The resilience of long-term international migration flows to London across very different social and economic conditions has enabled London’s population to grow consistently over the last two decades at an average of 88,000 persons per year.
This variant assumes a level of net international migration at the highest levels of those observed over the last 20 years for the duration of the projection. Such a scenario is considered necessary to account for the possibility of sustained growth over the projection period in spite of current conditions.
Domestic migration patterns in the High Population variant are based on an average of the last ten years’ rates. As domestic outflows from London have tended to rise in line with international inflows, these rates can be considered as relatively low in the context of the higher international migration flows assumed in this variant.
The High Population variant is the only projection which has positive net migration (the sum of domestic and international flows) for the entire projection period. Total net migration peaks at 41 thousand persons before falling to two thousand at the end of the projection.
The impact on the population trajectory growth is more akin to that seen in recent decades – the High Population variant projects average annual growth of 85,500 persons per year.
Working age population
The size of the working age population (16-64) in London is heavily dependent on the level of migration. High net out migration, as seen in the Low Population variant, leads to a decline in the working age population over time. In the High Population variant, which projects low net out migration, the working age population grows over the period to 2050 (Figure A2).
The Central Range projects growth up to 2040 and then a levelling-off/slight decline in the last decade of the projections.
Figure A2: Projected working age (16-64) population, London
Housing-led projections scenarios
The housing-led projections are produced for London boroughs, wards and MSOAs. The GLA suggests that these projections provide the best estimate of future populations at these geographic resolutions. This is because the additional intelligence on the capacity of smaller areas to accommodate population, in the form of available housing stock, provides a more realistic view of future population. The GLA recommends the housing-led projections for most purposes.
Unlike the trend projections which have a projection horizon of 2050, the housing-led projections work to a projection horizon of 2041. This is because the availability, reliability and utility of housing delivery data diminishes over time.
The 2020-based housing-led projections comprise three scenario projections each of which uses a different housing delivery trajectory. In producing the projections no assumption has been made about the likelihood of these delivery scenarios coming forward – the projections are designed to illustrate how the population might change under the conditions described in the scenarios.
The projection trajectories for the three housing-led scenario projections at London level can be seen in Figure A1 above. All three projections fall within the wider range of the trend projections and the Identified Capacity scenario sits within the central range.
Identified capacity
This scenario adapts the 2017 Strategic Housing Land Availability Assessment (SHLAA)[2] housing capacity study for use as a future delivery scenario. A SHLAA is a technical exercise to determine the quantity and suitability of land potentially available for housing development. In the Identified Capacity scenario, the number of dwellings in London is forecast to increase by 788 thousand over the 21-year period to 2041. This is an increase of 21.6% over current stocks.
Past delivery
This scenario assumes that the average of past levels of development, as reported in the London Development Database (LDD) will come forward each year for the period 2022-2041. In this scenario, the number of dwellings is forecast to increase by a total of 664 thousand units over the 21-year period to 2041. This is an increase of 18.2% over current stocks.
Housing targets
This scenario assumes that the 10-year London Plan target of 52,287 dwellings per year will be delivered in each year of the projection period up to 2041. In the initial years of the projection, the level of delivery is assumed to be the same as in the Identified Capacity scenario: 41,700 in 2020 and 43,000 in 2021. The underlying assumption being that this recently developed intelligence, undertaken in 2021 during the pandemic, provides the most reasonable estimate of short-term delivery.
In the Housing Targets scenario, the number of dwellings is forecast to increase by 1.089 million units over the 21-year period to 2041. This is an increase of 29.8% over current stocks.
Monitoring population change
In addition to the 2020-based projections the Demography Team have an ongoing programme of work to monitor, analyse and understand developing trends and changes in London’s population. The report Population Change in London During the Pandemic[3] provides an overview of the latest direct and indirect evidence of changes in London’s population and forms a key part of the evidence base which underpins the assumptions in the 2020-based projections. The report was published in May 2021 and scheduled for update this Autumn.
Full detailed outputs and additional analysis of the 2020-based population and household projections can be found on the demography pages of the London Datastore[4]. The housing-led projections can also be accessed through the updated GLA Population Explorer Tool[5].
[1] https://data.london.gov.uk/demography/population-and-household-projections/
[2] https://www.london.gov.uk/what-we-do/planning/london-plan/new-london-plan/strategic-housing-land-availability-assessment
[3] https://data.london.gov.uk/dataset/population-change-in-london-during-the-pandemic
[4] https://data.london.gov.uk/demography/population-and-household-projections/