
English Indices of Deprivation 2015
Deprivation in London is widespread, but not as dense as it was. Today, the Department for Communities and Local Government released the new English Indices of Deprivation. They are produced on a comparable basis for small areas throughout England. The map below shows how the new Index of Multiple Deprivation (IMD) ranks the areas within London – the darker shades are the most deprived.
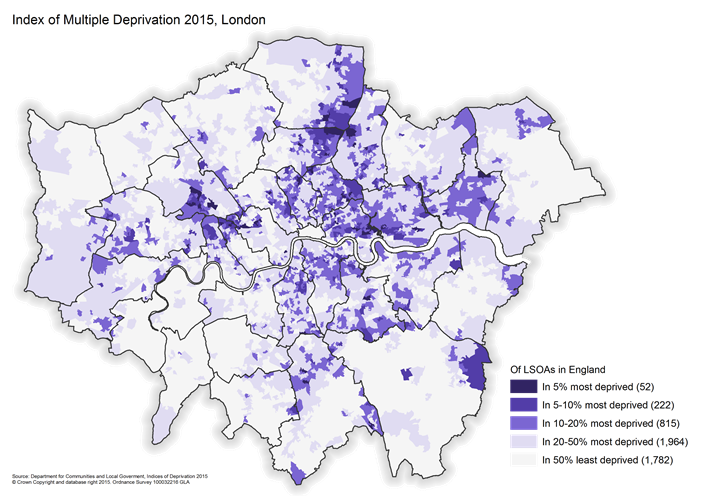
Deprivation is measured across seven different areas or domains – income, employment, health, education, living environment, crime and barriers to services using a wide range of indicators, and the methods used show how each area compares with other areas across England using a combination of all these indicators. None of the very worst areas (the most deprived one per cent of nearly 33,000 areas in England) are within London, and only three in the next percentile – one in each of Hackney, Islington and Westminster. Falling within the most deprived five per cent of areas are also parts of Haringey, Tower Hamlets, Croydon, Brent, Newham, Kensington & Chelsea, Barking & Dagenham, Enfield, Croydon, Lewisham, Waltham Forest, Lambeth and Ealing. The City and Richmond are the only local authority areas within London with no areas in the most deprived 20 per cent of England.
Summary measures for local authorities look at different aspects, such as how the borough does on average, the extent to which people are most affected by deprivation, how bad is the deprivation in the worst parts. This chart shows on each of the five measures how the London boroughs fare out of the 326 local authority areas in England. Because each of these measures is important, there is no borough that stands out as being “the most deprived”. Barking & Dagenham, Hackney and Tower Hamlets are each ranked in the 20 most deprived local authorities on three of five measures. Islington, Newham and Waltham Forest also rank in the top twenty on one of the five measures.
Borough level summary measures of the Index of Multiple Deprivation 2015
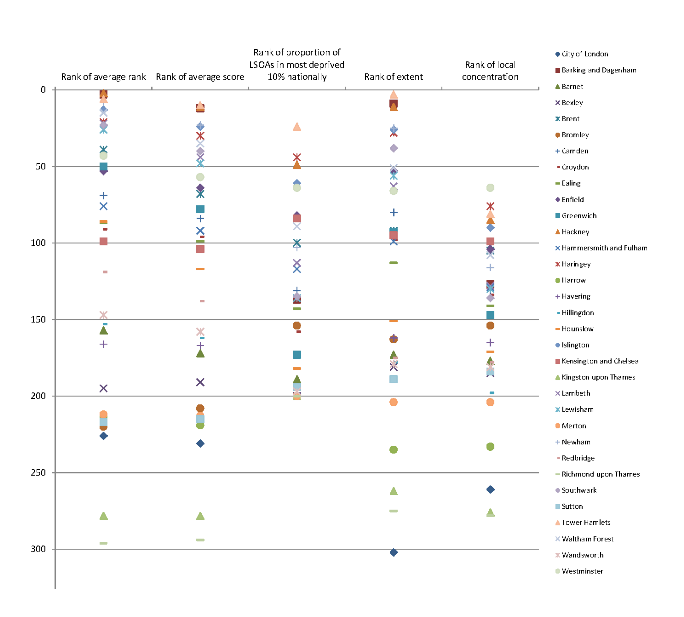
Source: Indices of Deprivation 2015, DCLG
Note: A rank of 200 on the proportion of LSOAs in the most deprived ten per cent nationally means there are no LSOAs in the highest ten per cent
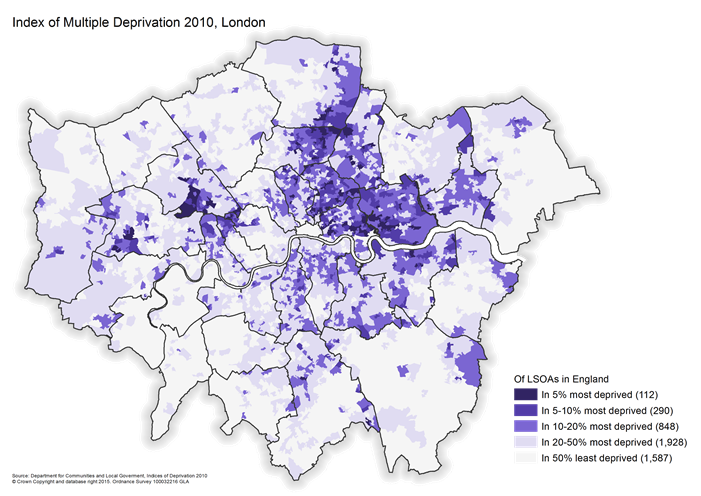
Comparing over time is difficult as changes to indicators and the areas used mean that strict comparability is not possible, but broadly speaking Newham appears far less deprived than it did under the previous IMD2010 – this is at least partly due to an improved population estimate, where a previous under-estimate in the number of residents probably overstated the degree of deprivation. Conversely, an over-count of Westminster’s population previously tended to understate its deprivation levels. The map below shows the previous IMD for London, and it is clear that the general pattern of deprivation is similar with a broad crescent from Enfield down through Haringey, Islington and Hackney to Tower Hamlets, Newham and Barking & Dagenham still apparent, though slightly less marked than previously. This is almost mirrored south of the river from Greenwich to Lambeth and down into Croydon, though a little more patchy and other notable pockets of deprivation remain evident, such as around Stonebridge/Harlesden through to Paddington and in the River Brent area.
The supplementary indices, measuring the extent of income deprivation among children and among older people show that Tower Hamlets has the highest levels of children living in income deprivation in England. The proportion is lower than five years earlier, despite the fact that this measure relates to data from around the end of the recession, whereas the previous version relied on data from the start of the recession. Islington, Barking & Dagenham, Hackney, Newham, Lambeth, Southwark and Lewisham are also among the top ten local authorities on this measure. Nottingham and Manchester, ranked 4th and 5th are the only areas outside London included on the list. Tower Hamlets is also highest for income deprivation among older people, followed by Hackney, Newham and Islington. Lambeth, Southwark and Haringey are also in the top ten (as are Manchester-5th, Knowsley-8th and Liverpool-10th).
Data available on the London Datastore.