Labour market update for London – December 2017
Employment rate down slightly on quarter, and continued if slight growth in jobs
London’s employment rate (i.e. the proportion of London’s residents aged 16-64 population in employment) in the three months to October 2017 was 74.5 per cent. The rate was down 0.4 percentage points on the quarter, but up 0.9 percentage points on the year. The UK’s employment rate also fell slightly on the quarter (by 0.2 percentage points) and was also up on the year (by 0.7 percentage points). These quarterly changes are fairly small, and within the margin of error.
In the three months to October 2017 London’s ILO unemployment rate was down slightly on the quarter (by 0.3 percentage points) to 4.9 per cent, remaining slightly higher than the UK unemployment rate of 4.3 per cent. The economic inactivity rate in London increased by 0.6 percentage points on the quarter, but was down 0.4 percentage points on the year.
This month saw an update to the quarterly workforce jobs data, with data published for the three months to September 2017. Jobs in London (whether or not taken by Londoners) increased by 0.1 per cent on the previous quarter, and 1.1 per cent on the year (amounting to an additional 61,000 jobs). However, London’s jobs growth was lower in percentage terms than in the UK overall, where jobs grew 0.5 per cent on the quarter and 1.7 per cent on the year.
Looking across industries, in London, jobs growth on the year was highest in Administration and Support Services (+54,000 jobs), Construction (+34,000 jobs) and Health and social work (+19,000 jobs). Education (-24,000 jobs), Arts, entertainment and recreation (-22,000 jobs), and Finance and insurance (-20,000) all saw a decline in jobs on the year. The UK saw the largest annual jobs growth in the same three sectors as London, and the largest absolute fall in jobs was also in Education.
The rest of this update contains tables and charts.
- table with the employment and workforce jobs data for London and the UK.
- charts of monthly employment and unemployment in London and the UK.
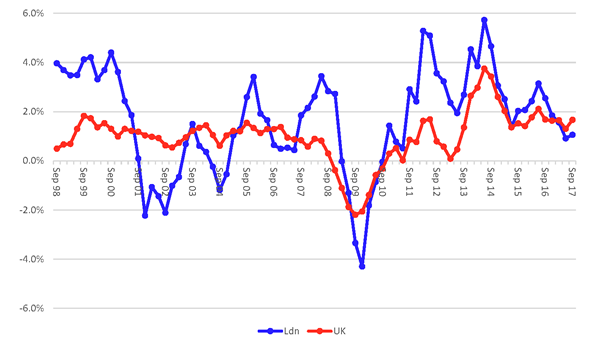
- charts showing workforce jobs data: growth by industry in London on the year, and annual jobs growth in London and the UK from 1997.
Employment and jobs data

*All figures are seasonally adjusted. Rates are based on working age (16 – 64 male and female), with the exception of unemployment rate which is age 16 and above.Note: we are no longer including a table with the claimant count (the number of people claiming unemployment benefits). The roll out of Universal Credit has caused problems with this statistic because of differences in definition and administrative processes between Jobseekers’ Allowance and Universal Credit. The ONS no longer publishes the claimant count as an official statistic. In September 2017 we provided a briefing
Employment rate and unemployment rate charts


Change in workforce jobs in London on year by industry (Sep 2016 to Sep 2017)

Yearly growth in workforce jobs, UK and London, 1997 to 2017