Labour market update for London – March 2018
London’s labour market remains strong – with it improving on the year earlier
Summary
The ONS have released labour market data for London for the three-month period November 2017 to January 2018. In London, compared to the previous quarter, there were slight increases in the employment and unemployment rates, and a slight decrease inactivity rate. However, note that all changes are within the statistical margin of error. For the UK as a whole, compared to the previous quarter, the employment rate and economic inactivity rate improved slightly and the unemployment rate was unchanged.
The workforce jobs series was also updated this month with data for the fourth quarter of 2017. Jobs in London grew 1.7 per cent on the fourth quarter of the previous year, compared to 1.2 per cent in the UK as a whole. Jobs growth in London over the past year was highest in Health and social work, Construction, and Administration and support services.
Detail
- London’s employment rate (i.e. the proportion of London’s residents aged 16-64 population in employment) in the three months to January 2018 was 74.7 per cent, up 0.2 percentage points on the quarter, and up 1.3 percentage points on the year. The UK’s employment rate was 75.3 per cent (higher than London’s) up on the quarter (by 0.3 percentage points) and year (by 0.8 percentage points).
- In the three months to January 2018 London’s ILO unemployment rate was 5.0 per cent, up 0.1 percentage points on the quarter but down on the year (by 0.7 percentage points). The UK unemployment rate was 4.3 per cent (lower than London’s), unchanged on the quarter but down on the year (by 0.4 percentage points).
- In the three months to January 2018 the rate of economic inactivity in London (the proportion of 16 to 64 year olds not in work and not looking for or not able to work) was 21.3 per cent, almost the same as the 21.2 per cent in the UK. Economic inactivity in both London and the UK was down on the quarter and year.
Workforce jobs were updated this month, please see a chart on the following page for a breakdown by industry. In the fourth quarter of 2017, there were 5,863,000 jobs in London, up by 35,000 on the previous quarter and up by 98,000 on the previous year. In percentage terms, London jobs grew by 1.7 per cent on the year, compared to 1.2 per cent in the UK as a whole. London’s growth rate was similar to the average growth rate over the last two decades, of 1.8 per cent (the series started in 1996).
In terms of sectors, London’s jobs growth on the year was highest in Health and social work (+39,000), Construction (+30,000), and Administration and support services (+25,000). There was a decline in jobs, on the year, in Education (-22,000), Finance and insurance (-13,000) and Arts, entertainment and recreation (-10,000). See the charts on the last page for more information.
Note on interpreting labour market data: the statistics presented here are estimates based on a survey (the Labour Force Survey), and as such have a margin of error. Changes in the headline indicators for London, both on the quarter and the year, are within this margin of error. This means they are not statistically significant and may not reflect real changes. Furthermore, the current gap between London and the UK in employment and unemployment rates are also not statistically significant. However, London has had higher unemployment and lower employment than the UK for many years, so we can be confident that these differences are real.
Employment and jobs data

*All figures are seasonally adjusted. Rates are based on working age (16 – 64 male and female), with the exception of unemployment rate which is age 16 and above. Note: we are no longer including a table with the claimant count (the number of people claiming unemployment benefits). The roll out of Universal Credit has caused problems with this statistic because of differences in definition and administrative processes between Jobseekers’ Allowance and Universal Credit. The ONS no longer publishes the claimant count as an official statistic. In September 2017 we provided a briefing
Employment rate and unemployment rate charts


Workforce jobs: annual growth in London, 1997 to 2017

Source: ONS workforce jobs
Workforce jobs: growth by industry in London, annual final quarter growth for the last two years
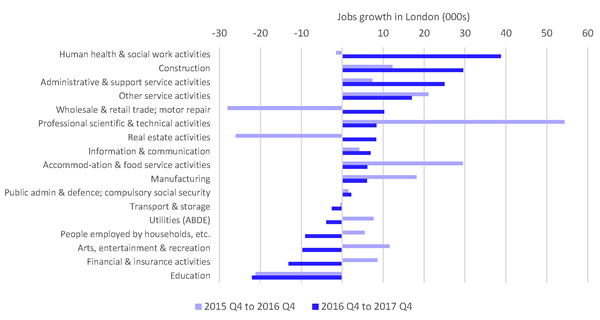
Source: ONS workfoce jobs