
The rising cost of living and its effects on Londoners
Executive summary
Key points for London:
- Inflation is running at a 30-year high of 5.4% year-on-year, driven by supply chain challenges and rising global fuel prices. Price growth in London is likely higher than the rest of the UK, with the National Institute of Economic and Social Research (NIESR) estimating an underlying inflation gap of 1 percentage point.
- Over 15% of London households were in fuel poverty in 2019 and with gas prices a key part of high inflation, the £140 increase in the standard tariff in October 2021 put a further estimated 75,000 households into fuel poverty. The figure could rise further with a £600 or more increase on the way in April this year.
- Londoners’ incomes have also taken a disproportionate hit from the pandemic, with the capital’s employment hit harder and recovering slower than other regions. At 5.4%, London’s unemployment rate is the second highest of any UK region.
- Polling by YouGov on behalf of the GLA shows 79% of Londoners reported an increase in their cost of living over the last six months. Londoners were most likely to report larger increases in their food and energy bills.
Background on incomes and living standards:
- The cost of living was already a challenge for Londoners before the pandemic. Adjusting for national inflation, median weekly pay for employee jobs in London was 5.9% below 2010 levels in 2019, while for the rest of the UK that gap was just 0.9%.
- Meanwhile, prices tend to be around 7% higher in London than the UK average.
- Recent tax and benefit changes are set to worsen conditions, with an estimated 130,000 more Londoners in poverty after the end of the Universal Credit uplift.
Background on inflation:
- Imbalances in global demand and supply have pushed up goods prices and energy costs, propelling inflation to multi-decade highs. Wage growth has fallen below inflation, and while this will help contain inflation, it further tightens households’ finances.
- Market signals point to an imminent peak in energy and supply chain costs. However, prices remain high and UK inflation will only peak in spring when the Ofgem cap rises.
- With limited evidence of a wage pass-through and mixed evidence on long-term inflation expectations, price growth should ease after the spring, but may take over a year to fall below 3% despite the Bank of England tightening monetary policy.
Key points for London
- Inflation is at a multi-decade high across the UK and it may be even higher in London. National Institute of Economic and Social Research (NIESR) estimates suggest underlying inflation in the capital may be 1 percentage point faster than the UK average.
- With gas bills a key part of rising prices, last October’s £140 Ofgem standard tariff rise was associated with an estimated 75,000 London households falling into fuel poverty. The number may rise further with a £600+ increase in the standard tariff expected in April.
- The pandemic disproportionately hit the capital’s labour market harder compared to the wider UK, which means Londoners may be less equipped to deal with rising costs.
- 13% of Londoners reported in January that they were struggling to make ends meet and 79% of Londoners reported their cost of living had increased over the last six months. For Londoners, food and energy bills have seen the largest increases.
- Ipsos MORI polling shows the cost of living is the top issue facing Londoners, ahead of crime and policing, housing affordability and the pandemic.
UK Consumer Price Index inflation has been accelerating sharply since summer 2021. December’s inflation reached 5.4% year-on-year[1], the fastest price growth since March 1992. The increase in prices was broad-based, but the largest contributions came from vehicle fuels (0.7ppts), second hand cars (0.5ppts), electricity (0.4ppts) and gas (0.3ppts); this reflects the influence of supply chain challenges and rising global energy costs (see below section on inflation outlook for details).
Beyond the national consequences of a rising cost of living, standard data are less clear on how current price rises will affect London compared to the wider UK. By far Londoners’ largest spend is rents[2], which are currently growing at a moderate 2% year-on-year. In terms of the sharpest current price pressures, Londoners ordinarily devote a similar share of outlays to energy bills as an average UK household and spend less on owning and operating vehicles. Yet by some measures, London still faces a worse inflationary outlook. NIESR’s estimate of trimmed-mean inflation[3], which seeks to cut out the most volatile prices using a regionally collected dataset, was running at 5% year-on-year for London, compared to 4% for the UK overall. This placed London as the UK region facing the highest inflation – which has been the case in NIESR’s figures since April 2021. London inflation has at times run as much as 2.5 percentage points faster than the UK average. Historically, 2016 data showed price levels in London, even excluding housing costs, were 7% higher than UK averages[4].
Focusing on the distributional impacts of one particular issue, the poorest Londoners are set to take a heavy hit from rising energy bills. Despite being the region with the highest average disposable income per head, London had the third highest share of its households in fuel poverty at 15.2% in 2019,[5] with England overall having 13.4% of households in fuel poverty (Chart 1). With the £140 increase in the Ofgem standard tariff in October associated with an estimated 75,000 more London households falling into fuel poverty, another £600 or more on standard bills[6] could see fuel poverty affect an ever higher share of London households. Londoners facing a squeeze on their finances may also be more at risk of experiencing cold homes as the capital has the third highest regional share of energy consumers on pre-payment meters at 18% in mid-2021[7]. This method of paying for bills involves households charging their account with money for gas in advance, with the supply cutting off once the household uses the amount paid for. This kind of energy rationing could result in more cold homes, which is associated with excess winter deaths[8].
Chart 1:
We also know that the rising cost of living comes at a time when London’s labour market remains vulnerable, having been relatively harder hit by the coronavirus pandemic and the measures to contain it than the rest of the UK. For example:
- The total number of payrolled employees living in London was only 0.2% higher in November 2021 than in February 2020 – the slowest jobs recovery of any UK region or country (employee numbers were up 1.4% in the UK overall)[9].
- The unemployment rate among Londoners was estimated at 5.4% in the three months to November 2021 – still up by 0.9 percentage points on its pre-pandemic level and higher than in most other UK regions.
- As outlined by the Institute for Fiscal Studies, Londoners also “suffered from higher rates of redundancy, lower rates of re-employment after redundancy and lower growth in vacancies”[10] during the pandemic.
Although an economic recovery has been underway in recent months, at least prior to the emergence of the Omicron variant, the job recovery in the capital has generally trailed the rest of the UK and has been uneven in terms of sectors and groups. Young Londoners and Londoners with lower qualifications are among those to have recorded the largest decline in employment rates; while the steepest increase in the claimant unemployment rate has been in the capital’s most deprived neighbourhoods[11].
Alongside standard economic data, we can also hone in on Londoners’ experiences of the cost of living with polling figures [12]. As of late January, 13% of Londoners reported that they were struggling to make ends meet or were having to go without basic needs and/or rely on debt. This is roughly unchanged when compared to polling from June and mid-October 2021 looking at how the pandemic had impacted finances. Among Londoners with gross household incomes of less than £20,000, the share more than doubles to 27%. There are notable differences between groups of Londoners, besides income, with renters and those with health problems or disabilities which limit day to day activities also more likely to be struggling financially.
The polling also showed that 79% of Londoners say their cost of living has increased to some extent over the last six months, with three in ten (29%) saying that it has increased a lot for their household. Living costs have increased for at least half of Londoners in almost all areas. Most Londoners have seen increases in energy bills (72% seeing an increase) and household essentials shopping (73% seeing an increase) over the last six months. 61% of Londoners say their other household bills have risen and 49% say their day to day transport costs have increased over the last six months.
In response to rising living costs 45% of Londoners are spending less on non-essential items, a third (32%) have stopped spending on non-essential items altogether and 36% are buying cheaper products. While the majority of Londoners have been able to meet their food and essential shopping needs, 9% have had to buy less than they needed, go without, or rely on support from others. 12% of Londoners are using more credit or going into debt. Almost four in ten (36%) Londoners[13] have struggled to make payments on their rent or mortgage at some point in the last six months and 7% have fallen behind on some or all payments. A similar proportion (34%) have struggled to pay their household bills, with 7% saying they have fallen behind on some or all payments. 10% of Londoners have fallen behind on meeting credit commitments in the last six months[14]. 72% of Londoners are worried about future increases to living costs in the next 12 months, comprised of 32% who are very worried and 40% who are fairly worried.
Additionally, polling from Ipsos MORI shows that cost of living is the top issue facing Londoners – 62% of Londoners think the cost of living is one of the main issues facing London, ahead of crime and policing (54%), housing affordability (53%) and the COVID-19 pandemic (51%). Private renters and those travelling into work all of the time are among those most likely to think the cost of living is a key issue[15].
Talk London is also tracking Londoners’ experiences of the cost of
living, with two recent quotes standing out:
“A £2.66 per month increase council tax may not be a big amount to many people if your earnings is [sic] enough for all these increases. It will not affect high earners. We have energy bills increasing and the tax which has to be paid in April, that is without cost of living such as food and the water rate will increase, and the yearly rent increase and probably other increases. I really don’t know how we are expected to find the money for this […] we are struggling like many other people.” [Talk London member]
“Since the start of the pandemic our landlord has not increased the rent, however this month we were emailed to say that the rent will be increasing by £300, well above what other similar rental properties in the area are advertised at […] All of our bills have increased recently and although I have had a pay rise with inflation this will be consumed by the bills.” [Talk London member]
Background on incomes and living standards
- The median Londoner saw slow income growth in the decade before the pandemic, and the region has consistently been more unequal than the wider UK. Accounting for housing costs, 27% of Londoners are in relative poverty.
- Adjusting for national inflation, median weekly pay for employee jobs in London was 5.9% below 2010 levels in 2019, compared to only 0.9% below for the rest of the UK.
- Tax and benefit changes have tended to worsen income disparities in London over the last decade or more; and an estimated 130,000 more Londoners were pushed into poverty after the end of the Universal Credit uplift.
Median equivalised[16] disposable income, net of all taxes and housing costs, increased in real terms from the end of the last recession up until the pandemic, both in London and the wider UK. Median weekly income in London is close to the UK overall figure - typically around £10 more than in the rest of the UK (Chart 2) (a little over 2% difference).
Chart 2:
However, focusing on earnings, in the decade before the pandemic, London saw jobs growth but also an acute pay squeeze after the financial crisis. Despite stronger earnings growth for the bottom 10% of jobs, there was an increase in jobs paid below the London Living Wage and persistent inequalities in employee pay levels. Because the rise in the London Living Wage was faster than either average pay or national measures of inflation, caution is needed interpreting an increase in the number of jobs paid below this level.
In real terms, average weekly pay in London in 2019 was still below 2010 levels. Adjusting for inflation, median weekly pay for employee jobs was 5.9% below 2010 levels in 2019, compared to only 0.9% below UK-wide. Price increases outpaced pay growth in 2010-2014, especially in London (Chart 3). Large pay differentials also exist within London for residents from different backgrounds and living in different parts of the city. Median gross weekly pay in 2019 ranged from £471 in Barking & Dagenham to £768 in Kensington & Chelsea.
Chart 3:
The median income is useful for comparison of change in typical incomes over time, but to understand the incomes of the population more widely, it is necessary to look at the distribution of incomes. Inequality in equivalised disposable income after housing costs has consistently been much greater in London than the rest of the UK. While the incomes of Londoners at the top tenth of the income distribution are much higher (30% more) than the top tenth of incomes in the rest of the UK, the incomes of Londoners at the lowest tenth of the distribution are 30% less than those at the lowest tenth in the rest of the UK[17].
The cost of housing in London is a big factor in creating that difference. After housing costs, the 90th percentile of the income distribution in London (income of £1,246 per week for a couple) is over ten times that for the 10th percentile (£118 per week for a couple) (Chart 4). Before housing costs, the difference is still large, but less stark at 5.8 times as much at the 90th percentile compared with the tenth percentile (£1393 compared with £247). In the rest of the UK, this ratio before housing costs is 4 times (£1008 compared with £252).
Chart 4: Income inequality in 2017/18-2019/20
Difference in weekly income (after housing costs) between top 10% and bottom 10%
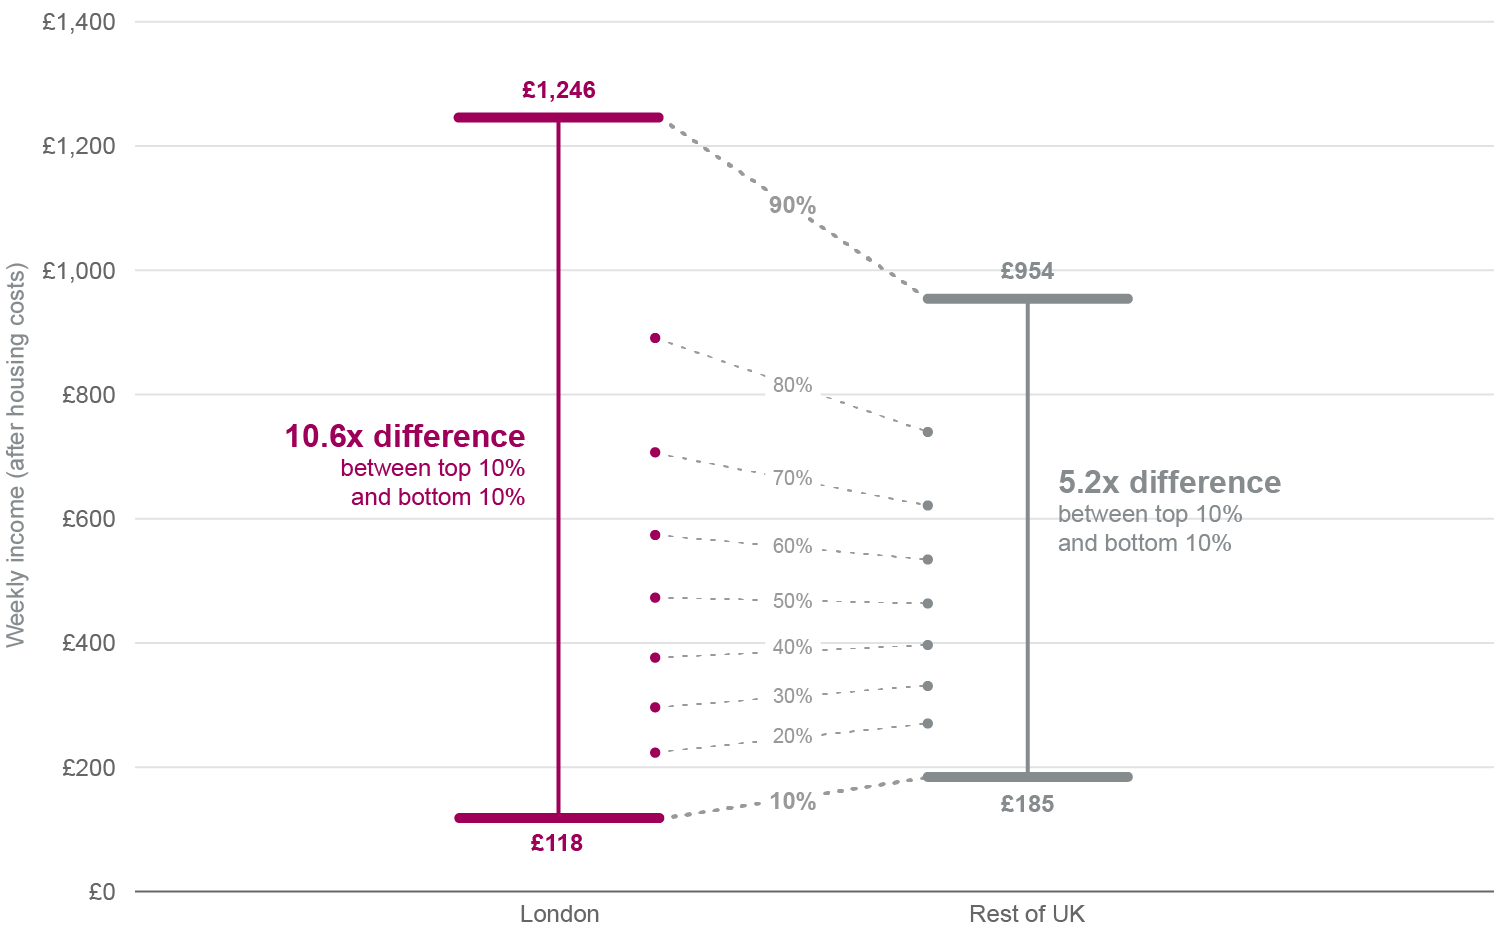
Source: HBAI microdata, DWP
Despite Londoners on average having higher incomes, even after paying for their housing, than people in the rest of the UK, the proportion of Londoners in poverty has always been higher than the UK average. Before taking account of housing costs, the proportion of Londoners in relative poverty has been at or just below the national level since the measure began in 1994/5. The latest data stands at 16% for London compared with 17% for the UK. The difference in poverty levels after taking account of housing costs is much greater (27% of Londoners in poverty compared with 22% for the UK), showing housing costs in London are a significant additional cost of living for Londoners.
Outside earnings, non-labour factors have also contributed to the increased income gap between richest and poorest. From 2010 up to 2019, the combination of tax and benefit changes meant that the poorest 50% of households in London saw decreases in income, while many of those with the higher incomes saw increases in their income as a result of all the changes[18].
More recently, tax and benefit modelling during the pandemic showed that the £20 uplift to Universal Credit (UC) and Working Tax Credit and the Coronavirus Job Retention Scheme helped considerably in keeping many people out of poverty. The end to the UC uplift was expected to mean 130,000 Londoners fell into poverty, particularly those in some of the already disadvantaged groups. Across the country, the modelling found that the poorest tenth of the population would lose 5% of their income[19].
Chart 5:
The IFS[20] has commented recently on the cost of living and its implications for future benefits policy. It looked, in particular, at changes that will take effect from April this year:
- Welfare benefits will only rise by the rate of general (CPI) inflation in the year to September 2021, which was 3.1% (lower than the current rate of inflation of 5.4%).
- The energy price cap will be increased, with the Bank of England predicting that the year-on-year energy inflation rate will be 31% for electricity and 58% for gas.
Not all households spend their money on the same things. Particularly troubling is the fact that the poorest households devote a higher share of their spending to gas bills. While the average UK household sees around 1.8% of their monthly outgoings devoted to gas in normal times, and the top 10% of households only 1.2%, households in the bottom two deciles of the income scale devote 3.1% of their outlays to gas[21]. Once electricity and other fuels are included, the poorest fifth of households devote over 7% of their spending to utilities in normal times, while for the top 10% of households that share is just 2.7%. Lower income households (being more likely to claim benefits) therefore face a double effect from benefit income not rising in line with inflation and energy costs surging.
While the ONS estimate that low- and high-income households across the UK currently face similar inflation rates[22], this analysis is based on pre-pandemic spending weights. If high-income households are spending less on transport and restaurants – as seems likely during the pandemic – then the gap between inflation facing high-income and low-income households may be larger. What is more, on a forward-looking basis, given energy costs are likely to be the largest contributor to inflation in the next few months, the cost of living squeeze may yet be felt most acutely at the bottom of the income scale. The forthcoming release of ONS Household Costs Indices in May should offer better and more up-to-date information on the cost pressures facing different kinds of households.
Projections for income in the coming years offer little comfort. At the autumn 2021 budget in October, the OBR projected UK real income growth of just 0.3% in 2022 – but this was premised on an inflation peak at around 4.4%. In an alternate scenario of cost-push inflation peaking another 1 percentage point higher, (still likely to underestimate peak inflation rates this spring), the OBR expected a cut to wage growth of around 0.7 percentage points. Extrapolating from these figures, an inflation peak of around 6% could be consistent with real incomes contracting by around 0.7% in 2022 – worse than the drop seen during 2020.
Background on inflation
- Several key factors are driving prices higher, and while price growth should ease after the spring, inflation may take over a year to fall below 3%.
- Unusually strong demand for goods has collided with disrupted production and distribution networks, causing supply chain challenges. These should ease as patterns of demand normalise and COVID-19 outbreaks become less disruptive.
- Rising global energy costs have also been a key driver of inflation. Gas prices are the main issue for UK households, soaring to more than double their pre-pandemic levels. Market signals suggest commodity prices should ease, but gradually.
- Evidence on whether inflation will pass on to wages is mixed. Short-term inflation expectations are up, and wage growth has been high; but long-term expectations appear to be rising less, and wage growth has fallen below inflation.
- Compared to wider macroeconomic factors, the impact on inflation of GLA actions including raising the council tax precept and higher TfL fares is likely to be modest.
- The Bank of England has begun to hike rates and may raise them to a post-2008 high this year. While lower wage growth and higher interest rates will help tame inflation, weaker incomes and activity will make high prices now less affordable.
There are good reasons to expect current high inflation to dissipate over time. However, price increases are still likely to run above 3% year-on-year to at least the end of this year. The Bank of England’s November 2021 projections anticipated inflation ending 2022 at 3.4% year-on-year[23] and communications in December indicated that they have revised up their expectations of the April inflation peak by around 1 percentage point[24]. As a result, February’s Bank forecasts are likely to project inflation above 3% well into 2023.
The first key driver behind faster inflation is the global supply chain challenges that have created bottlenecks and shortages in key goods markets. An example of how this affects UK costs comes in the used car market, where prices are up 28.6% in the CPI measure, contributing a record 0.46 percentage points to overall inflation. A semiconductor shortage has slowed the production of new cars, causing the second-hand market to heat.
The supply chain crunch is explained by the collision of three trends: recovering global demand, COVID-19 restraining consumers’ appetite to buy services and production and distribution networks still recovering from the pandemic. The first two points meant that demand for goods accelerated rapidly, with World Trade Organization (WTO) estimates of global goods trade volumes already over 3% above pre-pandemic levels in Q3 2021[25]. Demand then hit still-recovering supply networks, as well as delays due to COVID-19 outbreaks at major ports. As a result, survey gauges of backlogs have lengthened sharply, with the London PMI outstanding business index reaching seven-year highs in mid-2021[26]. Shipping costs have also soared, with Baltic dry freight prices quadrupling between December 2020 and October 2021[27].
Key barometers, however, suggest that supply chain difficulties may have peaked. The same London PMI outstanding business index fell in December for the first time in three months, pulling back to 57.5 – close to pre-pandemic levels. UK and global manufacturing PMI figures pointed to less growth in supplier delivery delays and a deceleration in input prices in December – though both indices still show disruption near all-time records[28]. At the global level, the PMI gauge of manufacturer output prices decelerated at the end of last year[29]. After peaking in October 2021, the index for Baltic dry freight prices has been declining and is now near levels seen in early 2021 and late 2020. Distribution networks should continue to recover as COVID-19 becomes less disruptive due to vaccine rollouts, antiviral treatments and the lower severity of the Omicron variant. Summarising all these factors, The Fed’s index of Global Supply Chain Pressures looked to have passed its peak in late 2021[30].
Alongside supply chain challenges, fuel prices, and energy costs more broadly, are another key driver of inflation. Global fuel costs have increased rapidly during the recovery from the pandemic, with crude oil sustaining market prices last seen in 2014 and natural gas prices soaring from $2.5 per therm in January 2021 to averaging nearly $6 per therm by October. This has directly raised heating and electricity costs for homes, with 65% of UK households’ energy coming from gas[31], but it also increases costs across the economy, prompting producers to hike prices. The household energy component of CPI grew 22.7% in December (Chart 6), having surged sharply after the October rise in the Ofgem standard tariff.
Chart 6:
Yet as with supply chains, cost pressures in the energy sector may be easing past their peak. Global natural gas prices have eased more than 25% since October, though market signals suggest further falls may be gradual. Futures contracts suggest that it could take more than a year for gas prices to push decisively below current levels[32]. Market signals similarly point to crude oil prices steadying around current levels – the highest in seven years – before easing slowly to end 2022 around 25% higher ($15/barrel) than pre-pandemic levels[33]. While consumer petrol prices may vary in how much of this increase passes through to the forecourt, higher global oil prices will nevertheless raise costs across the economy.
As a result, while these signals suggest global energy prices may not rise further, current levels are still high enough to create price pressures for some time. Gas prices will present a sharp challenge for UK households, with the impact of higher gas bills to become even more acute when the Ofgem standard tariff is raised in April. Estimates from Cornwall Insights point to a further £600 or more added to an average household annual energy bill at that point. With a likely shallow path for further wholesale price declines and provider bills including the costs of supporting customers from collapsed suppliers, barring policy intervention, household gas bills may not ease substantially for some time. Given the weight energy has in the CPI basket, a 45% rise in April may add 1.5 percentage points to inflation[34].
Pressures from the supply side are also no longer contained to specific sectors. ONS producer price figures have grown even faster than consumer prices and production input prices rose 13.5% year-on-year in December[35]. Even excluding fuel prices, a rough calculation suggests producer input prices are up around 10% year-on-year. Producers have at least partly passed on these costs, with output prices up 9.3%, or 7.2% excluding fuels.
Taking these points together, while there is evidence to suggest that the supply-side pressures that have so far been most responsible for higher inflation have peaked, there is less evidence to suggest that those pressures are going to go into a rapid reverse. Easing pressures from production costs should help slow the pace of headline inflation, but price rises have spread into all areas of the economy – including the service sector (Chart 7). As a result, it will take time before price pressures work their way out of the economy.
Chart 7:
While supply factors are mostly responsible for the current rise in inflation, a key concern is whether the current rapid pace of price increases could become ‘baked in’ to long-term inflation. One mechanism for this would be a re-rating of inflation expectations, leading to increased wage demands (or increased search for higher-paying jobs). Figures do point to an increasingly tight job market, with one in eight employers surveyed by the ONS reporting hiring difficulties and resignations and vacancies both at record highs. YouGov polling[36] found 16% of Londoners trying to manage higher living costs are doing so by looking for a better-paid job – though only 4% are seeking to negotiate a higher current wage.
However, this has so far not translated into meaningfully higher wage growth. If we take the change in inflation-adjusted regular earnings between November 2021 and November 2019 and adjust it to be comparable with annual growth rates, the resulting change is around 1.3% per year, slower than annual growth rates in late 2019. If we do the same to figures that are not adjusted for inflation, the figure is around 3.8%. This is above nominal wage growth of 3.2% in November 2019, but by much less than the surge in inflation[37].
What is more, while short-term inflation expectations rose 0.5ppts across 2021, the year-ahead expectation of 3.2% inflation is only modestly above 2019 levels and five-year ahead expectations, at 3.1%, are below pre-pandemic averages[38]. Other gauges of long-term inflation expectations from Citi and YouGov have been trending up more clearly since 2020[39], but on the labour market side, while the Bank of England Agents’ survey found hiring difficulties have risen, it also pointed to labour cost pressures peaking[40]. On the one hand, while contained wage growth should prevent households facing rapid price increases on a permanent basis, it will mean that incomes struggle to keep pace with inflation.
While there may be some concerns around GLA activities raising costs, these are likely to have a modest impact on inflation. While the distributional impact of higher council tax warrants further investigation, the increase from the GLA precept is likely to total less than 0.1% of an average Londoner’s spending[41]. Costs from the expanded Ultra-Low Emissions Zone are also likely to be minimal, with higher-than-expected compliance figures of 90%[42] suggesting relatively few vehicle owners are paying the charge. As Londoners spend less on vehicles and more on public transport than the UK average, the most significant GLA-generated cost pressure would likely be TfL fares. Were fares to rise by 5%, the weight of public transport in Londoners’ spending (5%) implies inflation for Londoners would increase by 0.2-0.3 percentage points. While this is an unwelcome additional cost, on average it may be offset by lower petrol costs an average Londoner faces by using personal vehicles less[43].
A tightening labour market, soaring energy bills and GDP close to pre-pandemic levels mean that the Bank of England has begun to wind down its ultra-accommodative monetary policy to combat inflation. Interest rates have spent nearly two years at rock-bottom levels of 0.1%, but after finishing a £450 billion program of quantitative easing, the Bank finally hiked interest rates to 0.25% in December 2021. Markets expect the Bank rate to reach over 1% by the end of 2022[44], which would be the highest since 2009. Yet rate hikes will take time to have an effect – as much as 18 months – and even as they help slow inflation, they do so by curbing economic activity, hitting the recovery in output and jobs.
One source of longer-term uncertainty around inflation could come from the impacts of leaving the EU. Any increase in trading frictions between the UK and its biggest trading partners is likely to raise costs for imported production inputs and final goods. However, the cost challenge is unlikely to be on the same scale as current pressures.
[1] Consumer price index data, ONS (2022)
[2] Based on the Living Costs and Food Survey, Workbook 3, ONS (2021)
[6] GLA obtained this figure from a subscription service, but coverage of this source can be found from the Bloomberg website or the money saving expert website
[9] Based on the Labour Market Release, ONS (2022)
[11] GLA Economics analysis of ONS Labour Force Survey and ONS Claimant
Count (via Nomis)
[12] YouGov on behalf of GLA. All figures, unless otherwise stated, are from YouGov Plc. Total sample size was 1188 adults. Fieldwork was undertaken between 21st - 26th January 2022. The survey was carried out online. The figures have been weighted and are representative of all London adults (aged 18+)
[13] Of those who answered the question (excludes don’t know, not applicable, prefer not to say responses. Rent or mortgage payments n=677, credit commitments n=730)
[14] Ibid
[15] Ipsos-MORI (2021)
[16] Equivalised means adjusted to account for the size and composition
of the household to allow for comparisons of potential living standards for
different types of households
[17] Based on the Households Below Average Income data, DWP (2021)
[19] Research by the University of Essex, commissioned by City Hall, CeMPA
(2021)
[21] Based on the Living Costs and Food Survey, Workbook 2, ONS (2021)
[22] CPI-consistent inflation rate estimates for UK household groups, ONS (2022)
[23] Bank of England (November 2021)
[24] Bank of England (December 2021)
[25] WTO-UNCTAD, “Merchandise export volume indices, seasonally adjusted – quarterly”
[26] NatWest/IHS Markit (2021)
[27] Baltic Dry Index pricing data available on CNBC
[28] IHS Markit (2022). January 2022 flash data show further progress on supplier delivery times.
[29] IHS
Markit (2022)
[30] Benigno, di Giovanni, Groen, and Noble, “A New Barometer of Global Supply Chain Pressures”, FRBNY Liberty Street Economics (2022)
[32] Natural gas futures pricing data available from CME Group
[33] Crude oil futures pricing data available from CME Group
[35] Producer price index data, ONS (2022)
[36] YouGov on behalf of GLA. All figures, unless otherwise stated, are from YouGov Plc. Total sample size was 1188 adults. Fieldwork was undertaken between 21st - 26th January 2022. The survey was carried out online. The figures have been weighted and are representative of all London adults (aged 18+)
[37] Average weekly earnings data, ONS (2022)
[38] Bank of England/Kantar (2021)
[39] YouGov/Citigroup inflation expectations
[40] Bank of England (2021)
[41] Calculations based on Living Costs and Food Survey data
[43] Calculations based on Living Costs and Food Survey data
[44] Based on data collated by the CME BoEWatch Tool