
Poverty in London 2019/20
Key Points
- Overall poverty levels in London, in the period prior to the pandemic in the UK (up to March 2020), fell marginally. Evidence from elsewhere suggests that poverty levels will have increased during the pandemic, but the official data currently available covers the three year period ending March 2020.
- Child poverty remained stable in London and stands at 38 per cent of all the capital’s children[1]. This represents 800,000 children living in poverty – more than at any time since the data series began in 1994/5.
- Child poverty has increased in some other regions of England such as North East, Yorkshire and the Humber and West Midlands and in Wales, but London remains the part of the UK with the highest proportion of its young people living in poverty.
- Almost three in ten of London’s children are growing up in persistent poverty.
- Estimates for small areas highlight some of the areas in London where the issue of child poverty is most acute, most notably some of the wards in Tower Hamlets and Camden.
- Working age poverty has fallen marginally in London to just below one in four but remains higher than for the UK as a whole.
- Pensioner poverty has increased slightly both for London and nationally and is now higher than working age poverty in London.
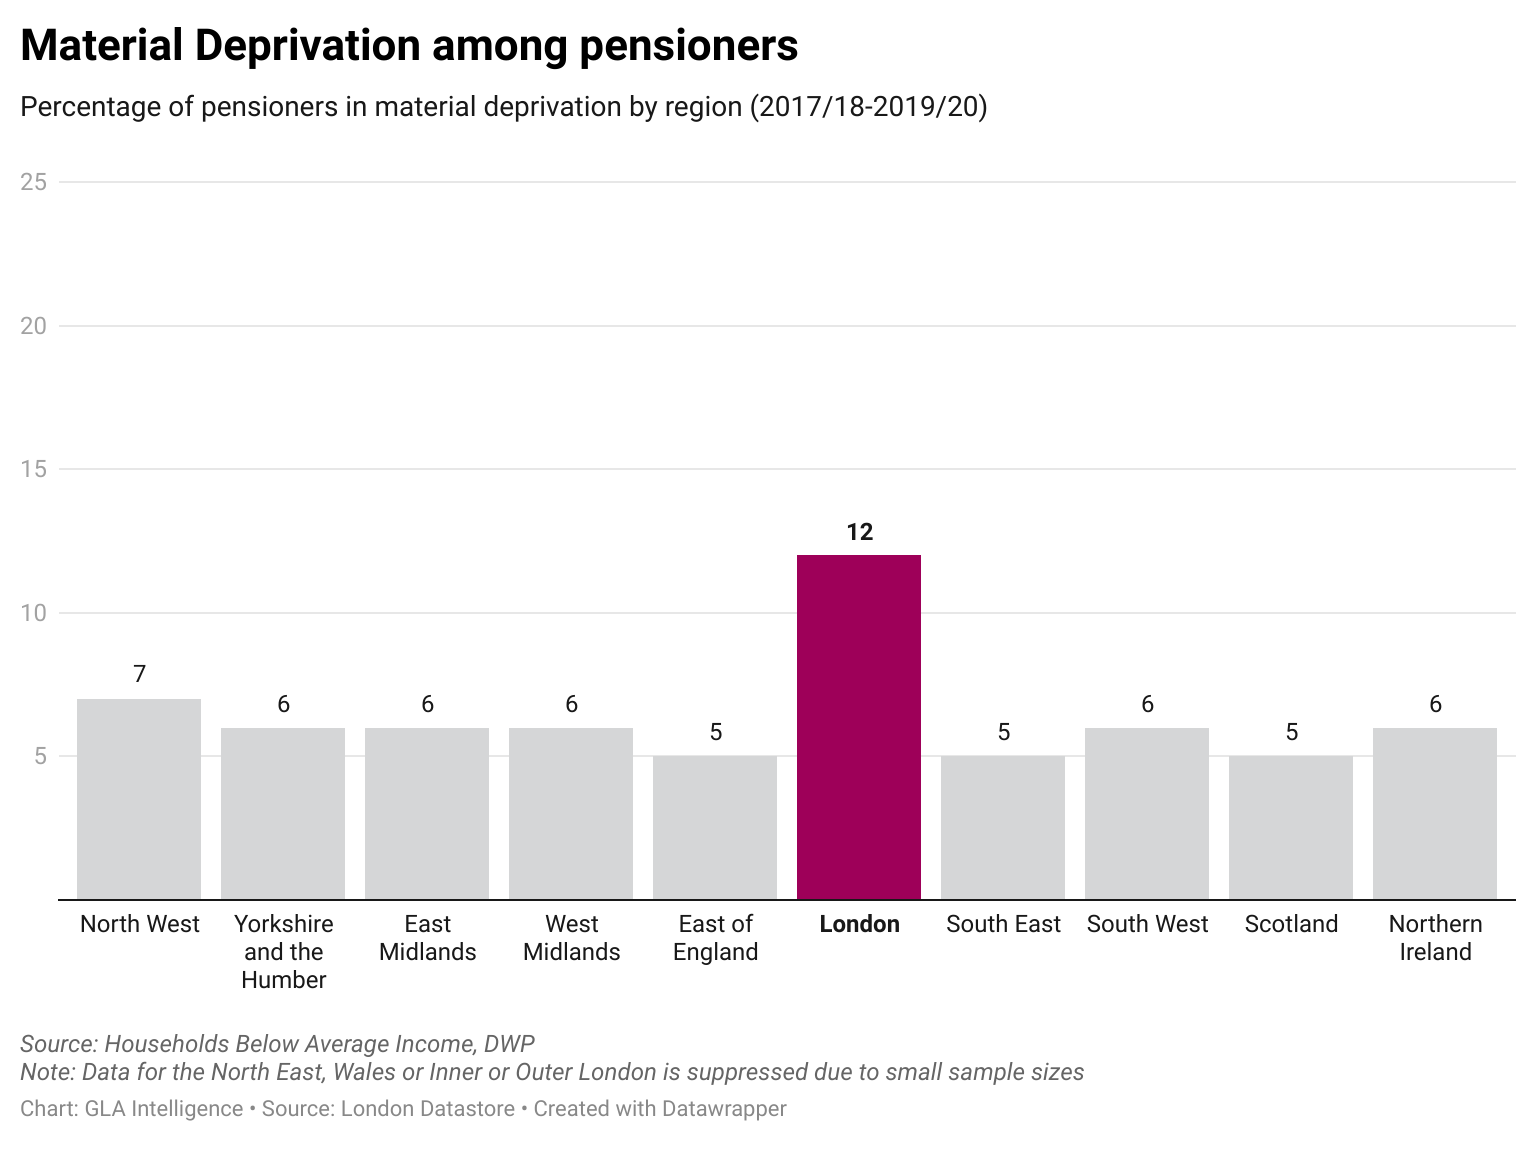
- Nearly one in eight pensioners in London are living in material deprivation, unable to access the necessities for today’s society.
The data used in this analysis relates to the period ending 31st March 2020. The timing means that very few of the responses to the Family Resources Survey, which collects the underlying data to the main poverty statistics will have been impacted by the Coronavirus pandemic, so this dataset gives a good picture of poverty in London immediately prior to the pandemic. Other sources have indicated that incomes of many people have fallen over the last year, that more people have fallen into debt and that inequalities have increased. However, there is, as yet, no detailed data to show precisely how this has impacted.
The total number of Londoners living in poverty fell slightly over the previous year’s estimate but still stood at around 2.4 million people, according to official government figures. This means 27 per cent of everyone living in the region was in poverty, averaged over three years 2016/17-2018/19, down from 28 per cent.
The main poverty measure used is based on current income and is called relative poverty, so people living in households with equivalised[2] income below 60 per cent of the national median (midpoint). The poverty level for 2019/20 equates, for a couple with no children, to around £285 per week, counting all income and deducting taxes and basic housing costs. This is £12 more than the equivalent figure for the previous year, the biggest rise in nearly two decades. It is known as relative poverty after housing costs (AHC) and is the main measure used by the GLA and many other organisations. However, there are different ways to measure poverty, and this brief analysis outlines some of the key findings on those different measures for London.
Overall poverty
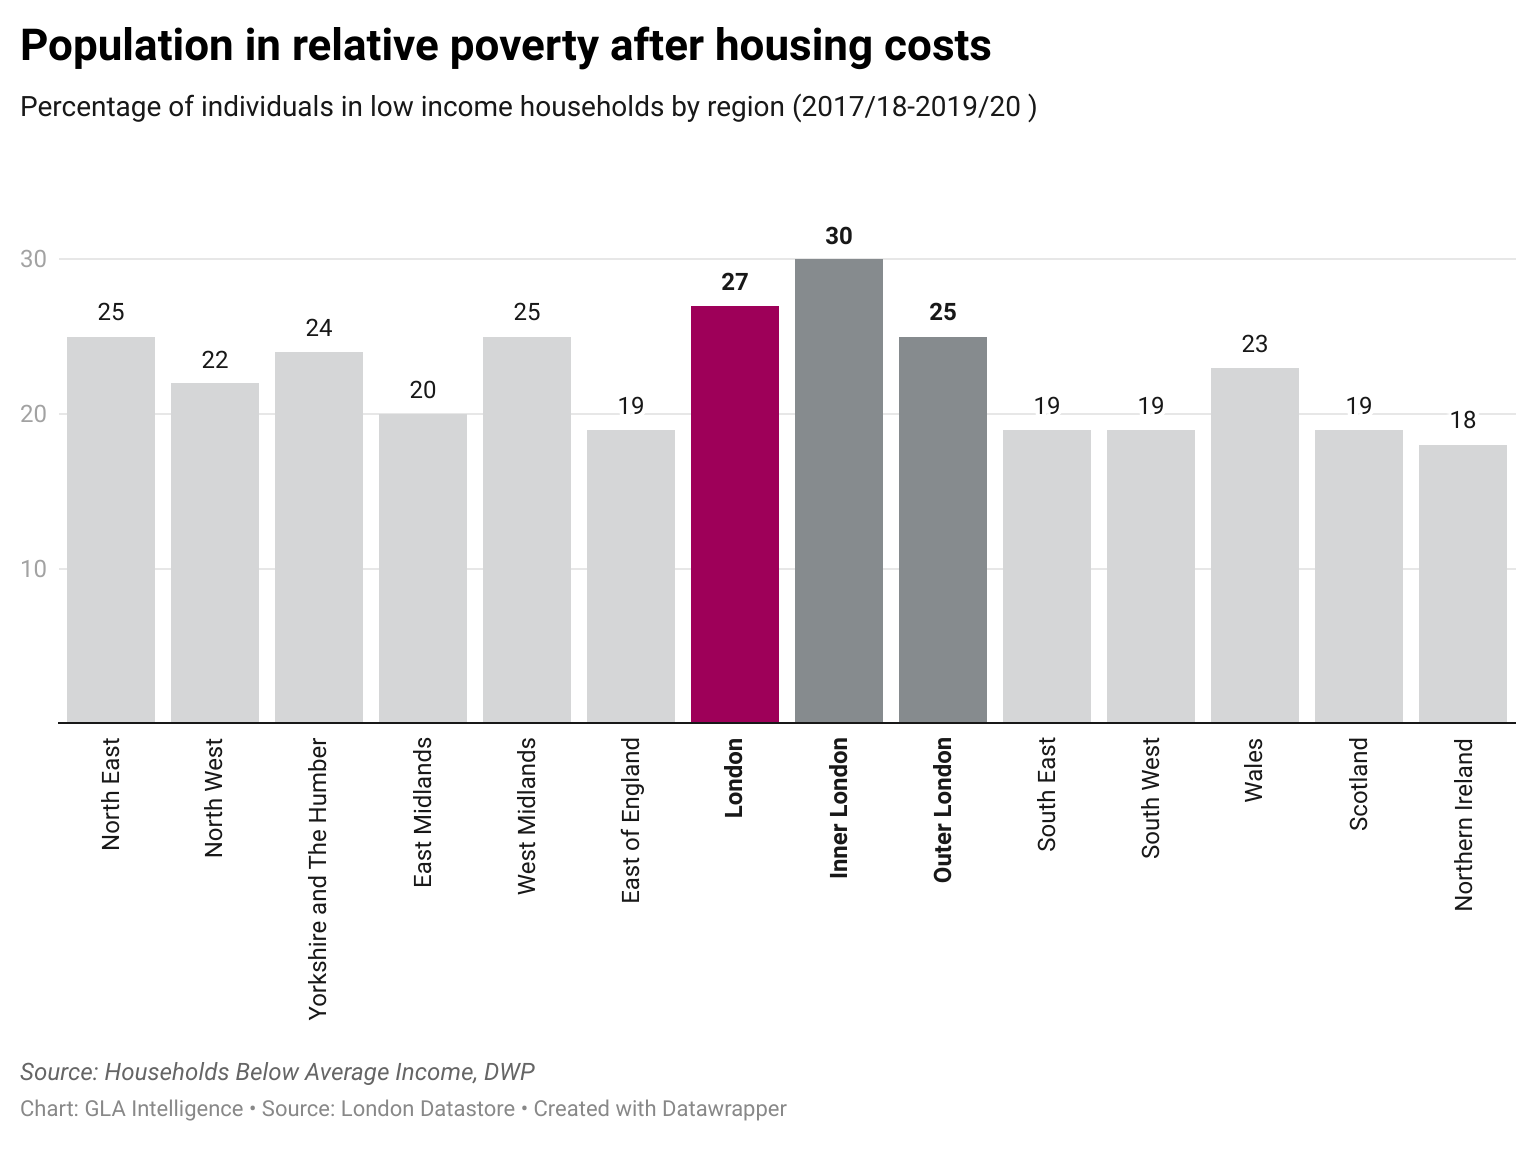
The overall level of poverty in London has changed little over quarter of a century that these data have been collected, only varying between 27 and 30 per cent and so the latest figure, at 27 per cent, matches the lowest figures seen in the early 2000s and then after the recession following the financial crisis. The rate in London has been consistently higher than in any other region or part of the UK. It is five percentage points above the national figure (22 per cent), which is unchanged, though the gap to some of the other regions has narrowed as the rate for London has decreased in the latest figures, while it has increased in recent years in the North East and West Midlands (both 25 per cent) and Yorkshire and the Humber (24 per cent). London’s rate remains nine percentage points above the areas with the lowest rates. Poverty levels in Inner London have also decreased, but remain high, at 30 per cent, while the Outer London rate matches the highest rate outside London, standing at 25 per cent.
In contrast, the poverty rate in London, counting all income and deducting taxes but before taking housing costs into account (BHC), had tracked the national rate more closely, falling a little over the longer term and has been marginally below the national figure in recent years, at 16 per cent in London, compared with 17 per cent for the UK as a whole. Median income in London, at £615 per week (BHC), is higher than in any other region – £20 more than for the next highest region, the South East and more than £120 higher than in the North East, Yorkshire and the Humber, the West Midlands, Wales and Northern Ireland. The median weekly net income across the UK as a whole was £533[3]. The higher income in London is the result not only of higher wages on average, but also higher benefit levels relating to housing. A much higher proportion of London households live in private rented housing and their costs are higher, so the amount paid in Housing Benefit and Universal Credit contributes to overall higher levels of income in London before the costs of housing are taken into account. The costs of housing in London are significantly higher than elsewhere, so that the median figure for income AHC is only a little above the figure for the whole of the UK at £474 per week in London and £462 for the UK.
The mean average weekly household income AHC in London, at £665, is £95 above the national average, due to the much higher incomes in a significant portion of London’s households. At the same time, more than one in five Londoners live in a household with less than half the national median income, that is in households with equivalised weekly income after housing costs of less than £231 per week. This proportion of 21 per cent in what is sometimes termed “severe income poverty” is appreciably higher than for any other region – the next highest is 17 per cent in Yorkshire and the Humber. Together, these illustrate the much greater levels of income inequality in London than found elsewhere in the UK.
Nationally, while the overall poverty rate using the AHC basis has remained fairly stable for more than a decade, the number of people in poverty has increased over the same period, up nearly a million people to more than 14 million. The rates in London have fluctuated a little, but even though the numbers for London (which are three year averages) have decreased slightly in the latest estimate, they have risen over the decade with the increasing population so the latest figures show that 2.4 million people or almost one in six of all people in the UK in poverty live in London.
Poverty by age group
Children
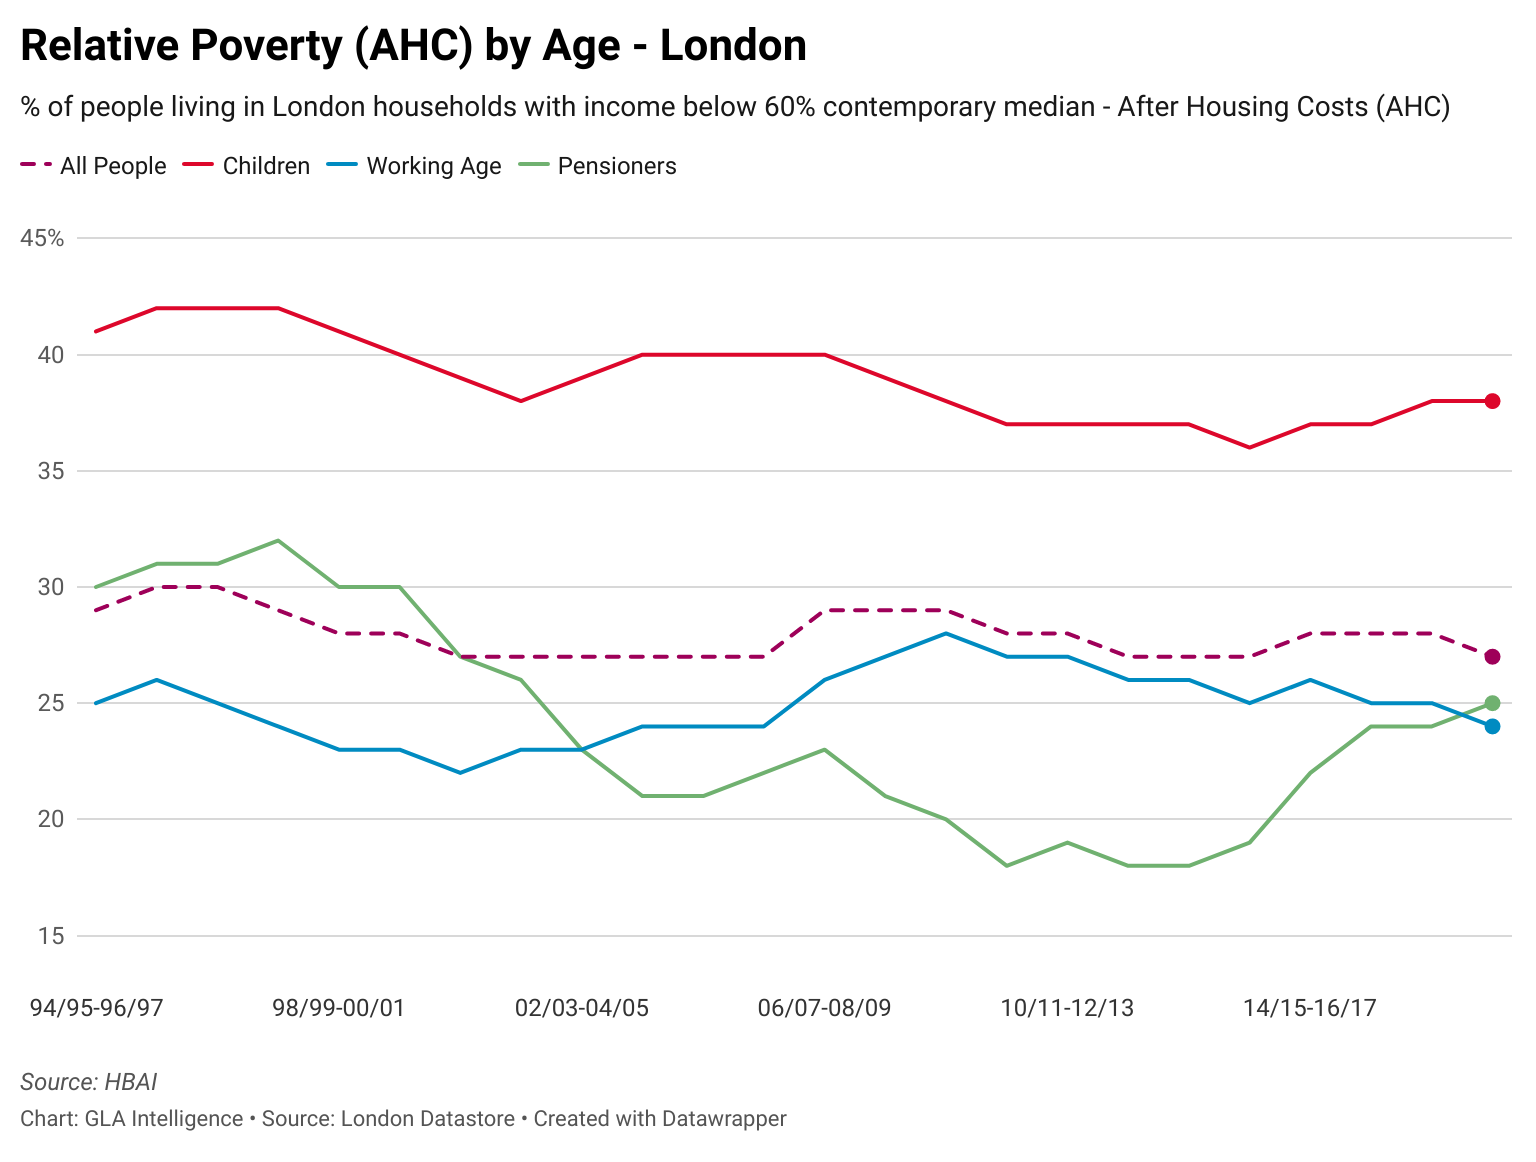
Poverty rates vary across the population according to different attributes. Children are more likely to be living in poverty than adults overall, with 38 per cent of London’s children (800,000) in poverty. This is the same as the previous estimate in both the percentage and number of London’s children living in poverty[4], so although the child poverty rate in London has risen a little over recent years it is still lower than in the mid-1990s but due to the increasing population, the number of children living in low income families is higher. The national rate has not changed, remaining at 30 per cent for the UK (three-year average for 2017/18-2019/20 AHC). Both the London and national rates using the BHC measure have risen by one percentage point over the previous year’s figures to 21 per cent for both London and UK. After housing costs, the proportion of Inner London children living in poverty is now 42 per cent, while the rate in Outer London is 35 per cent. This is still well above the UK figure, but below the rate for the child poverty rate for the North East of England which has risen to 37 per cent and is the same as for the West Midlands.
For some children, their experience of poverty may be relatively short term, but most children in poverty stay in poverty. The percentage of all children in London counted as being in persistent poverty is at its highest level, up to 29 per cent AHC or 19 per cent BHC. That means that more than three quarters of children in poverty are counted as being in persistent poverty[5]. After housing costs, this figure matches the proportion of London’s children living in severe poverty (29 per cent for London as a whole, 33 per cent in Inner London and 27 per cent in Outer London).
Most children in poverty across the UK live in a working household with just one in four children in poverty living in a household with no one in paid employment. Children in households with no one in work are more likely to be in poverty than those in working households. However, there are relatively few workless households with children and the overwhelming majority of children live in working households, so three in four children in poverty live in working households.
Material deprivation – when people cannot afford what are commonly regarded as essentials for life in Britain – affects many London children. From these estimates, prior to the pandemic, low income (below 70% of median income BHC) and material deprivation affected one in eight, while the level of severe low income (below 50% of median income BHC) and material deprivation was lower, at around one in sixteen. These figures have remained unchanged for the last few years. This nevertheless translates to over 100,000 of the capital’s children living in families with income below half of that of the average family and going without the normal necessities. There are similar numbers of children in low income and material deprivation for Inner and Outer London, though as far more children live in Outer London, rates for Inner London are around double those for Outer London.
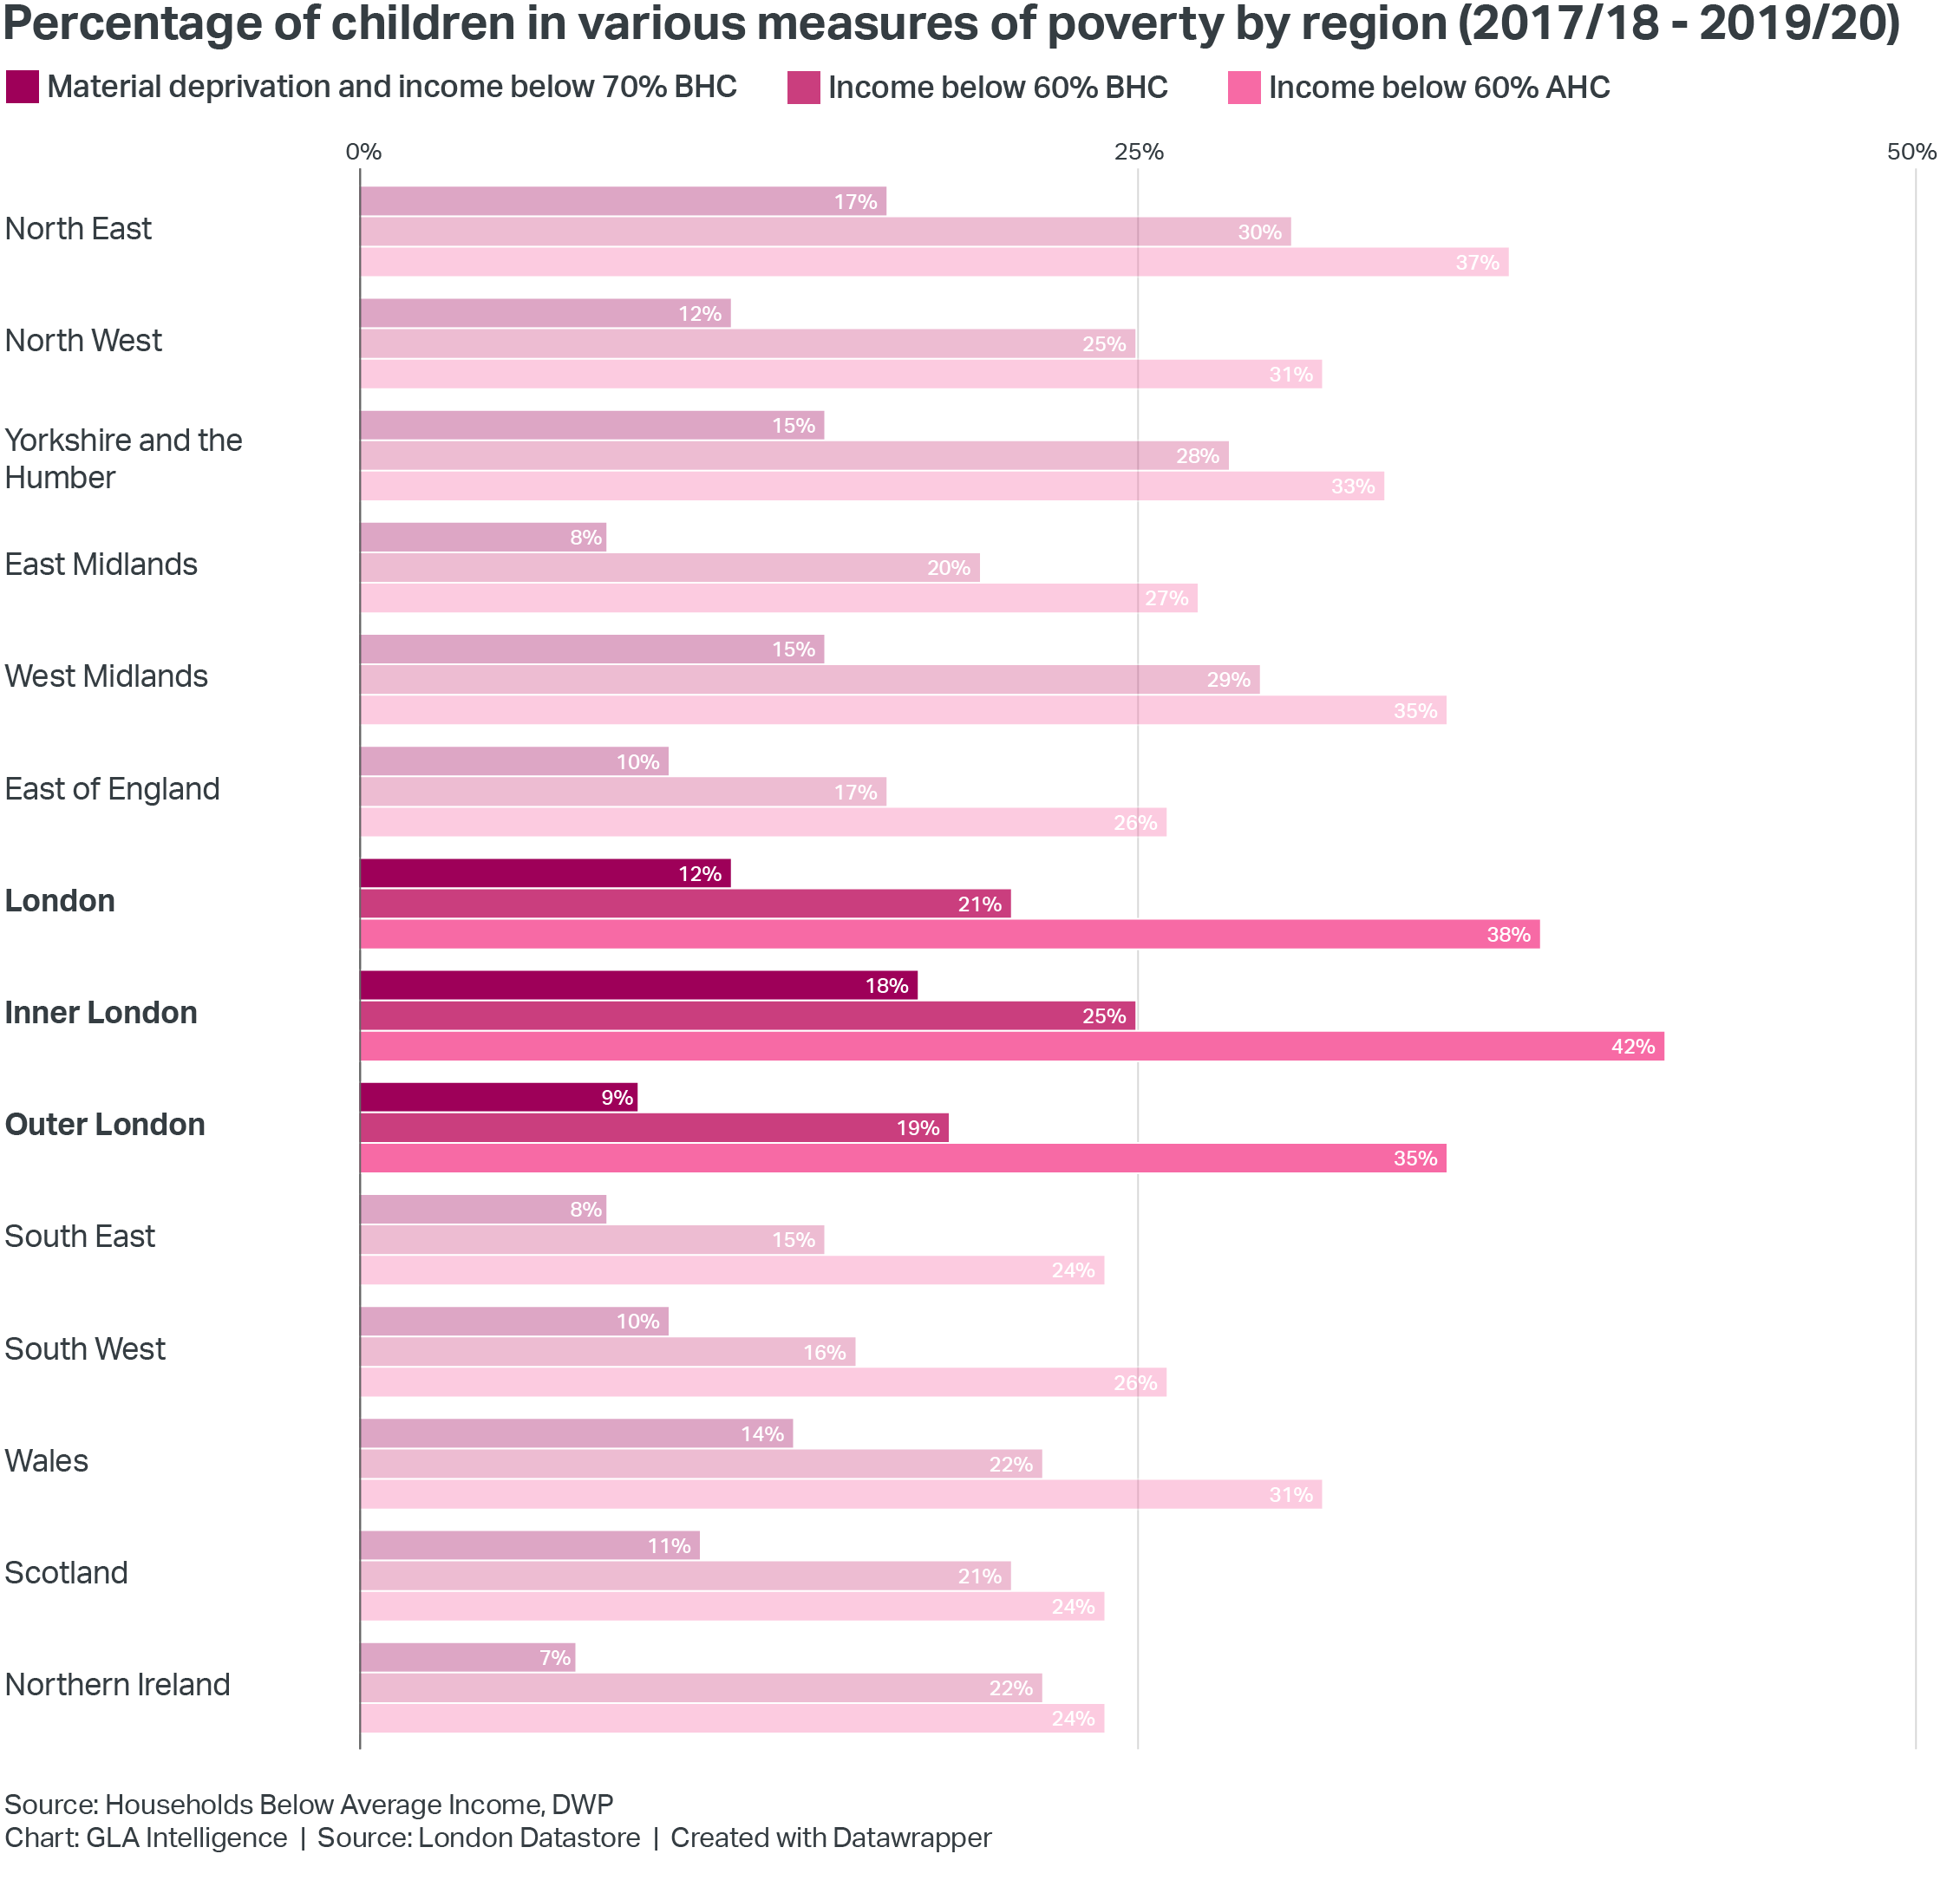
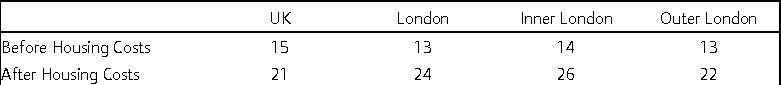
All these different measures help to build up a picture of poverty affecting children. The chart below shows how the different measures compare across the regions and countries of the UK and help to illustrate how the measures vary independently. For example, in Inner London the proportion of children in material deprivation and low income is similar to that for the North East, while the proportion of children in poverty using the Before Housing Costs measure is lower in Inner London, but, using the After Housing Costs measure, is much higher in Inner London than the North East.
The Department for Work and Pensions (DWP) now also publish a set of estimates of the numbers of children in poverty for small areas across Great Britain. This uses administrative records of benefit data, combined with income levels consistent with the HBAI Before Housing Costs measure to give estimates of the number of dependent children in poverty (BHC) for small areas. Using GLA adjusted figures[6] for the number of children under 18 to calculate rates, the map below shows the ward distribution of poverty among children under 18 in London.[7]
The rates given are not comparable with those used elsewhere in this note, since the data are for a single year and the definition does not take into account housing costs, which are a clear driver of poverty levels in London. Nevertheless, these estimates may give some indication of where child poverty is particularly acute within London.
Percentage of population under 18 in low income families, 2019/20
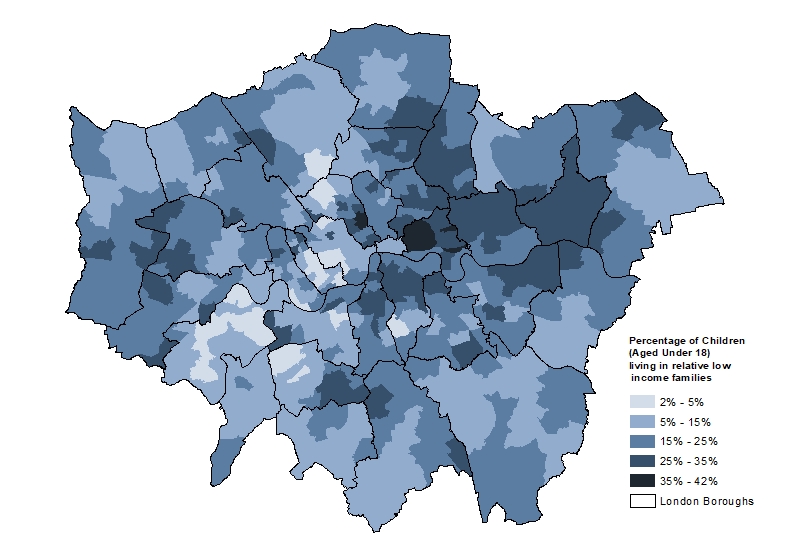
Source: Children in relative low income, 2019/20
Working-age adults
Poverty among working age people in the UK has shown relatively little change over twenty years. In London, the poverty rates for this age group have been decreasing very slowly, and prior to the pandemic stood just below one in four, which is still well above the national figure. This represents 1.4 million working age Londoners living in relative poverty after taking their housing costs into account. Around half of working age Londoners in poverty are classified as in persistent poverty.
Working age poverty rates in London and UK: 2016/17-2018/19
Percentage of people of working age in households with income below 60 per cent of national median
Source: FRS 2017/18 – 2019/20
Pensioners
Pensioners[8] in London are more likely to be in poverty than those in other parts of the UK, with the latest estimates showing this has risen to one in four Londoners aged 65 or over living below the poverty line. High housing costs make London pensioners more likely to be in poverty using the after housing costs measure, while in the rest of the UK, pensioners are more likely to be counted as in poverty using the before housing costs measure, though the difference has narrowed in the latest estimates. Despite the fact that many pensioners in London and elsewhere own their homes outright, and thus have reduced housing costs, renting remains more common in London than in many other areas for this age group. Even using the BHC measure, poverty has risen in recent years and is higher among pensioners in London than those living anywhere else in the UK with the exception of Wales, which has a similar proportion of its older residents in poverty (22 per cent). Around one in ten London pensioners are classified as in persistent poverty (AHC), having been counted as living in poverty in at least three years out of the last four[9].
Material deprivation is also more prevalent among older Londoners than in other parts of the UK, with 12 per cent of all pensioners in London unable to afford or being prevented by health or disability issues or social isolation from having such necessities as a damp-free home, access to a telephone or having their hair cut regularly. This proportion is, however, following a slowly decreasing trend, in contrast to the measures of income.
All data in this briefing note are derived from published DWP Households Below Average Income series, based on the Family Resources Survey, DWP Income Dynamics, which uses underlying data from Understanding Society and DWP estimates of Children in relative low income, which are derived mainly from data collected to administer benefits and tax credits.
[1] Estimates for previous years have been revised due to changes in
how child maintenance payments are counted.
[2] Adjusted for household size and composition to give a measure of
potential living standard comparable across different household types.
[3] All monetary values are three year averages calculated at 2019/20
prices
[4] Estimates for previous years have been revised due to changes in
how child maintenance payments are counted. This change impacts most in the
data for families with children, reducing the estimates of children in poverty
compared with estimates produced using the previous methods.
[5] Persistent poverty is defined as being in poverty in the latest
years and in at least two of he previous three years.
[6] Estimates for wards used here are based on ONS mid year estimates,
but adjusted for known issues with local estimates for children relating to
international migration.
[7] A small proportion of children aged under 18 would not be included
as dependent children, including those who live independently of their parents,
those in employment, those with their own partner or child. Additionally, children
are counted at their term time address, so there may be some underestimation of
poverty rates among children with a home address in a ward which includes a
boarding school, while wards with a higher proportion of children with a home
address in that ward, but who attend a boarding school would tend to show
overestimated poverty.
[8] Pensioners are all residents aged 65 or over in this analysis
[9] Note that this is of people who were counted in poverty in the
latest data and were already over state retirement age in the first of the four
years.