
Poverty in London 2018/19
Key Points:
- Overall poverty levels have stayed the same in London and nationally.
- Child poverty has risen in London, both in terms of number and rates and now stands at 39 per cent of all the capital’s children. This represents 800,000 children living in poverty – more than at any time since the data series began in 1994/5.
- Nearly one in three of London’s children are growing up in persistent poverty.
- Nearly one in three of London’s children are growing up in persistent poverty.
- New data giving estimates for small areas highlight some of the areas in London where the issue is most acute.
- Working age poverty remains higher in London than nationally.
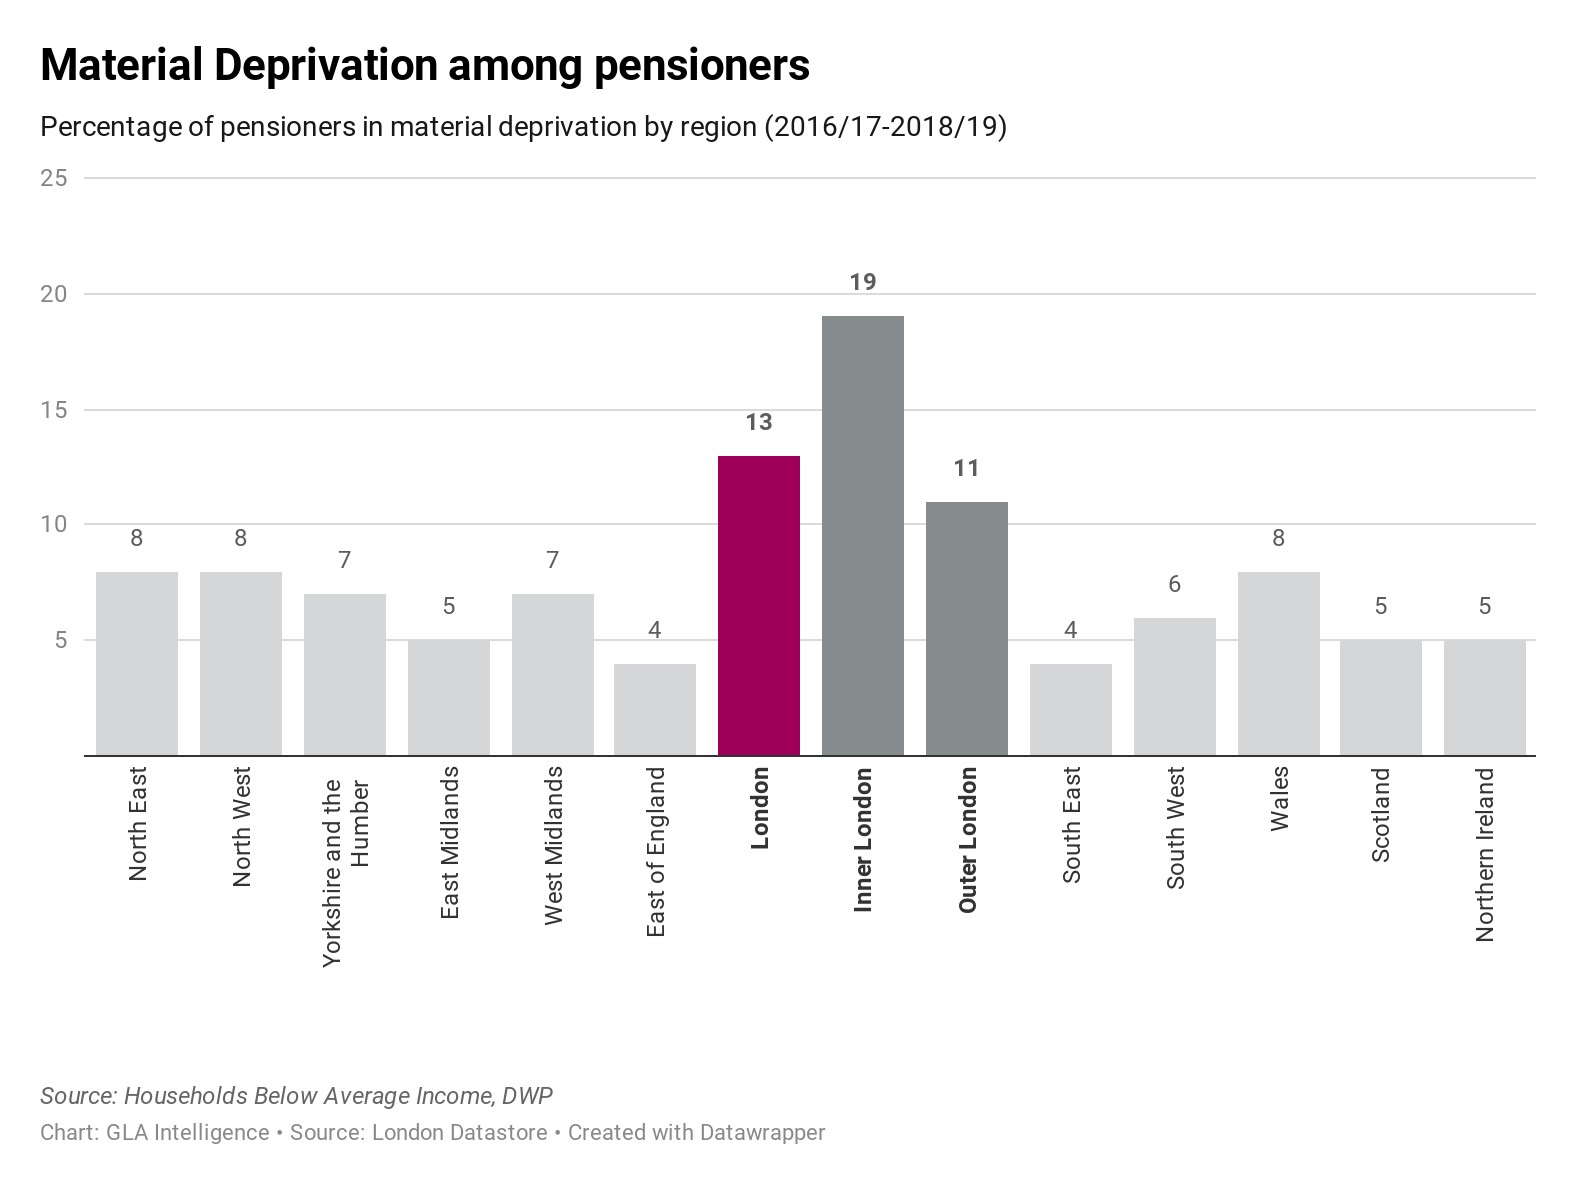
- Nearly one in five pensioners in Inner London is living in material deprivation unable to access the necessities for today’s society.
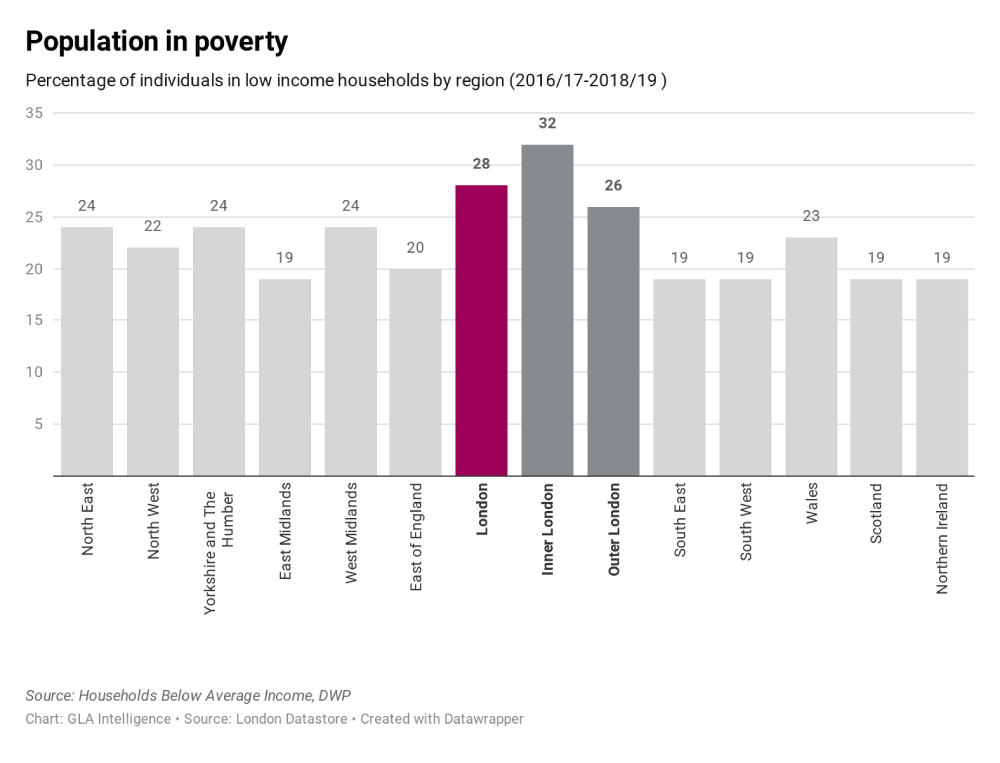
The total number of Londoners living in poverty has continued to rise over the last few years with the growing population and now stands at around 2.5 million people, according to official government figures. This means 28 per cent of everyone living in the region are in poverty, averaged over three years 2016/17-2018/19. This percentage has been the same for the last three years’ publications.
The main poverty measure used is based on current income and is called relative poverty, so people living in households with equivalised[1] income below 60 per cent of the national median (midpoint). The poverty level for 2018/19 equates, for a couple with no children, to around £268 per week, counting all income and deducting taxes and basic housing costs. This is £6 more than the equivalent figure for the previous year. It is known as relative poverty after housing costs (AHC). However, there are different ways to measure poverty, and this brief analysis outlines some of the key findings on those different measures for London.
The overall level of poverty in London has changed little over the two decades that these data have been collected, only varying between 27 and 30 per cent and now stands at 28 per cent, marginally higher than in the years immediately following the recession, but no change from the last two years. The rate in London has been consistently higher than in any other region or part of the UK. It is six percentage points above the national figure (22 per cent), which is also unchanged, four percentage points higher than any other region and nine percentage points above the areas with the lowest rates. Poverty levels in Inner London remain significantly higher, at 32 per cent, while the Outer London rate has risen slightly and is also higher than elsewhere standing at 26 per cent.
In contrast, the poverty rate in London, counting all income and deducting taxes but before taking housing costs into account (BHC), had tracked the national rate more closely, falling a little over the longer term and has been below the national figure in recent years, rising to 16 per cent in London, compared with 17 per cent for the UK as a whole. Median income in London, at £589 per week (BHC), is higher than in any other region. This compares with £517 nationally. The higher income in London is the result not only of higher wages, but also higher benefit levels relating to housing. A much higher proportion of London households live in private rented housing and their costs are higher, so the amount paid in Housing Benefit and Universal Credit contributes to overall higher levels of income in London before the costs of housing are taken into account. The costs of housing in London are significantly higher than elsewhere, so that the median figure for income AHC is only just above the figure for the whole of the UK at £454 per week in London and £448 for the UK.
Nationally, while the overall poverty rate using the AHC basis has remained fairly stable for more than a decade, the number of people in poverty has increased over the same period, up nearly a million people to more than 14 million. The rates in London have fluctuated a little, but the numbers for London (which are three year averages) have risen steadily with the increasing population so the latest figures show that more than one in six of all people in the UK in poverty live in London.
Poverty by age group
Children
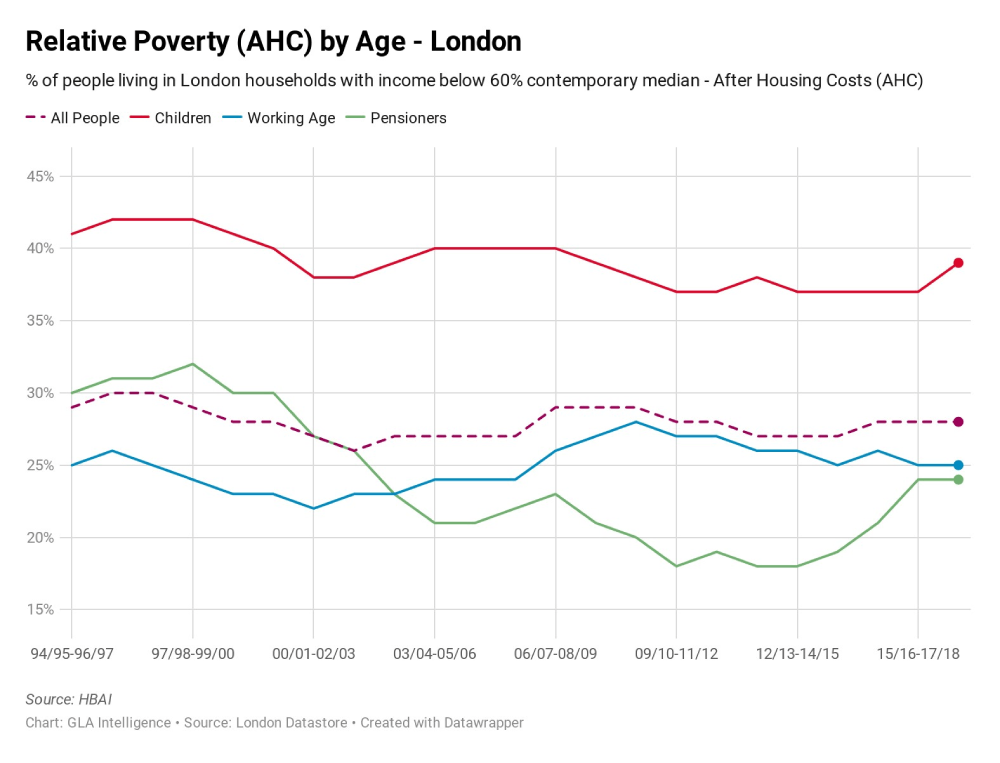
Poverty rates vary across the population according to different attributes. Children are more likely to be living in poverty than adults overall, with 39 per cent of London’s children (around 800,000) in poverty. This represents an increase in both the percentage and number of London’s children living in poverty, so there are now more children living in low income families than at any time since the data series began in 1994/5 and the percentage has increased back to the levels seen a decade ago. The national rate has not changed, remaining at 30 per cent for the UK (three year average for 2016/17-2018/19 AHC). Both the London and national rates using the BHC measure have risen by one percentage point over the previous year’s figures to 20 per cent for London and 21 per cent for UK. After housing costs, the percentage of Inner London children living in poverty has increased further, up to 45 per cent, while the rate in Outer London has also risen to 35 per cent. This is still well above the UK figure, but matches the rate for the North East of England which has the next highest poverty rate among children after London. For some children, their experience of poverty may be relatively short term, but most children in poverty stay in poverty. The percentage of all children in London counted as being in persistent poverty has shown a clear increase, up to 30 per cent AHC or 15 per cent BHC. That means that more than three quarters of children in poverty are counted as being in persistent poverty.
Most children in poverty live in a working household. This does not mean that children in workless households are not in poverty – children in households with no one in work are more likely to be in poverty than those in working households. However, there are relatively few workless households with children and the overwhelming majority of children live in working households, so nearly three in four children in poverty across the UK live in working households.
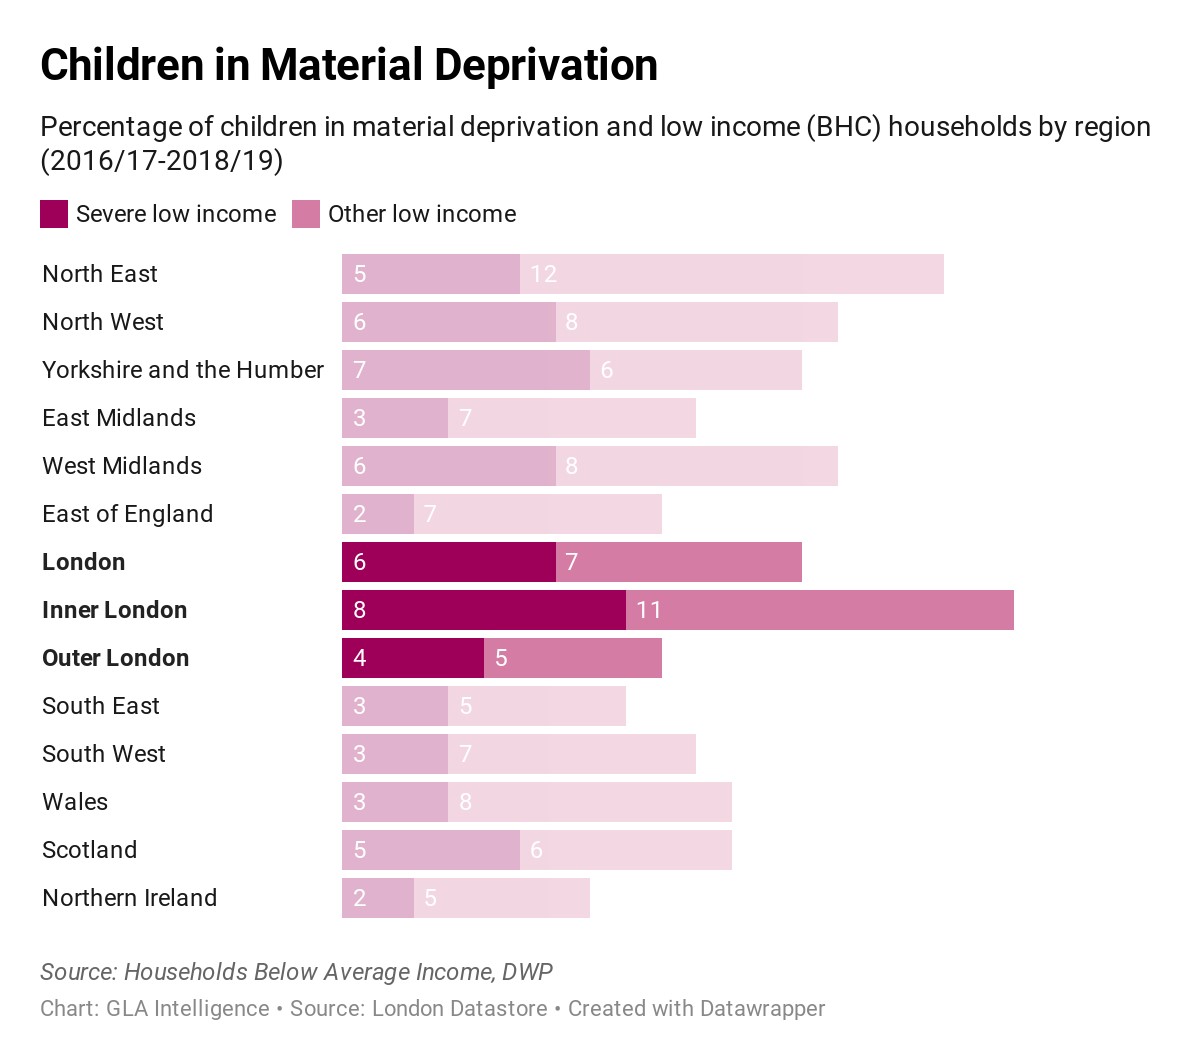
Material deprivation – when people cannot afford what are commonly regarded as essentials for life in Britain – affects many London children. Low income (BHC) and material deprivation affects one in eight, while the level of severe low income and material deprivation is lower, at around one in sixteen, similar to the previous year’s figures. This nevertheless translates to over 100,000 of the capital’s children living in families with income below half of that of the average family and going without the normal necessities. There are similar numbers in Inner and Outer London, though the rates for Inner London are around double those for Outer London.
The Department for Work and Pensions have also published for the first time this year a set of estimates of the percentage of children in poverty for small areas across Great Britain. This uses administrative records of benefit data, combined with incomes levels consistent with the HBAI Before Housing Costs measure to give estimates of the number of children in poverty (BHC) for small areas and numbers of children aged under 16 from ONS ward level population estimates to calculate rates, which are then calibrated at regional level to the HBAI. The resulting map for London wards using the 2018/19 ward level rates is shown below.
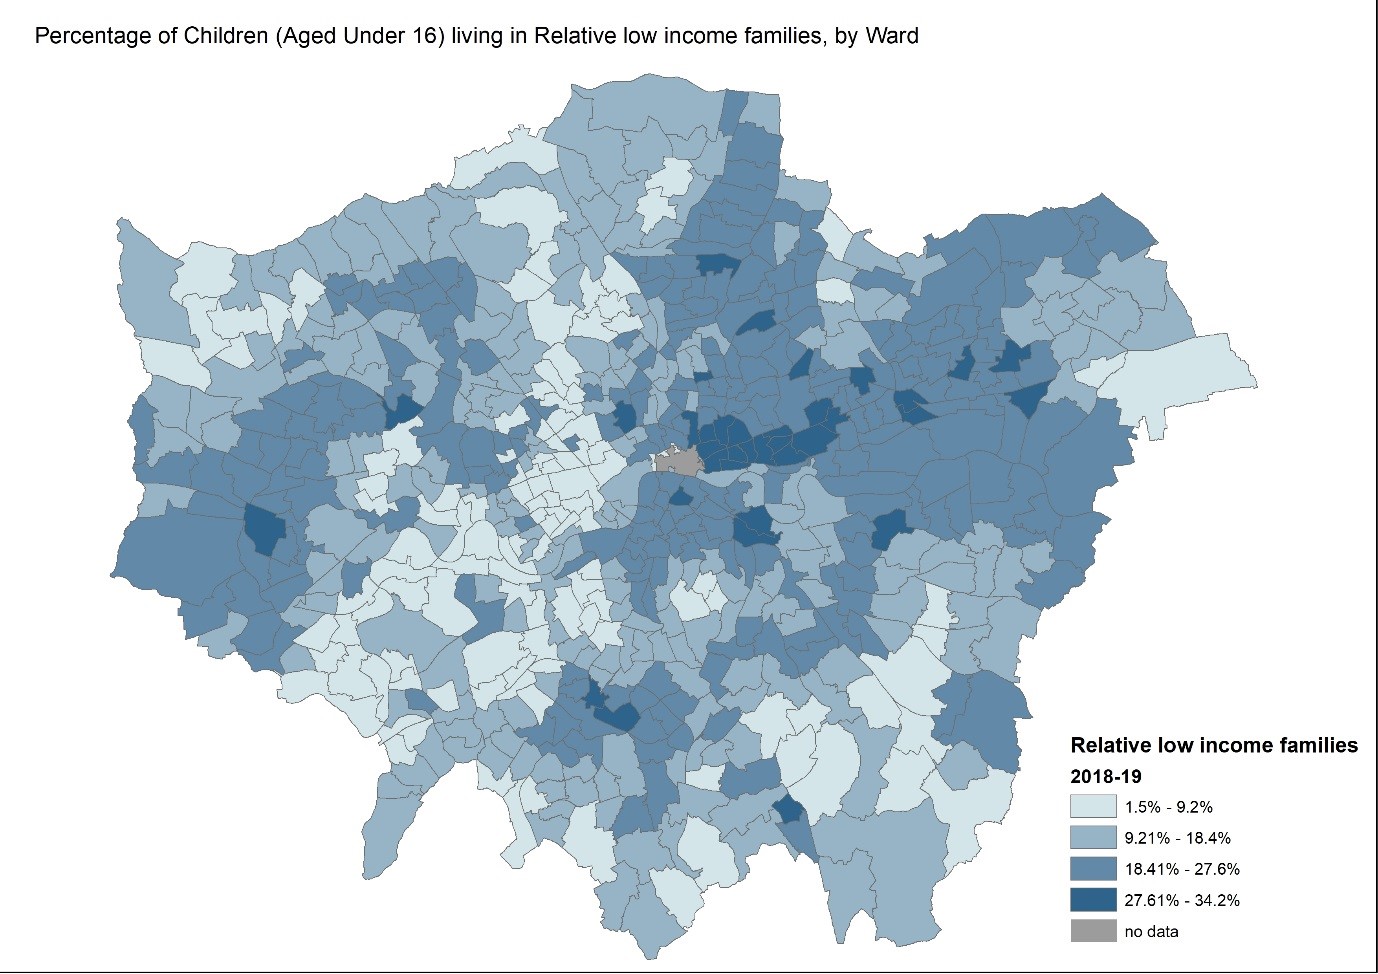
The rates given are not comparable with those used elsewhere in this note, since the definition does not take into account housing costs, which are a clear driver of poverty levels in London. There are also further known overestimates in the population estimates for numbers of children in particularly affecting some parts of London. The issue is greatest in areas with high levels of international migration, with Westminster probably being the standout example with numbers of children age 4 being up to 50% higher in the MYE than other sources would suggest. This feeds through to other age groups, but is difficult to quantify for each ward the effect on the poverty rates shown here. Nevertheless, these estimates may give some indication of where child poverty is particularly acute within London.
Working Age
Poverty among working age people in the UK has shown relatively little change over twenty years. In London, the poverty rates for this age group have hovered around one in four, which is well above the national figure. This represents 1.5 million working age Londoners living in relative poverty after taking their housing costs into account. Around 60 per cent of working age Londoners in poverty might be classified as in persistent poverty.
Working age poverty rates in London and UK: 2016/17-2018/19
Percentage of people of working age in households with income below 60 per cent of national median
|
UK |
London |
Inner London |
Outer London | |
|
Before Housing Costs |
15 |
14 |
15 |
13 |
|
After Housing Costs |
21 |
25 |
29 |
23 |
|
Source: FRS 2016/17 – 2018/19 |
Pensioners
High housing costs also make London pensioners more likely to be in poverty. In contrast, in the rest of the UK, pensioners are more likely to be counted as in poverty using the before housing costs measure than after housing costs are taken into account. Despite the fact that many pensioners in London and elsewhere own their homes outright, and thus have reduced housing costs, renting remains more common in London than in many other areas for this age group. Poverty in London among pensioners rose sharply in the previous year’s figures on both measures, which has been maintained in the latest data release with an even further increase in the BHC measure, up to 20 per cent of all London’s pensioners. Almost one in four people over retirement age living in London (24 per cent) has income after housing costs below the poverty line. Around one in ten are classified as in persistent poverty, having been counted as living in poverty in at least three years out of the last four [2].
Material deprivation among older Londoners is much higher than in other parts of the UK, with 13 per cent of all pensioners in London unable to afford or being prevented by health or disability issues or social isolation from having such necessities as a damp-free home, access to a telephone or having hair cut regularly. This was, however, lower than in the previous year’s data. Material deprivation among pensioners in Inner London stood at 19 per cent.
All data in this analysis are derived from published DWP Family Resources Survey, Households Below Average Income series or Income Dynamics.
[1] Adjusted for household size and composition to give a measure of potential living standard comparable across different household types.
[2] Note that this is of people who were counted in poverty in the latest data and were already over state retirement age in the first of the four years.