
London labour market projections 2022 – Interim update
London’s economy has generated employment at an unprecedented rate over the past 30 years, adding nearly 2m jobs since 1991. But what can we expect over the next 30 years? To help answer this question, GLA Economics has published an interim update of its long-term employment projections. This supplement provides an overview of the report, highlights the main findings – for London, for its economic sectors and for local authorities – and briefly describes the methodology we use.
What are the long-term employment projections?
GLA Economics has periodically published long-term employment projections over the past 20 years. A key role of these projections has been to support the evidence base for the London Plan, with the last set published in 2017.
The purpose of the 2022 interim update is twofold. First, it supports users of the projections, both within the GLA group and externally, in long-term planning. And second, it provides an updated reference case that can be refined as some of the labour market uncertainties associated with the COVID-19 pandemic become clearer.
As in previous publications, this interim update provides long-term employment projections for London, for the main industry sectors of its economy (up to 2051), and for London local authorities (up to 2041). Our projections are based on historic productivity trends and assumptions about the future path of economic output. Borough-level projections are also informed by plans for increases in employment site capacity.
What are the main results for London?
We project fast medium-term growth, slowing significantly in the long term.
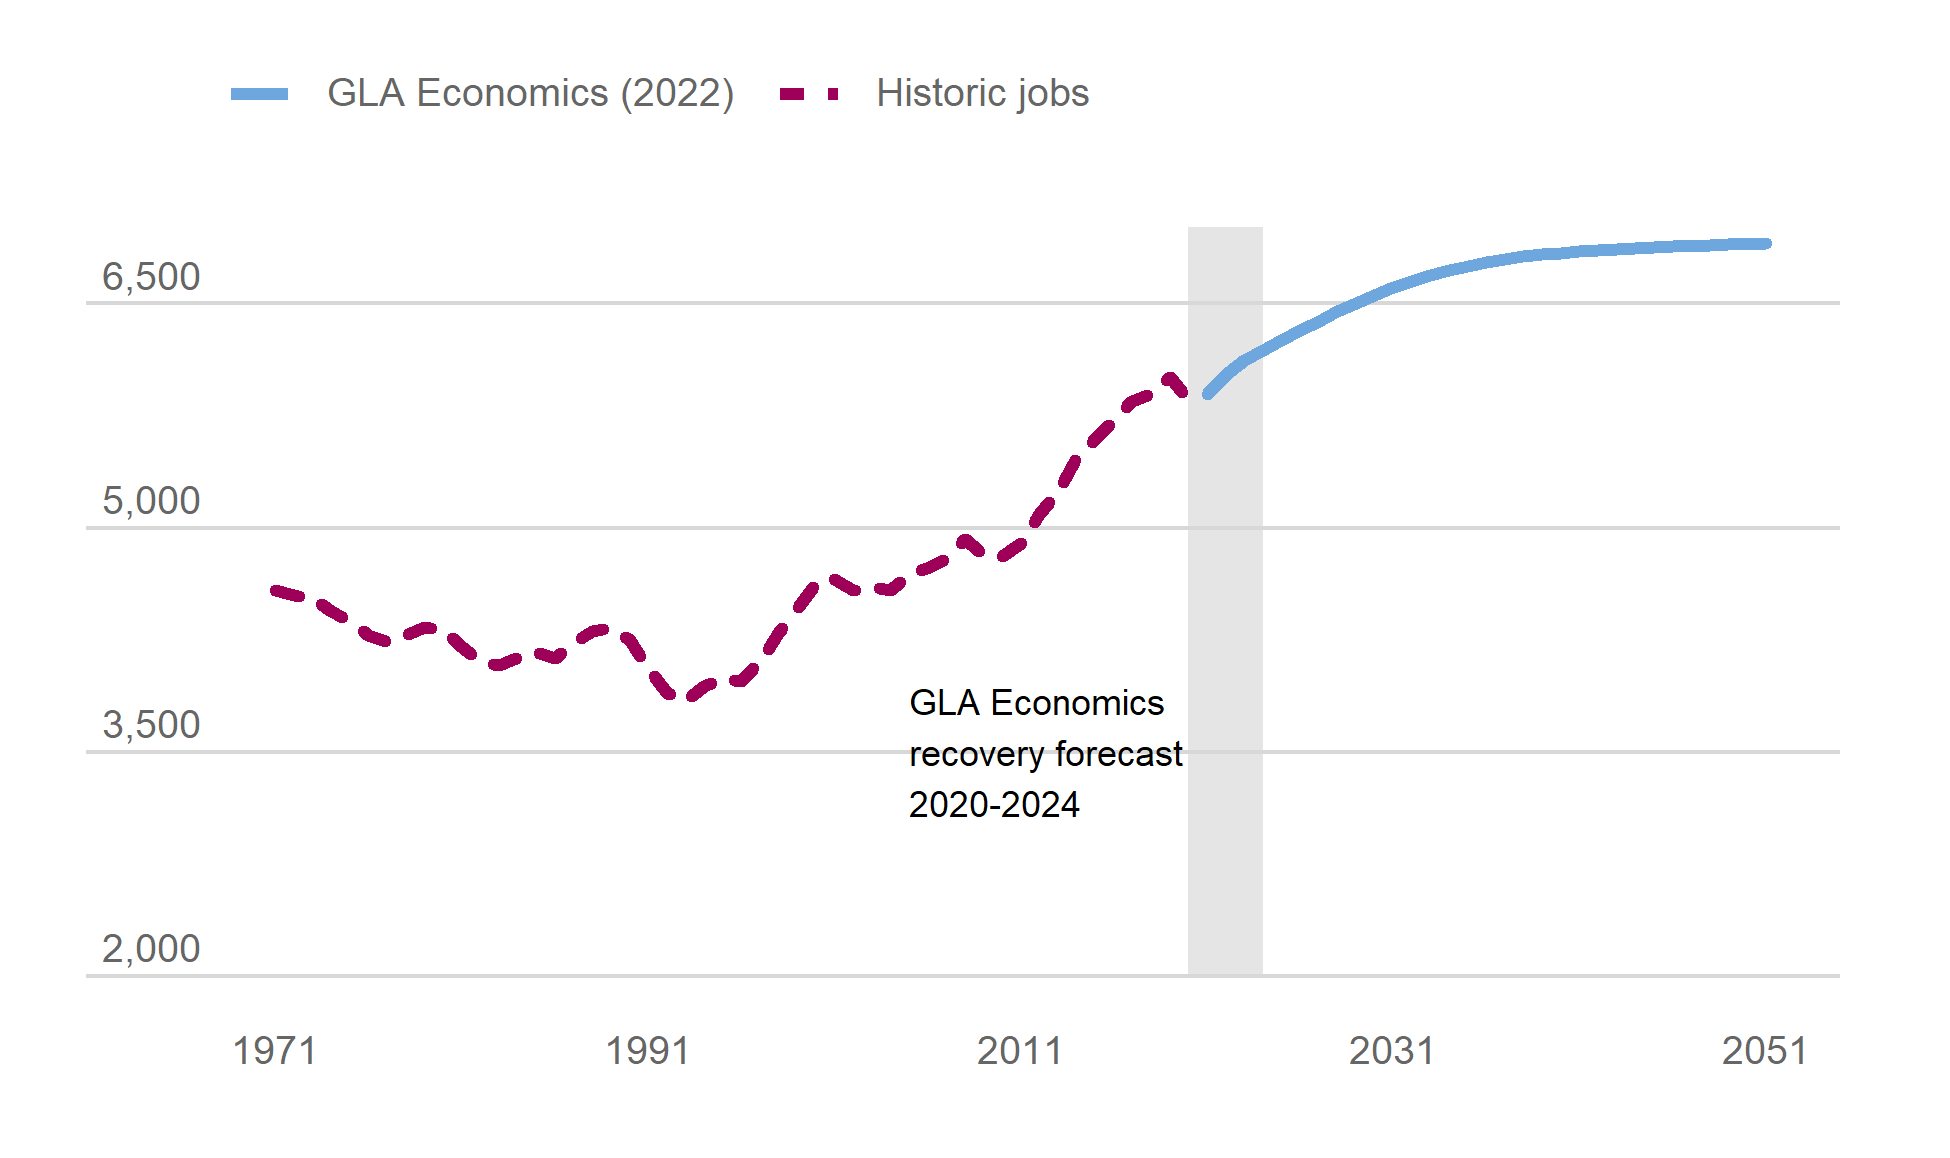
Based on historic trends, we project employment in London to rise from 6m jobs in 2021 to 6.6m in 2031, 6.8m in 2041 and 6.9m in 2051. This is an average increase of 29,000 jobs a year.
The 2051 projection represents a 4% decrease, or 300,000 jobs, from the previous GLA Economics projection of 7.2m jobs in 2050. Much of this difference is accounted for by the final decade of the period: in looking at the years 2041-50, we now project jobs growth of around 5,000 jobs per year, down from 28,000 previously. The growth path in our interim update involves faster additions of jobs in the 2020s followed by a slowdown through the 2030s, which continues to the end of the projections period.
We show in the report that these results are within a plausible range suggested by three commercial external forecasters; our own alternative population-trend based model; and Office for Budget Responsibility (OBR) forecasts of UK population, economic growth and labour productivity.
Figure 1: London Employment History and Projections (Jobs, 000s)
What methodology was used to produce these results?
These projections are designed to provide a guide to the long-run (approximately three decades) path of employment based on the data available at the time of construction. They are not intended as forecasts for individual years within the projection period.
For the short-term period (up to 2024) we draw on GLA Economics forecast for jobs and output.
Our long-term employment projections for London then ‘jump off’ from these levels, starting in 2025. These trend-based projections estimate jobs in future years based on assumed future output growth and the historic productivity relationship between output and jobs.
What assumptions are used for future output and productivity in London?
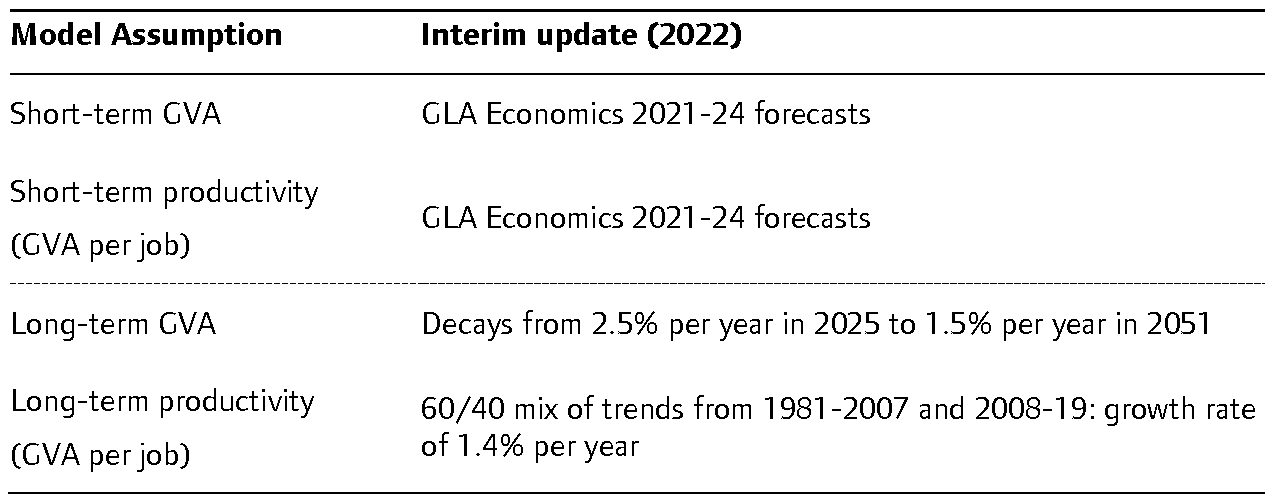
In line with the approach taken in our previous round of projections, we project London’s gross value added (GVA) growth rate declining from its forecast of 2.5% in 2024, to match the OBR’s forecast for the UK of 1.5% in 2051.
We update our productivity trend assumptions to provide more weight to the post-financial crisis stagnation, and less weight to the faster growth rate in the 1990s and early 2000s. We use statistical analysis to identify structural breaks in London’s productivity trends to support these choices.
Table 1: Assumptions for output and productivity used in constructing employment projections
How will the sectoral mix of London’s economy change?
There have been significant changes in the industrial composition of London’s labour market over the past 30 years. Manufacturing, Wholesale, and Primary and utilities jobs have declined in absolute and relative terms, while the number of Professional services, Information and communication and Hospitality jobs has grown.
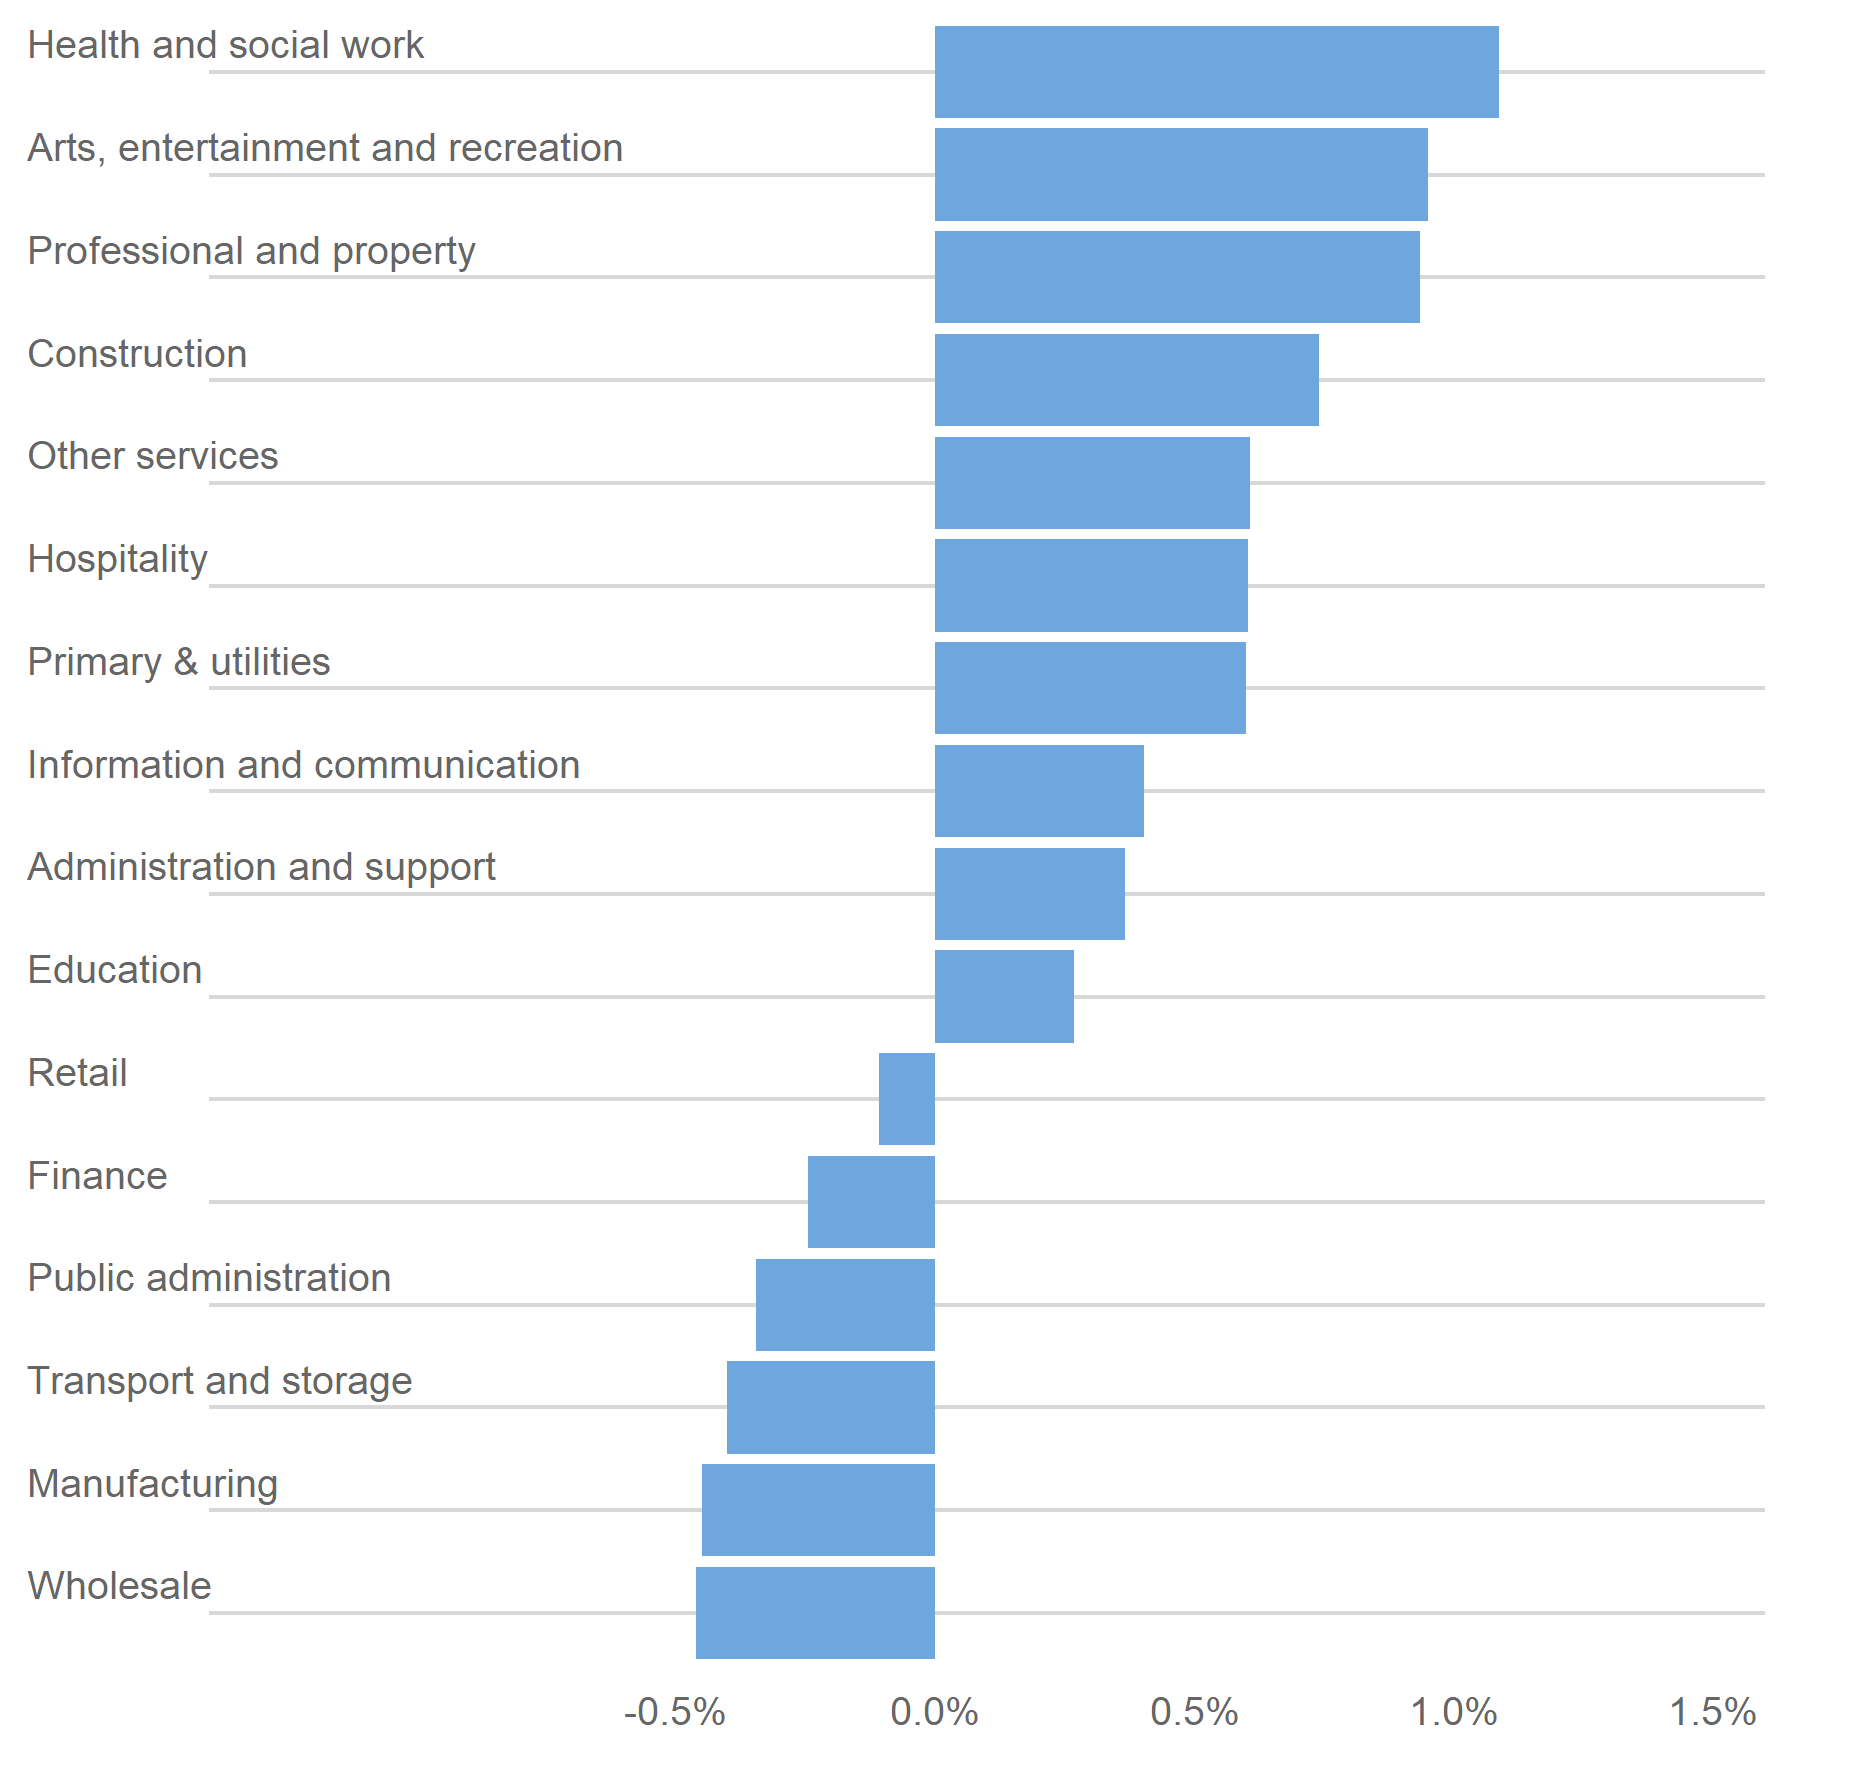
We project the Professional services and Other business services sectors to continue to add large numbers of jobs (+335,000 jobs by 2051). Fast growth in Professional services jobs over the past 30 years has made it by far the largest sector in London’s economy. While we continue to expect it to grow at a faster rate than for total jobs in London, it won’t be quite as fast as in the past decade, or as fast we expected in our last round of projections.
Other sectors where we project high job gains are Health and social work (+244,000 jobs) and Hospitality (+96,000 jobs); we also project a high rate of jobs growth in the Arts and recreation sector (nearly 1% p.a.)
We also project jobs to decline, by 2051, in six sectors: Manufacturing; Wholesale; Retail; Transport and storage; Finance; and Public administration. These are all sectors in which jobs growth has been relatively slow, or in some cases negative, during the past 10 years when London employment as a whole grew rapidly. Since we project lower London aggregate growth in the coming years, it follows that these are the sectors most likely to decline.
Figure 2: Compound annual growth rates of employment in London’s sectors, 2019-2041
What is the methodology for borough projections and which London boroughs will see the fastest and slowest growth?
We use a similar productivity-trend based approach to project employment in London local authorities. But because different boroughs have different plans for increasing employment space, we bi-angulate the trend-based results with the outputs of the London Employment Site Database (LESD). This GLA publication aggregates planned and/or expected increases in employment site capacity across London.
The results lead us to project rising jobs in every London borough over the 2019-41 period covered by the LESD. Annual growth rates range from 0.1% in Lewisham and Sutton, to 2.3% in Newham, compared to the London average of 0.6% a year.
Inner London boroughs are projected to grow faster than outer London boroughs, at 0.7% a year (adding 664,000 jobs in total) compared to 0.4% a year (adding 178,000 jobs) respectively.
However, within both areas there is wide dispersion in growth rates.
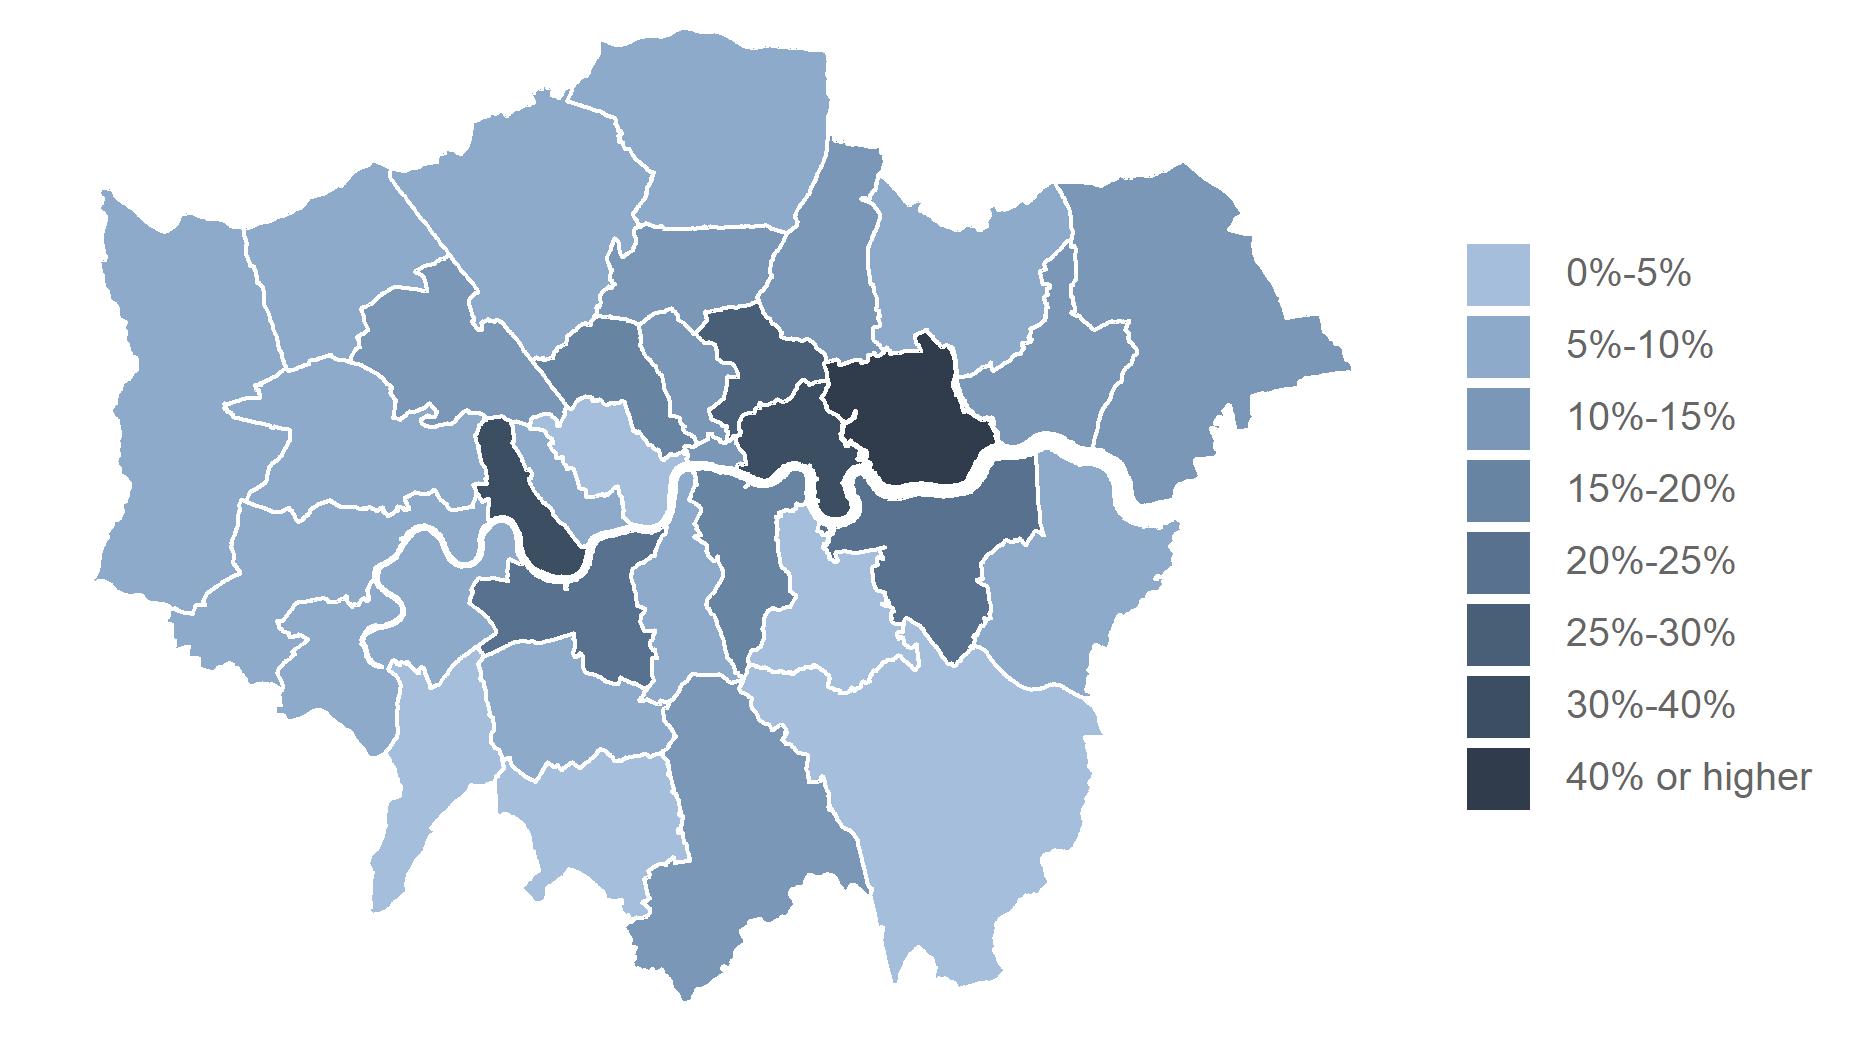
In inner London, jobs growth over the 2019-41 period ranges from less than 10% in Lewisham, Westminster, Kensington and Chelsea, and Lambeth, to over 30% in Hackney, Hammersmith and Fulham, and Tower Hamlets, and to over 60% in Newham. The City of London and the boroughs to its south and east (Hackney, Tower Hamlets, Newham, Greenwich and Southwark) together account for over half (427,000) of the 842,000 new jobs projected in the period. These areas, along with Wandsworth, and Hammersmith and Fulham, all have significant identified employment site capacity.
Employment growth is also dispersed in outer London: Sutton, Kingston upon Thames and Bromley all grow less than 5%, while Waltham Forest, Havering, Croydon, Brent, Barking and Dagenham, and Haringey grow at more than 10%.
Figure 3: Projected total employment growth in London local authorities, 2019-2051
Where can I see the full report and download all the data?
The full report can be downloaded from the London Datastore, along with spreadsheets containing all our results for London, sectors and boroughs.