
Indices of Deprivation 2019 Initial Analysis
The Indices of Deprivation 2019 (ID2019) are the Government’s primary measure of deprivation for small areas (known as LSOAs) in England. They replace and update the Indices of Deprivation 2015. The main index is the Index of Multiple Deprivation (IMD), which combines measures across seven distinct aspects of deprivation. It is important to note that the ID 2019, though published in 2019 are based largely on administrative data from 2015 and 2016, while the ID2015 use data mainly from 2012.
Overall, London is less deprived, compared to other parts of the country according to IMD2019 than was the case in IMD2015.
The number of neighbourhoods (LSOAs) in London among the most deprived 5% in England is just eight out of a total of 4,835 LSOAs in London, or 0.2 per cent of London’s LSOAs, and just two per cent more (a further 99 LSOAs) are in England’s most deprived 10%.
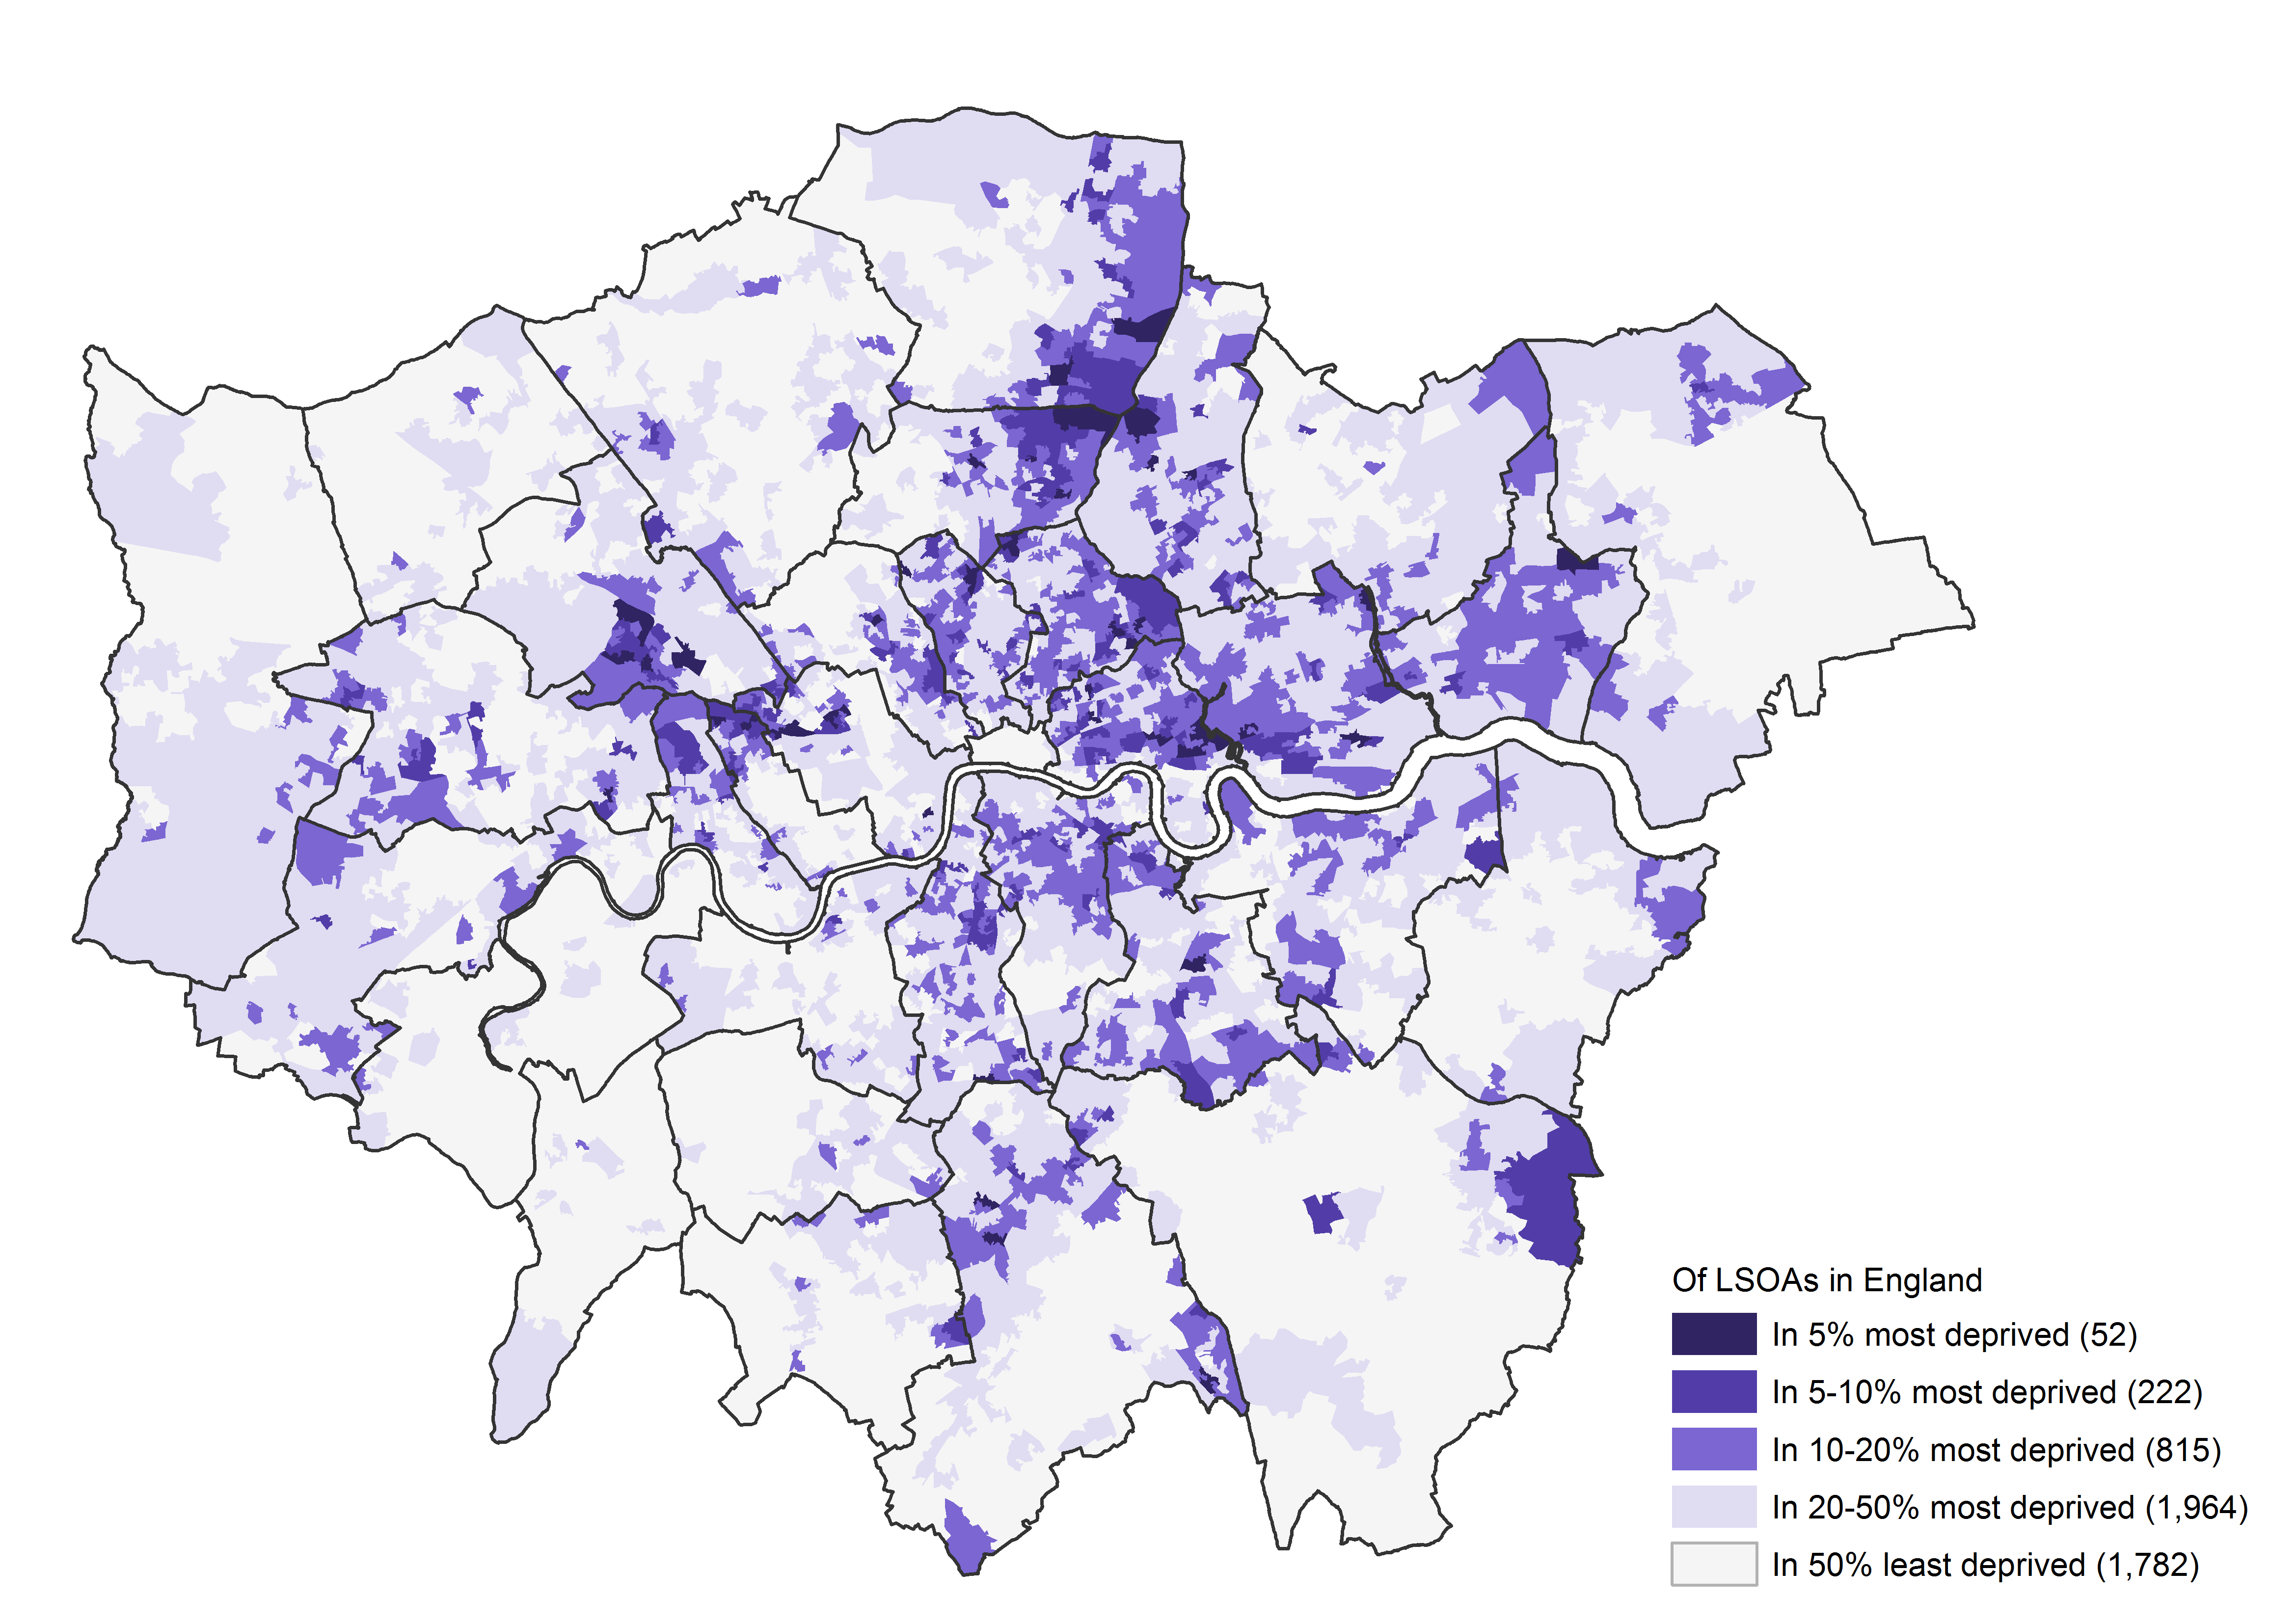
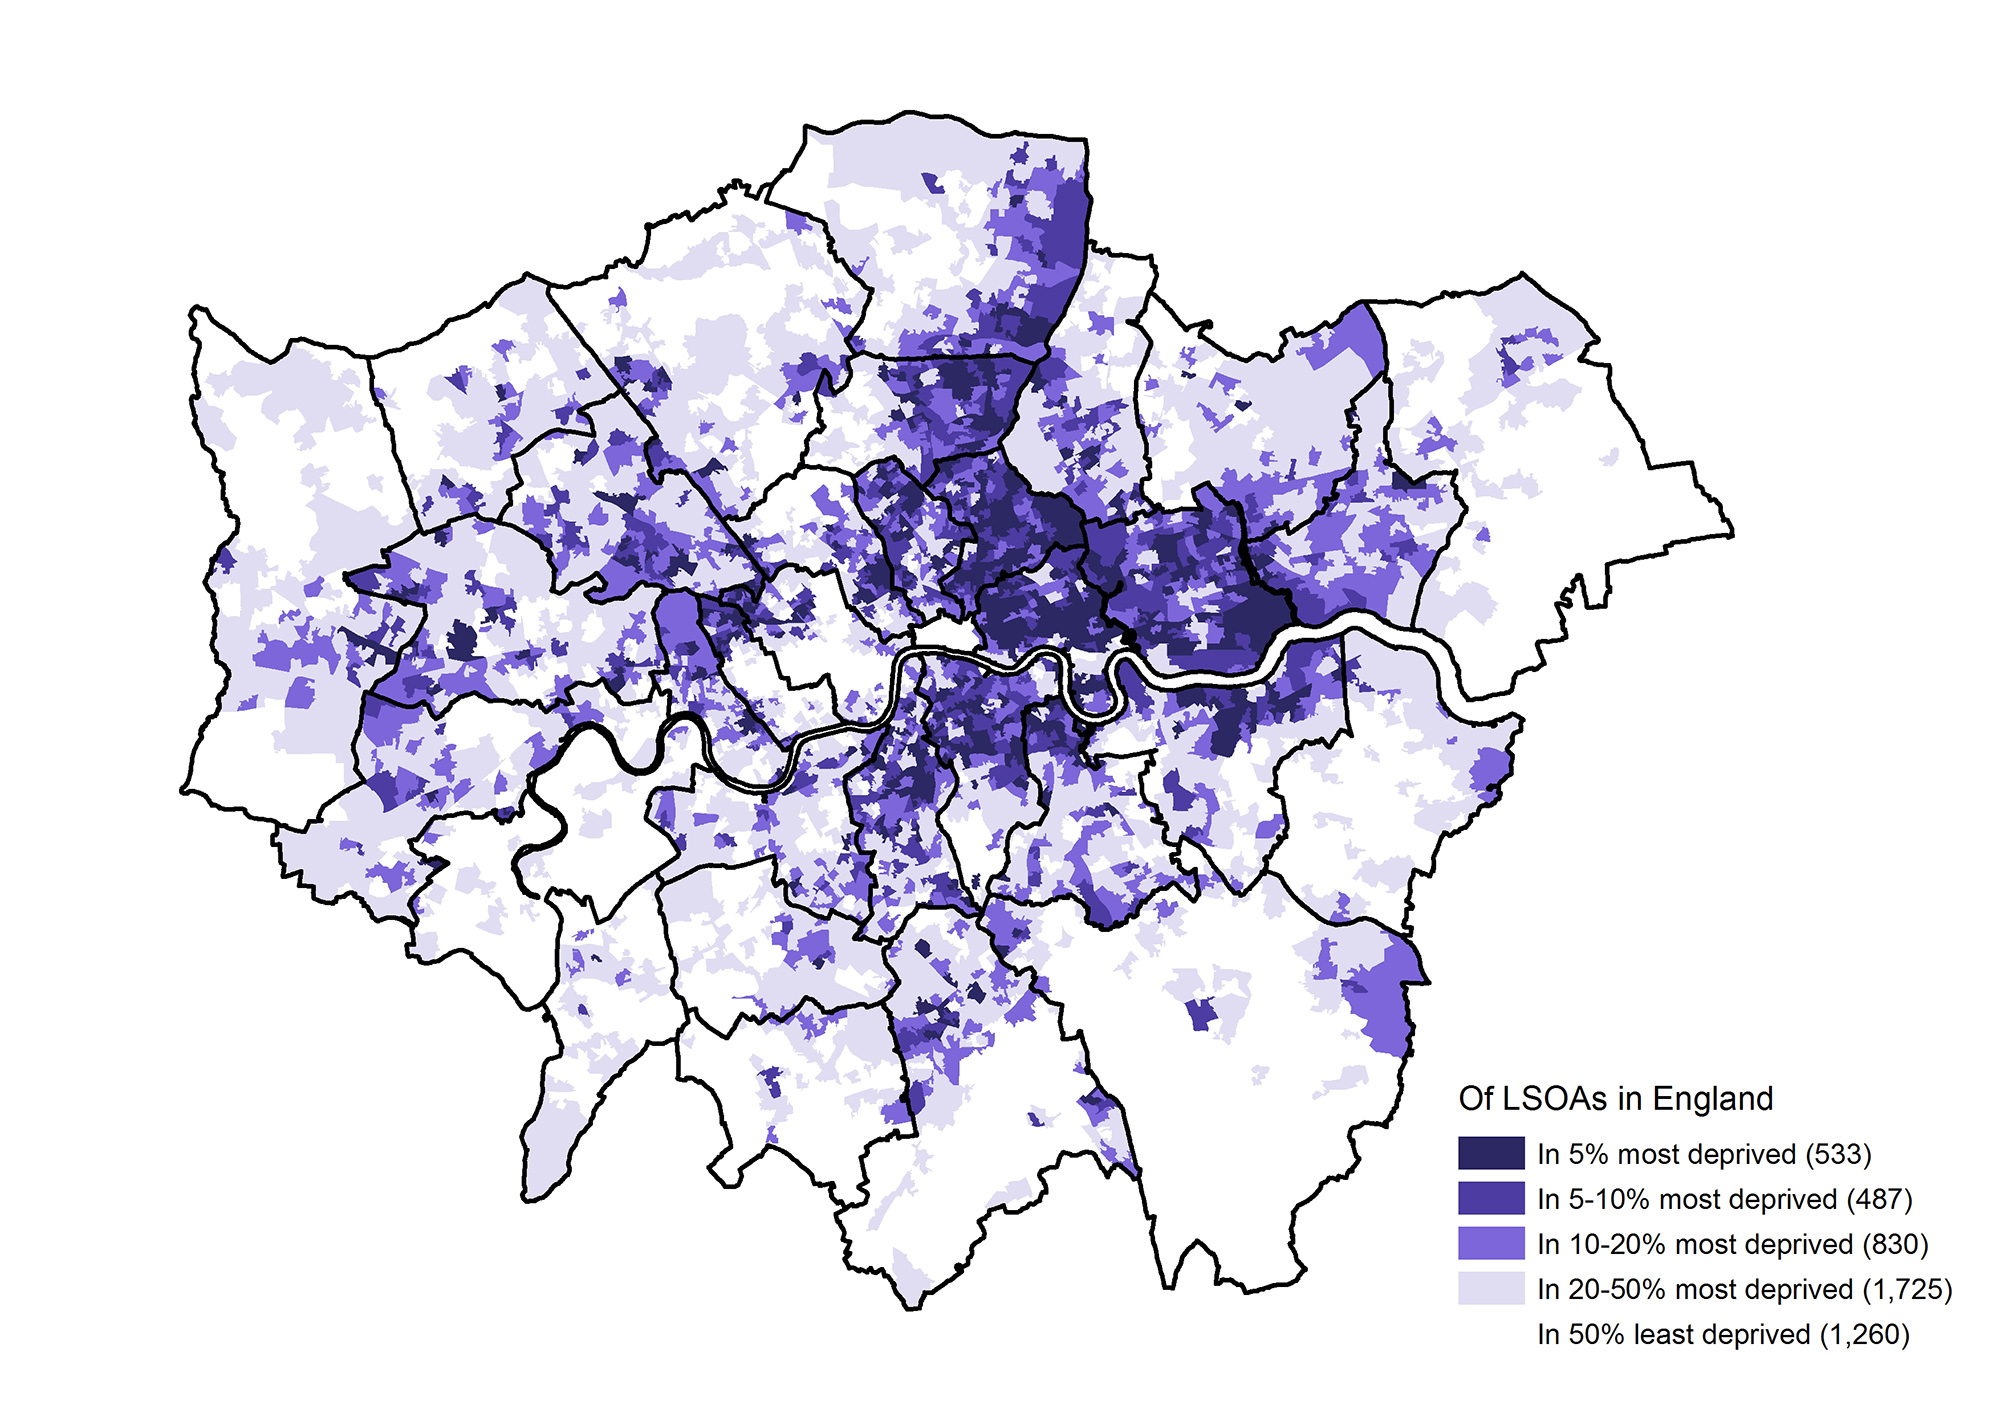
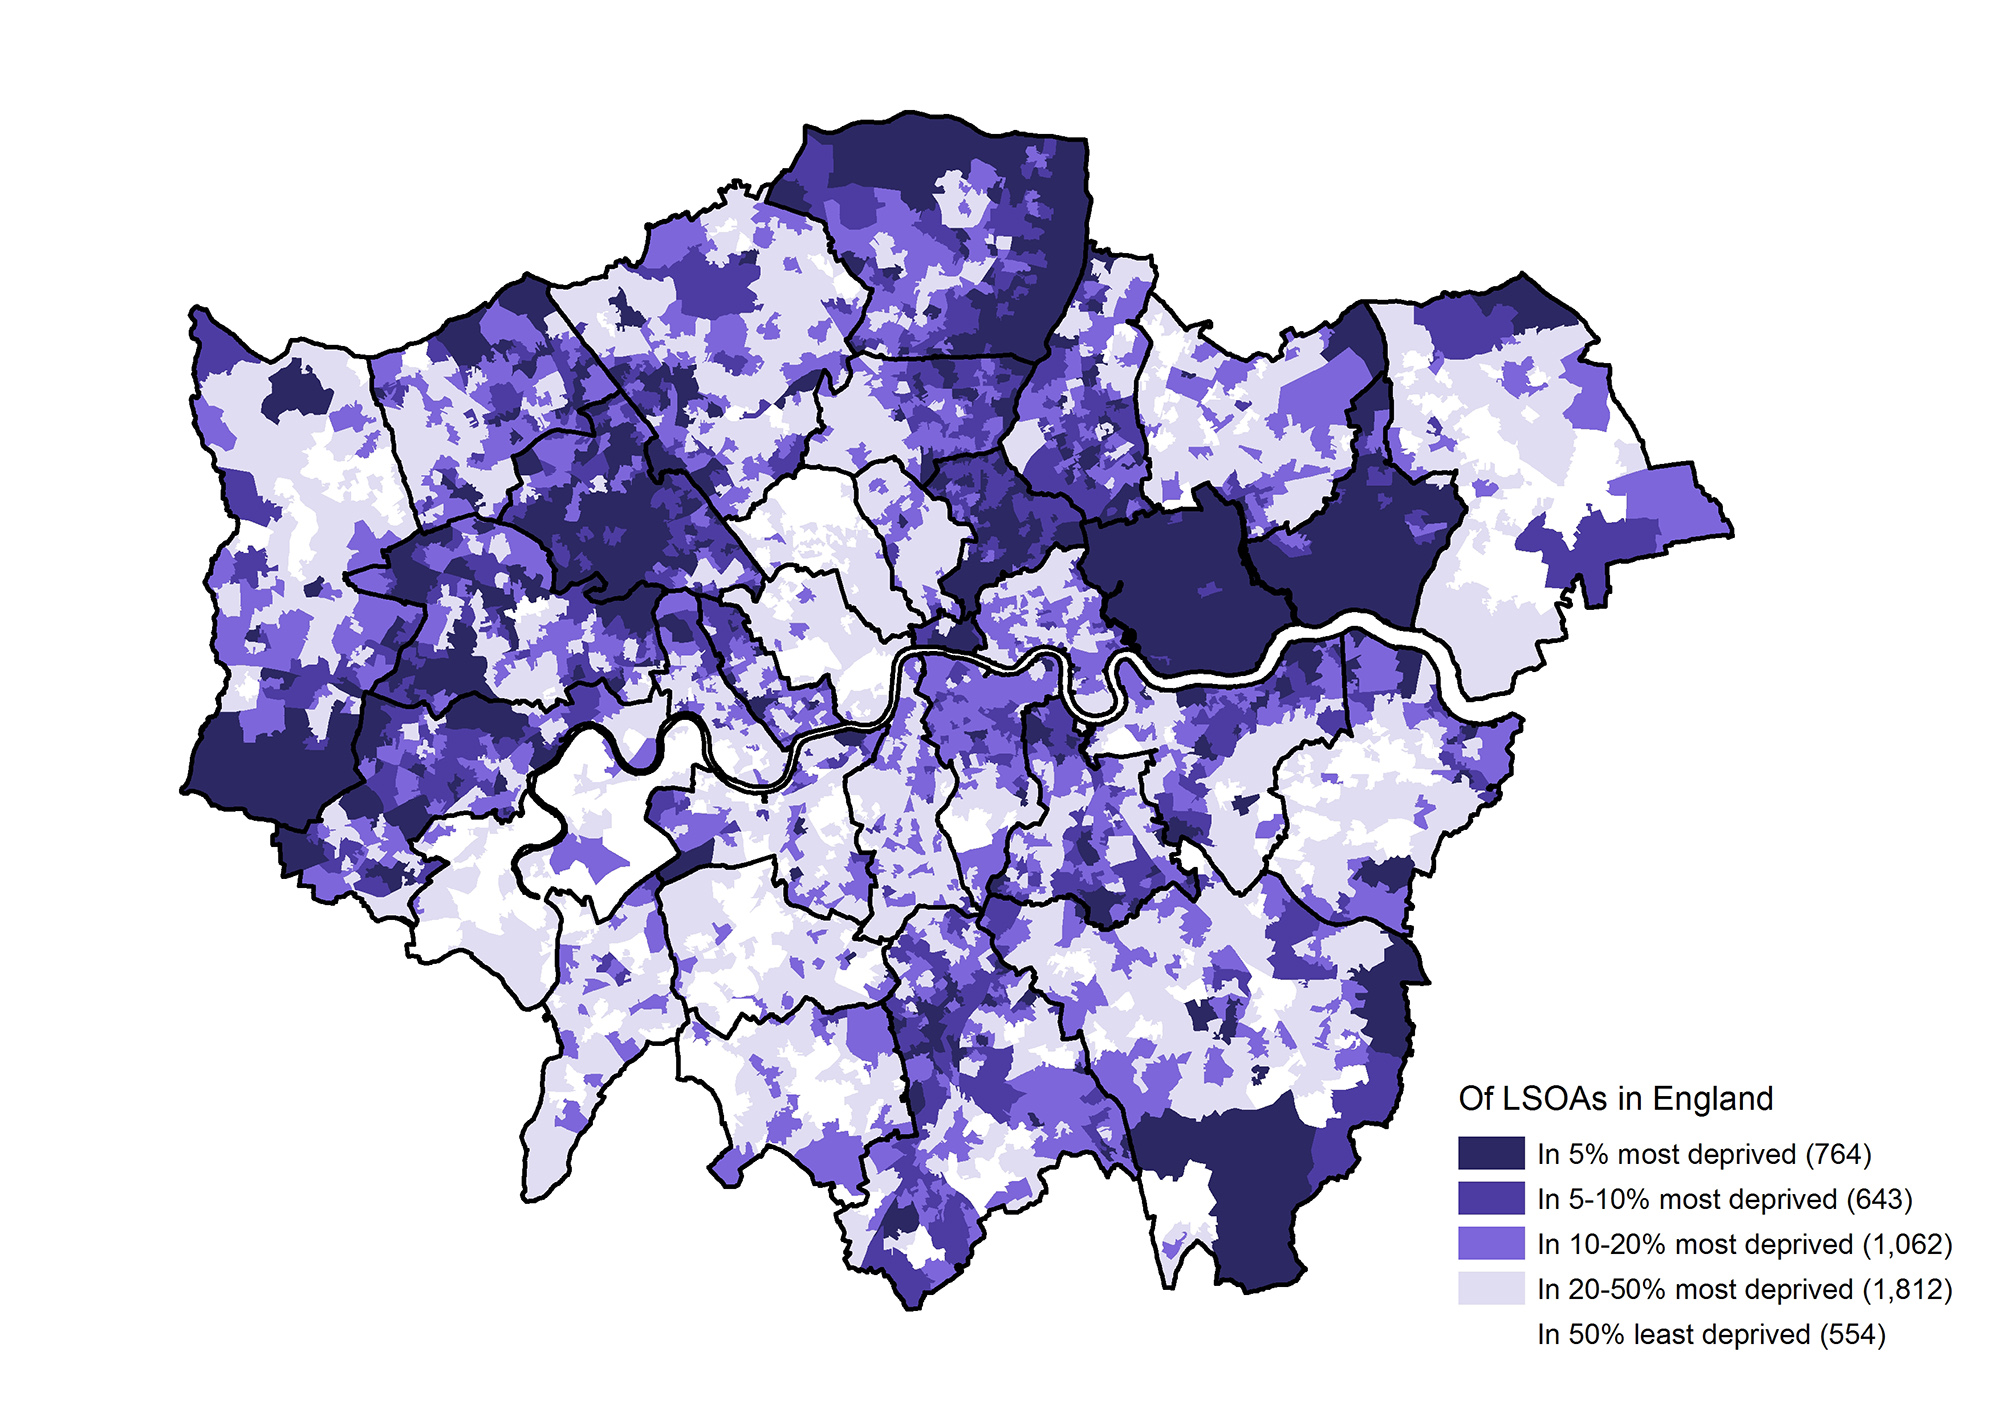
Figure 1 Index of Multiple Deprivation 2019, LSOAs in London
Source: Indices of Deprivation 2019, MHCLG
Figure 1 illustrates the areas with higher levels of deprivation overall
across London showing the familiar pattern of a crescent from the eastern side
of Enfield down through Haringey and Hackney and across into Newham and Barking
and Dagenham. There are additional patches of higher relative deprivation around
Brent/Kensington/Westminster and further pockets, most notably in Ealing, across
the inner south London boroughs and into Croydon. However, the latest IMD
reveals considerably fewer areas of deprivation in Tower Hamlets than were
apparent in the previous IMD (2015), illustrated in Figure 2.
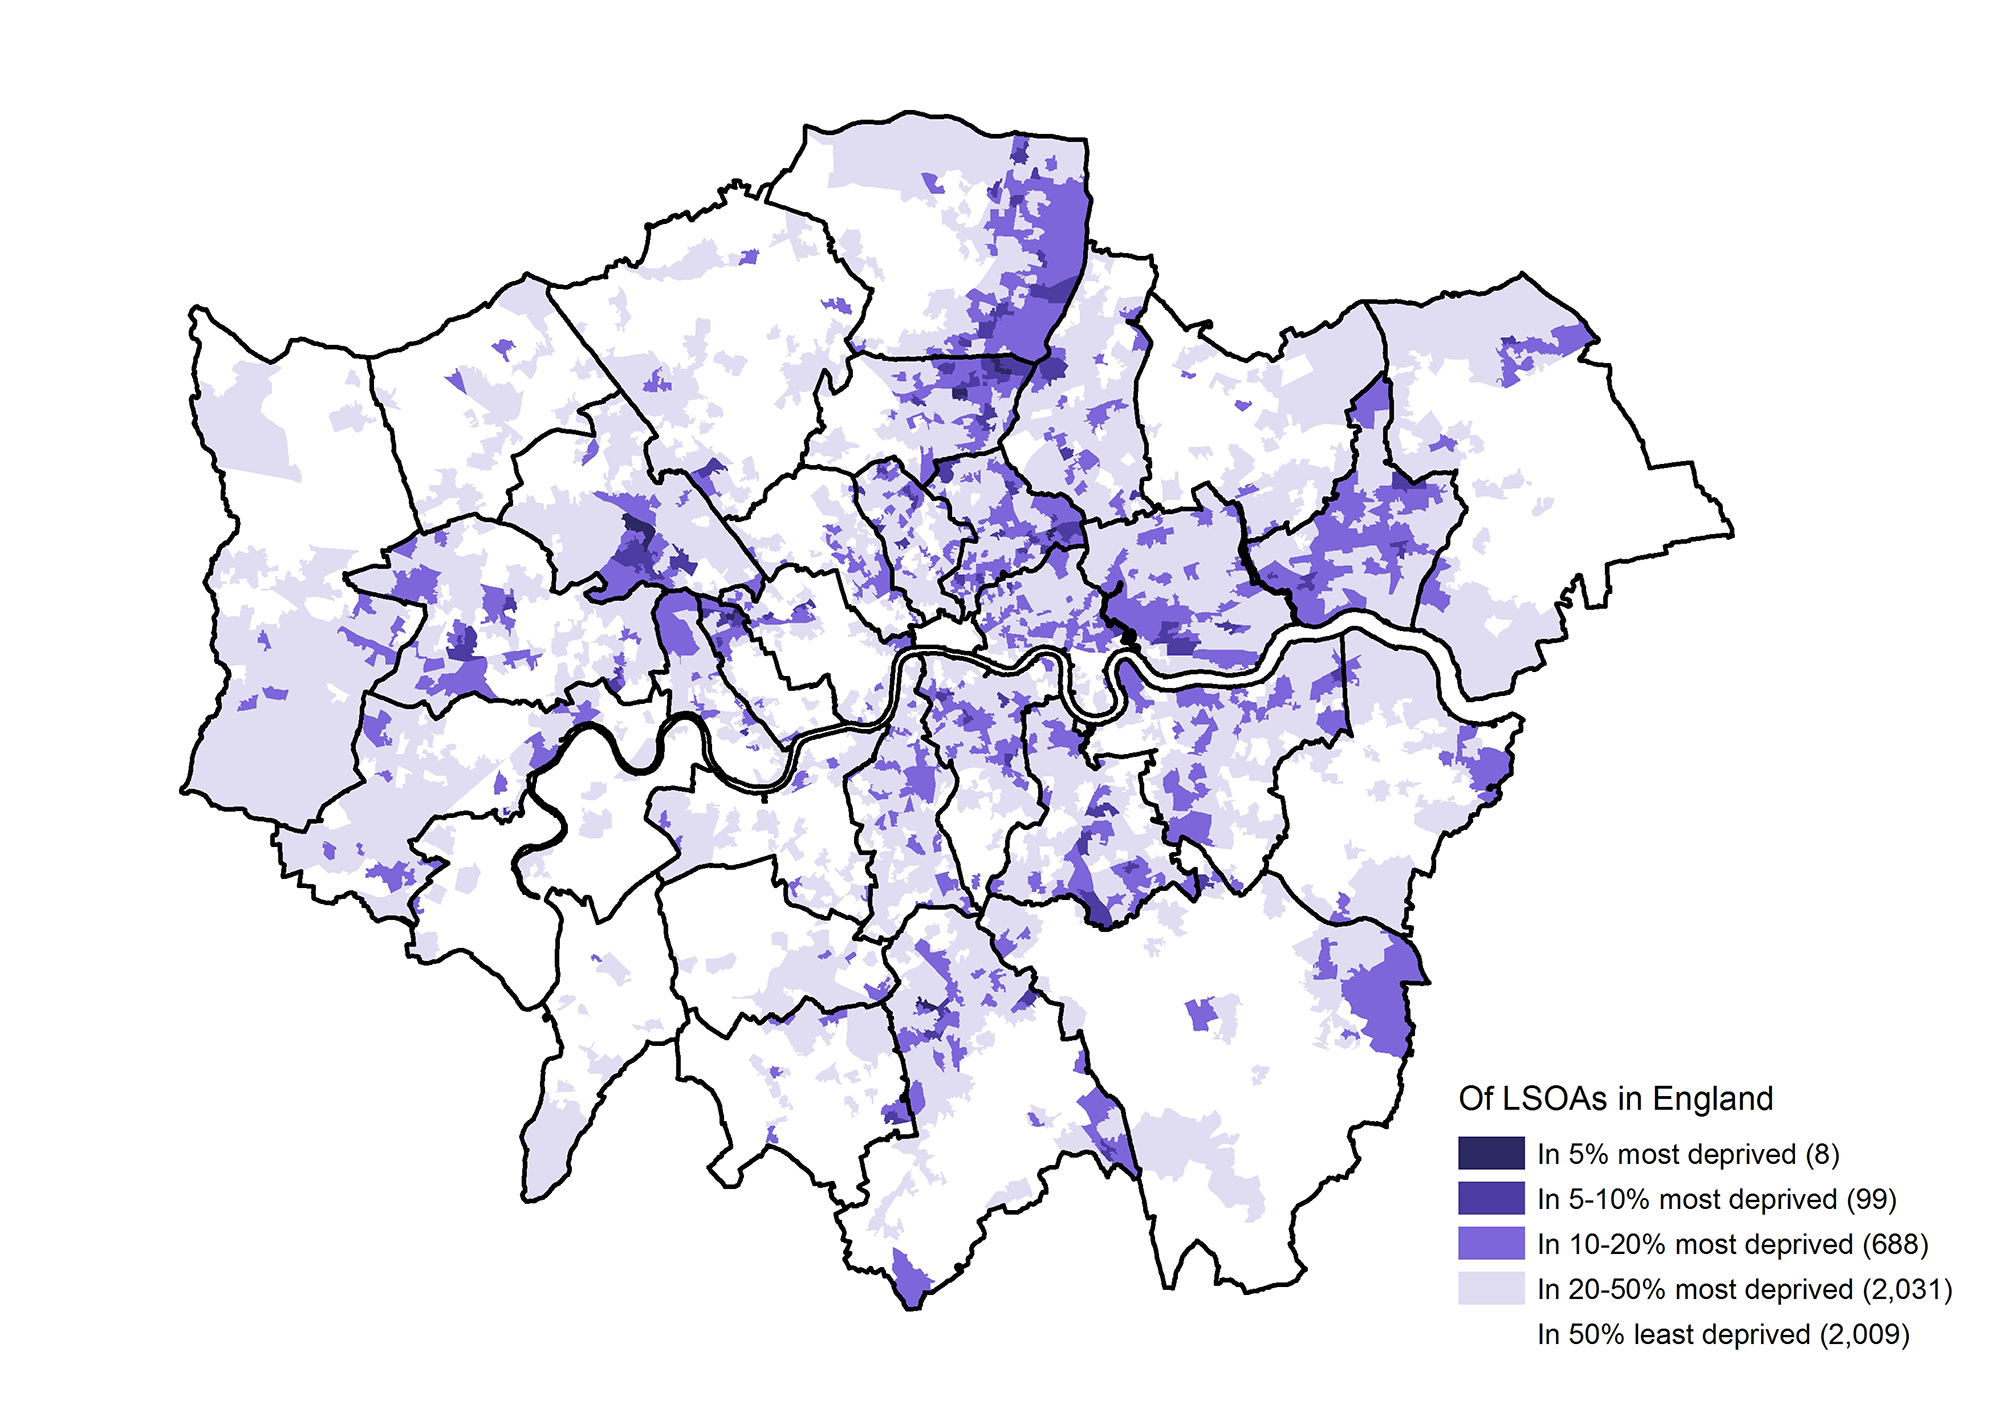
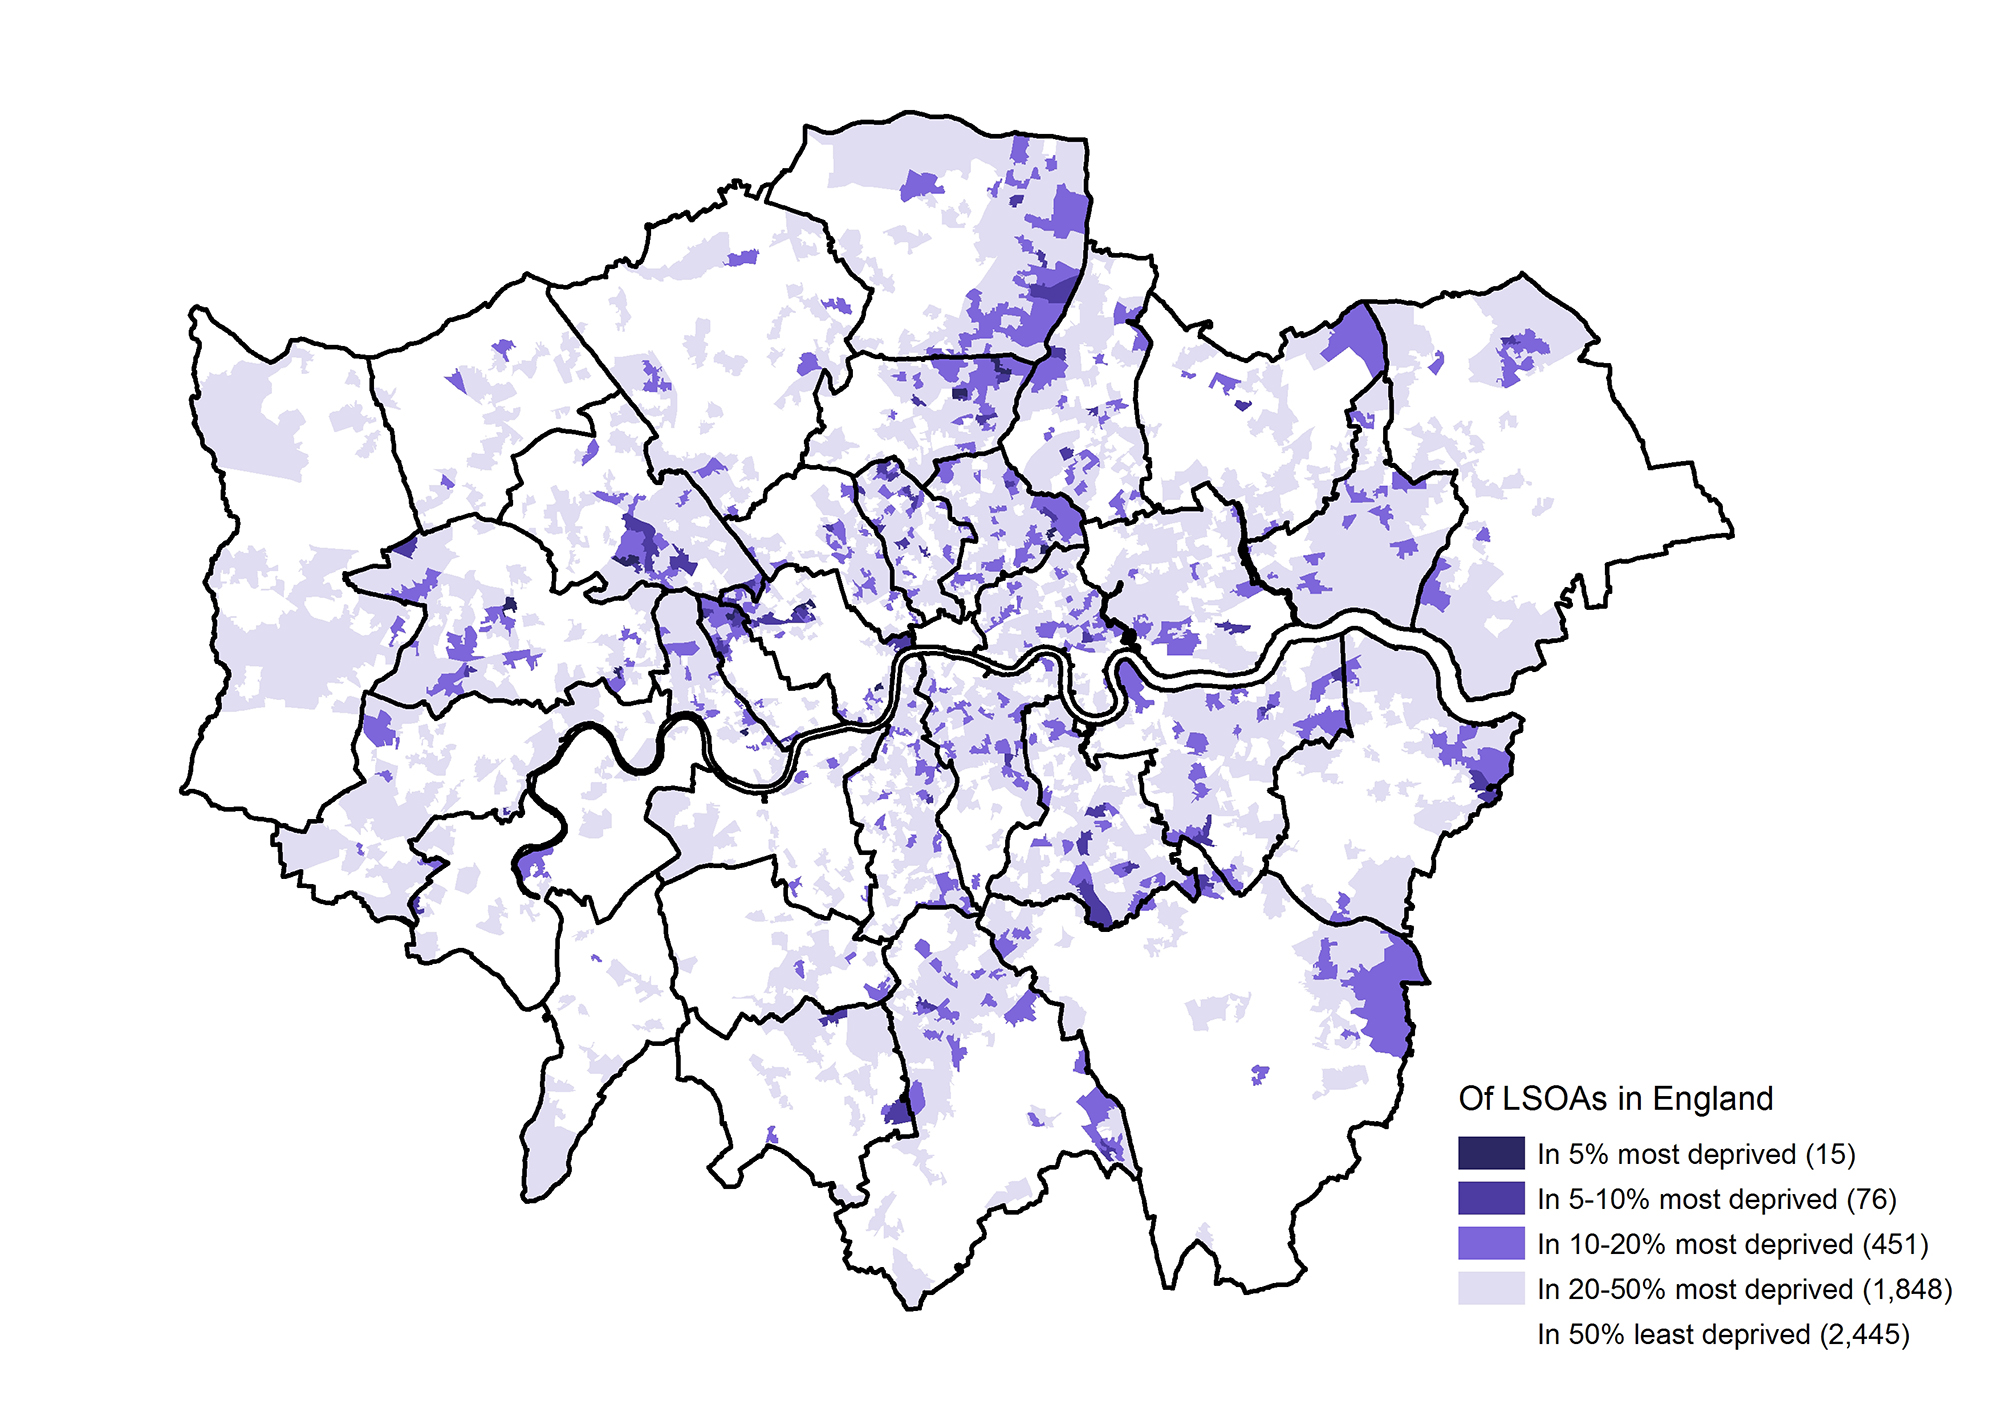
Figure 2 Index of Multiple Deprivation 2015, LSOAs in London
Source: Indices of Deprivation 2015, MHCLG
London has seen a reduction from ID2015 to ID2019 in the number of
boroughs ranked in the top 50 most deprived on each of the summary measures produced
at local authority level, with some paricularly dramatic changes. Tower
Hamlets, for example, has fallen from 24th in terms of the proportion of LSOAs
in the worst 10% nationally to 175th, while Westminster also dropped from 43rd
in terms of the average rank of its LSOAs to 134th. These changes are even more
striking given the fact that the number of local authorities has reduced from
326 to 317.
However, the complexity and multi-dimensional nature of the calculations
mean that the story is far from simple, so while there are no London boroughs
ranked in the top 50 by proportion of LSOAs in the most deprived 10% in the
ID2019, 11 of the 33 boroughs are in the top 50 for the average LSOA rank
within each local authority in England, down from 13 in ID2015.
The chart below shows the distribution of LSOAs within the national
quintiles for each London Borough. Barking and Dagenham had the highest
proportion of LSOAs in the most deprived quintile in England under the 2019 ID
calculations, down marginally from ID2015, but still more than half of its
LSOAs were in this group, whereas the ID2015 also showed more than half of
LSOAs in Tower Hamlets and Hackney were among the most deprived 20% of
neighbourhoods in England. Five boroughs had no LSOAs in the least deprived
quintile in ID2019 – Barking and Dagenham, Brent, Hackney, Islington, Lewisham
and Newham. In contrast, almost two thirds of LSOAs in Richmond-upon-Thames
ranked in the least deprived quintile.
Figure 3 National IMD2019 quintile distribution of LSOAs by London boroughs
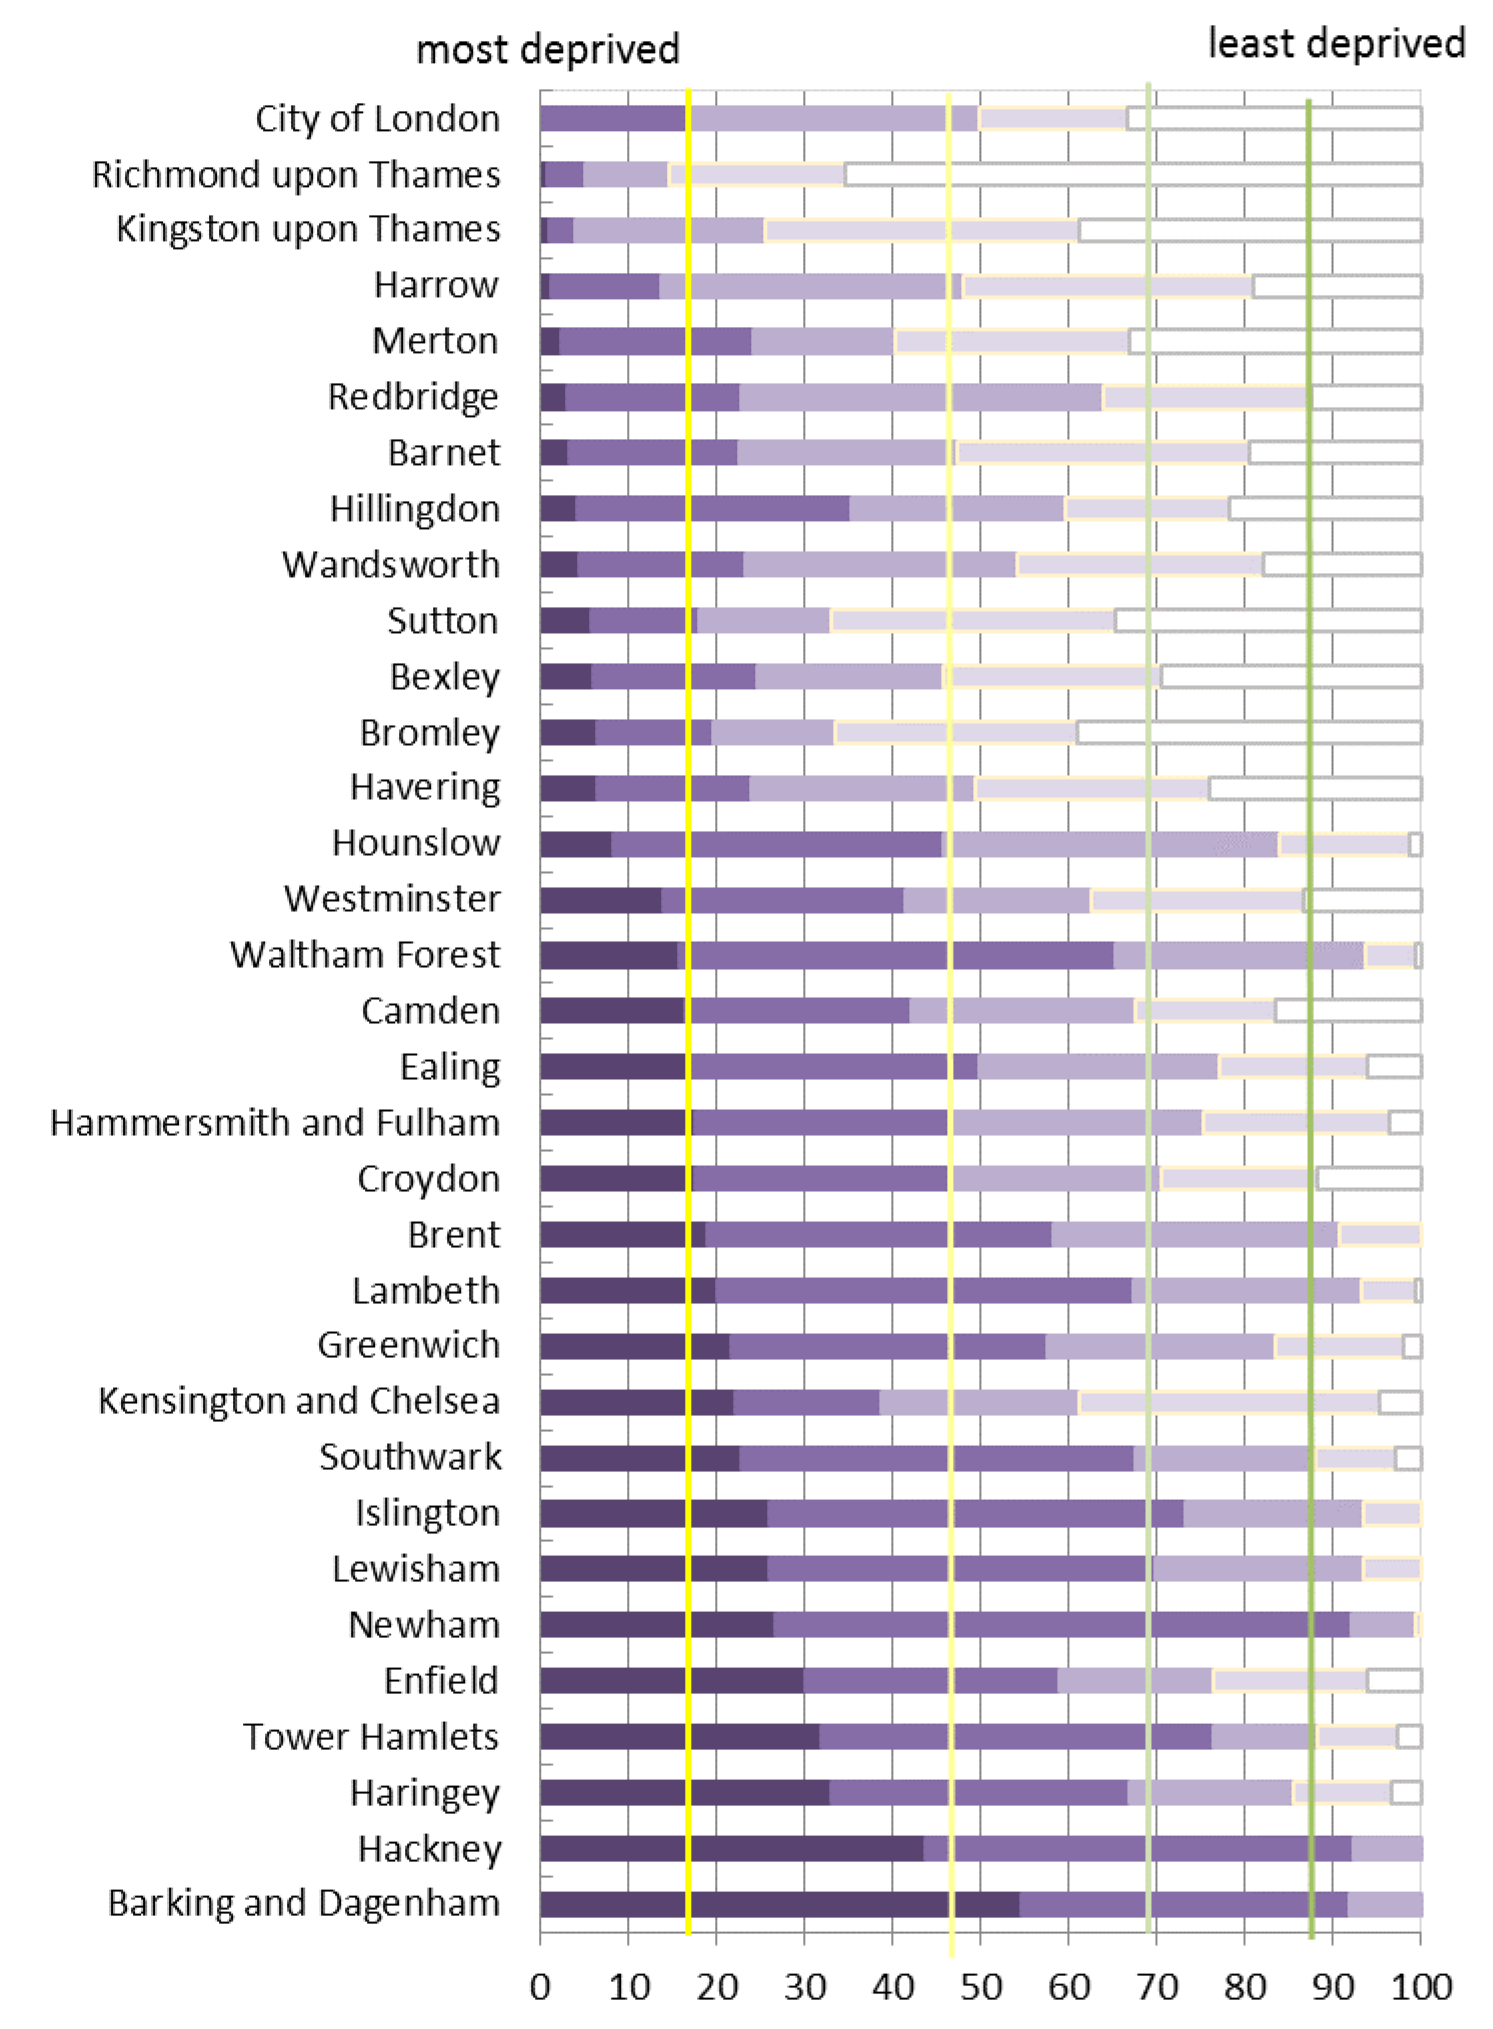
Coloured vertical lines represent overall London picture
Source: Indices of Deprivation 2019, MHCLG
The two supplementary Indices of Deprivation, the Income Deprivation
Affecting Children Index (IDACI) and the Income Deprivation Affecting Older
People Index (IDAOPI) illustrated below show broadly similar patterns to the overall
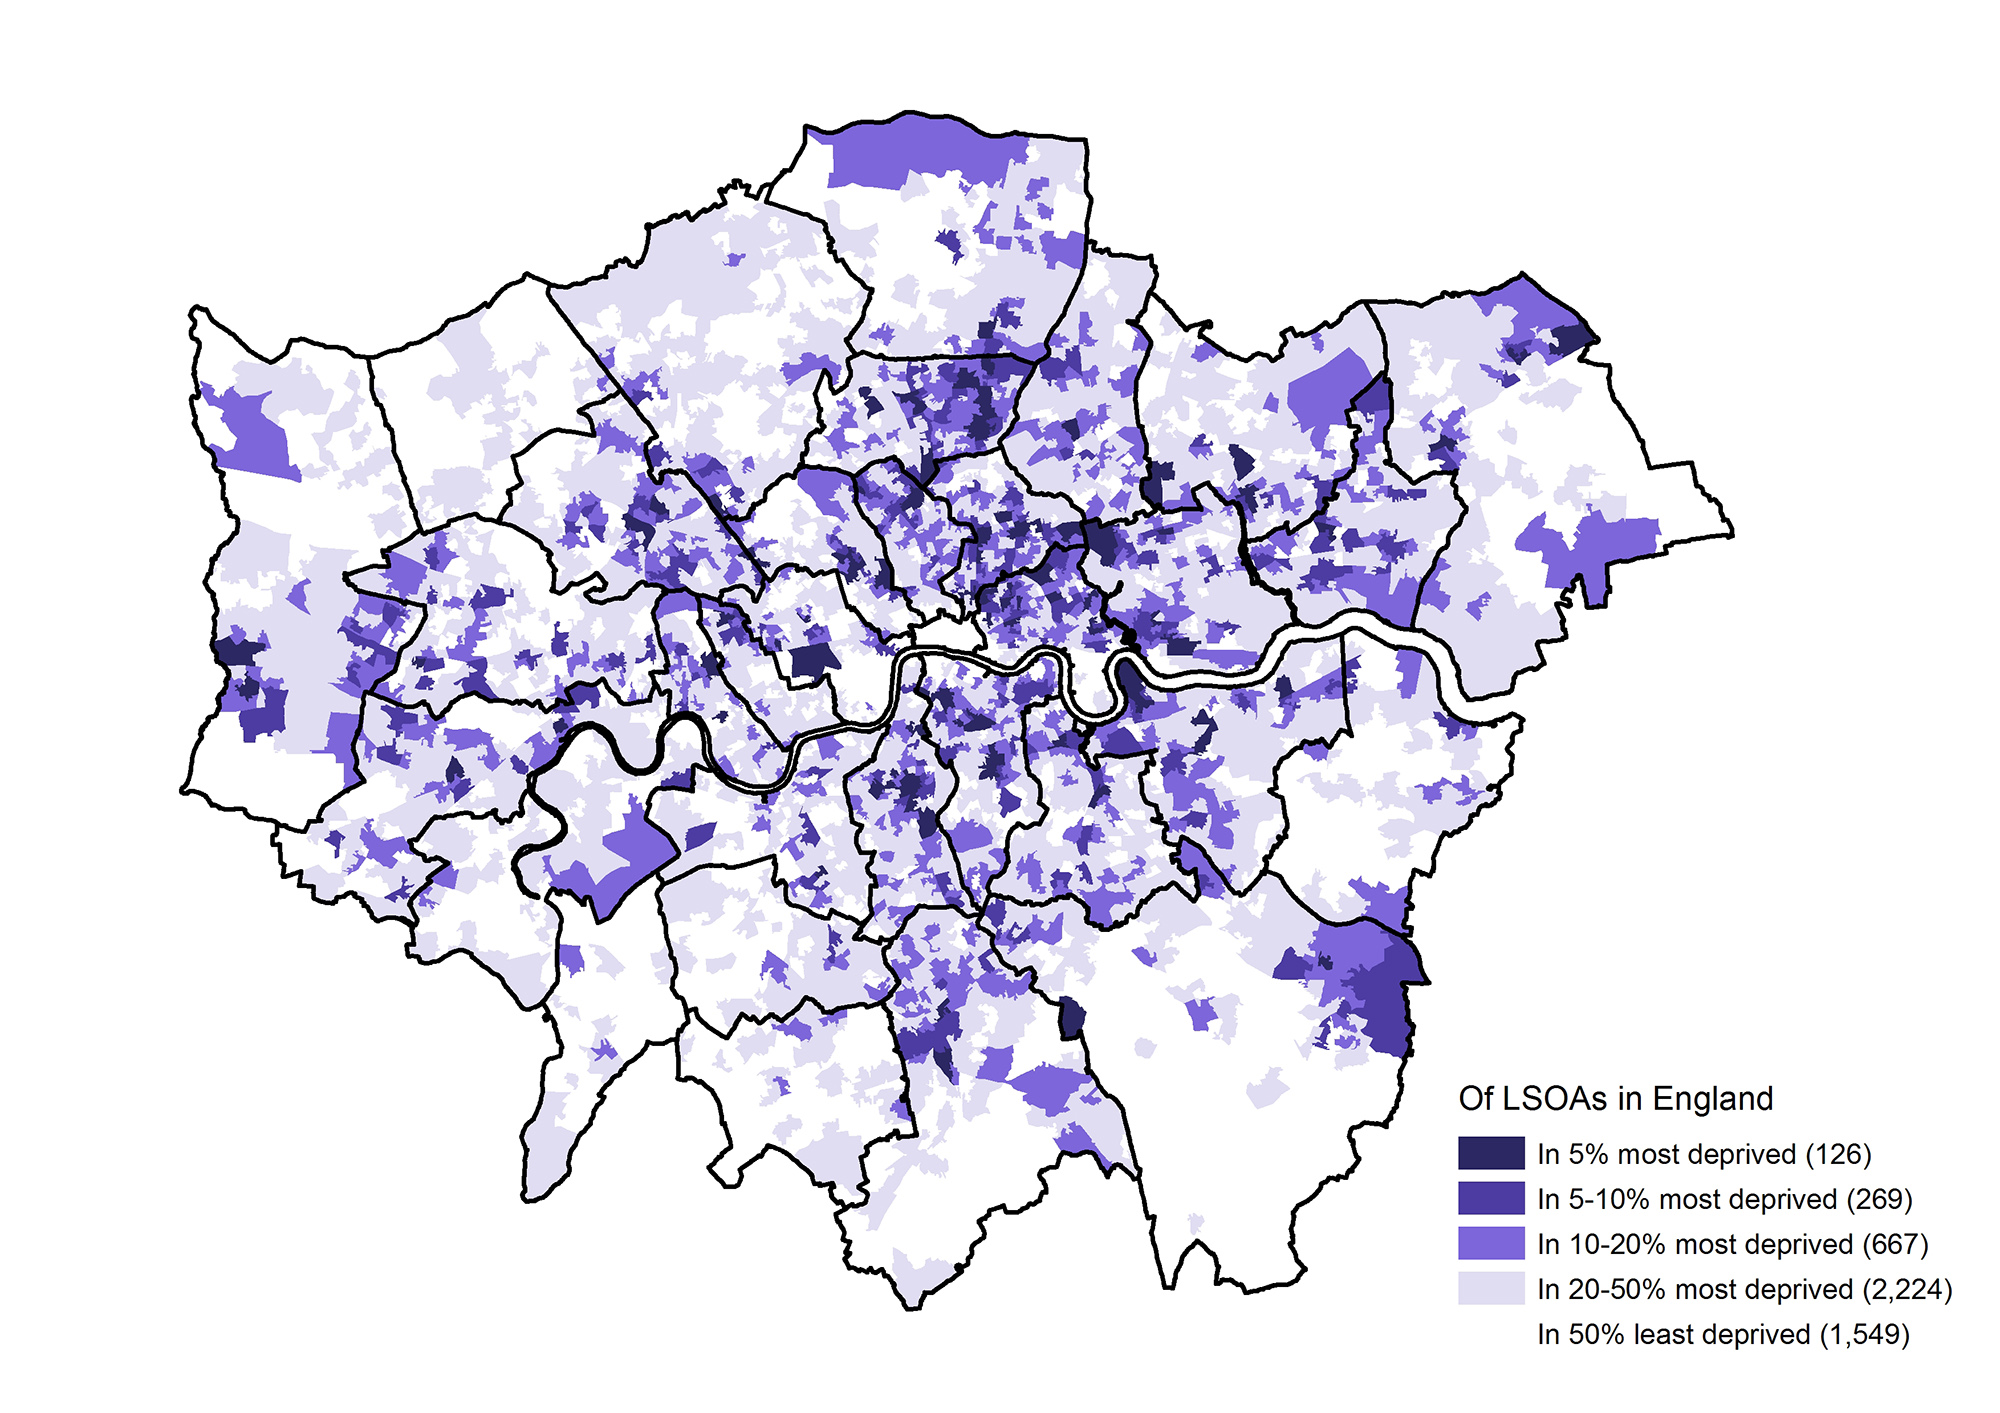
IMD for 2019. The IDACI clearly has more deprived areas than the overall IMD
and more in the most deprived category. However, there is considerable
improvement apparent over the IDACI2015, when there were 234 London LSOAs among
the most deprived 5% in England. The three LSOAs with the highest proportions
of children affected by income deprivation in 2015 (over 60 per cent) have all
seen a significant fall in that proportion, while the number of children living
in these areas is estimated to have increased substantially[1].
Figure 4 Income Deprivation Affecting Children Index 2019, LSOAs in London
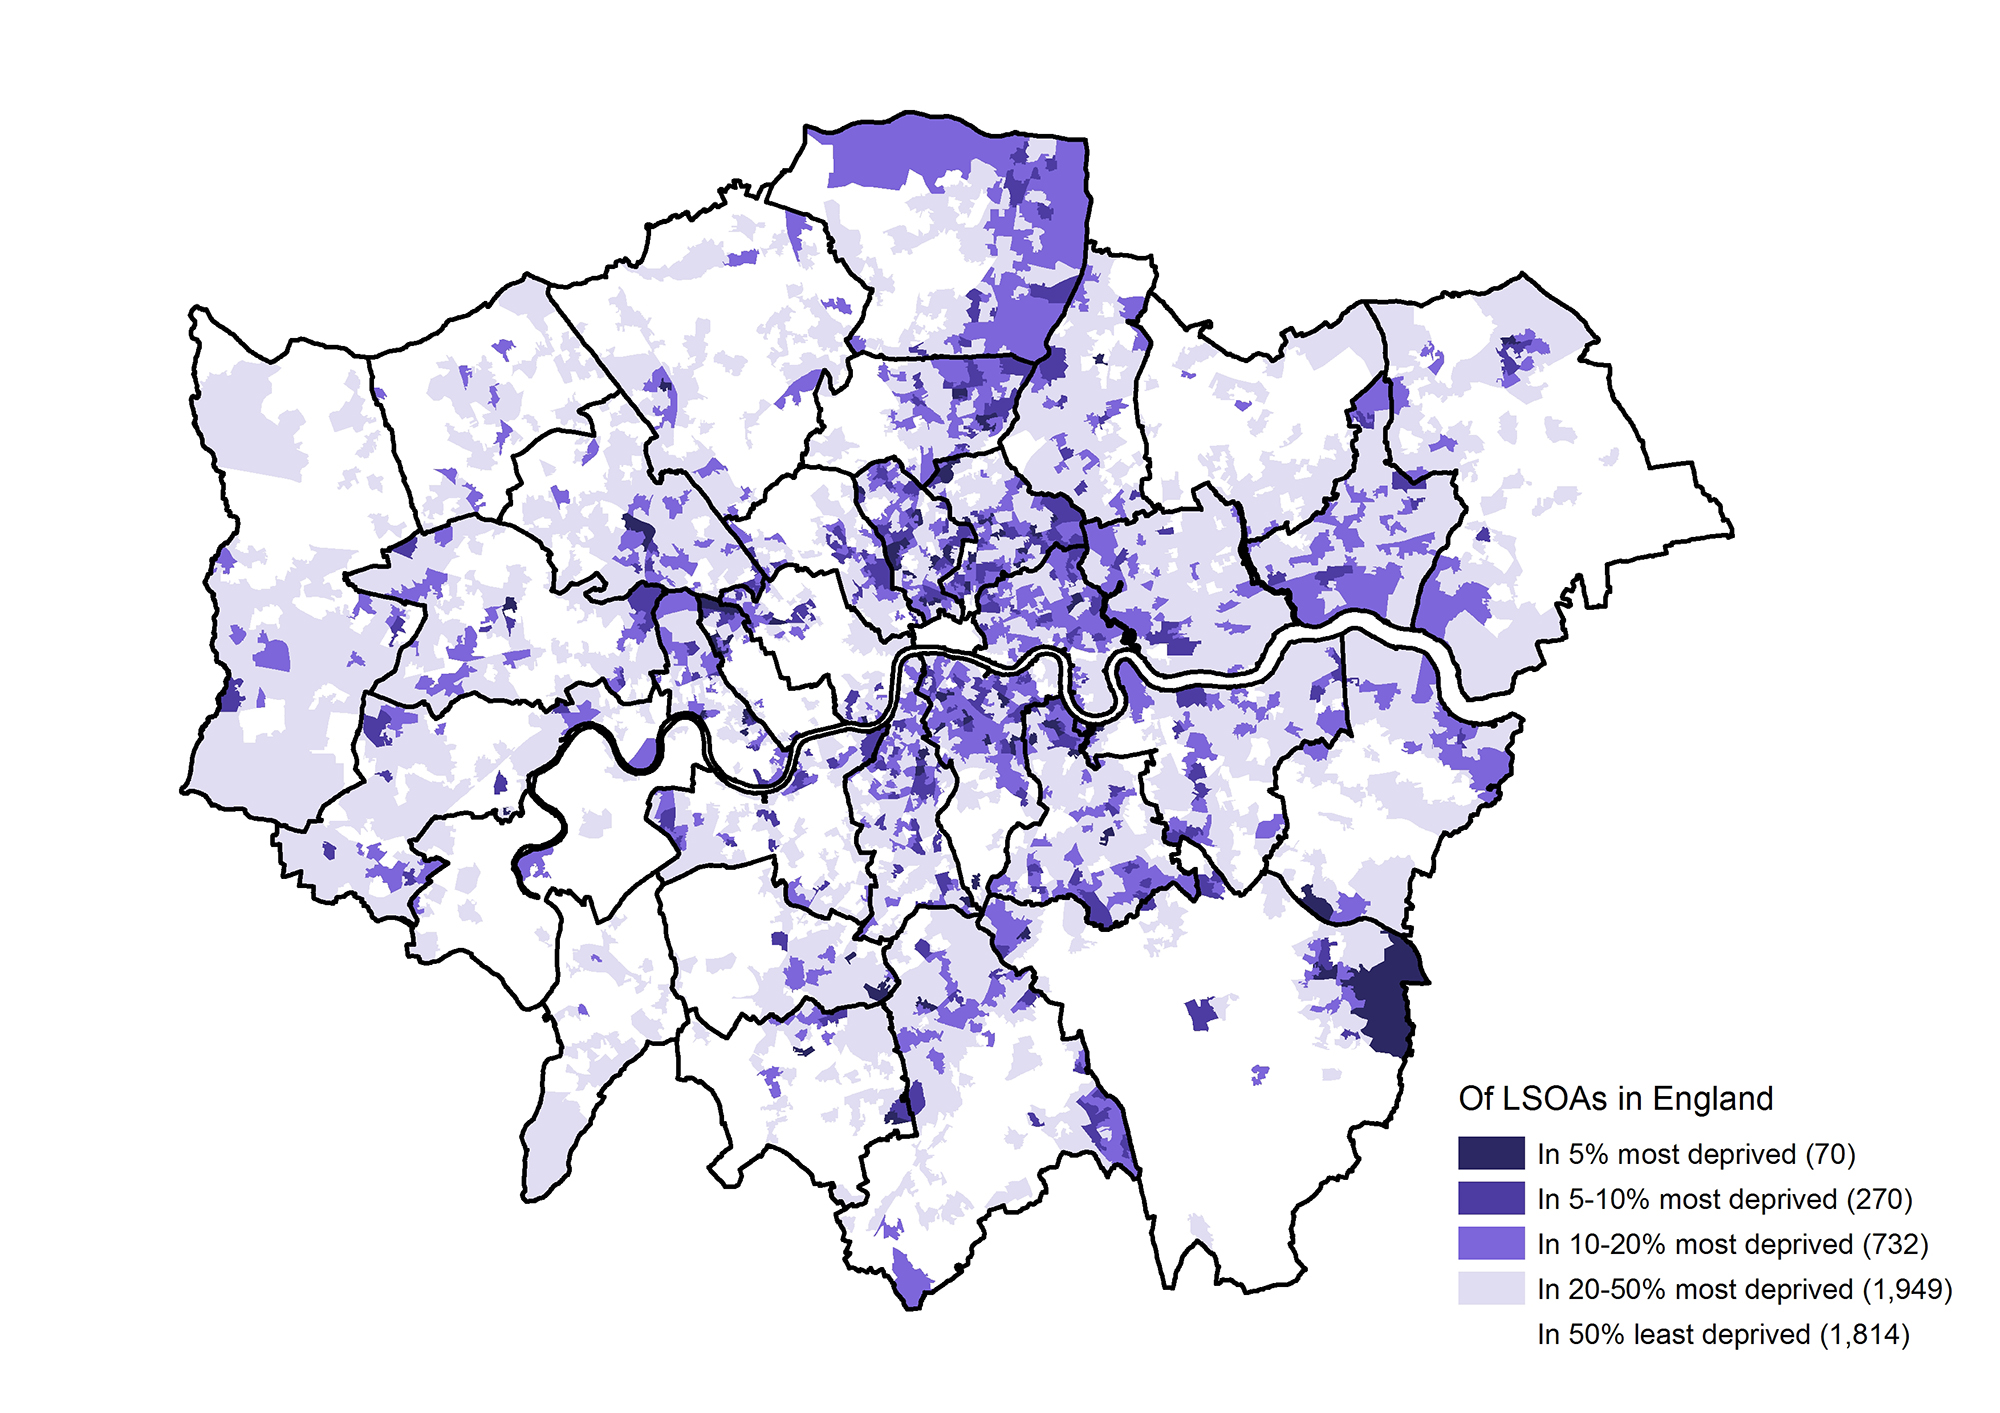
Source: Indices of Deprivation 2019, MHCLG
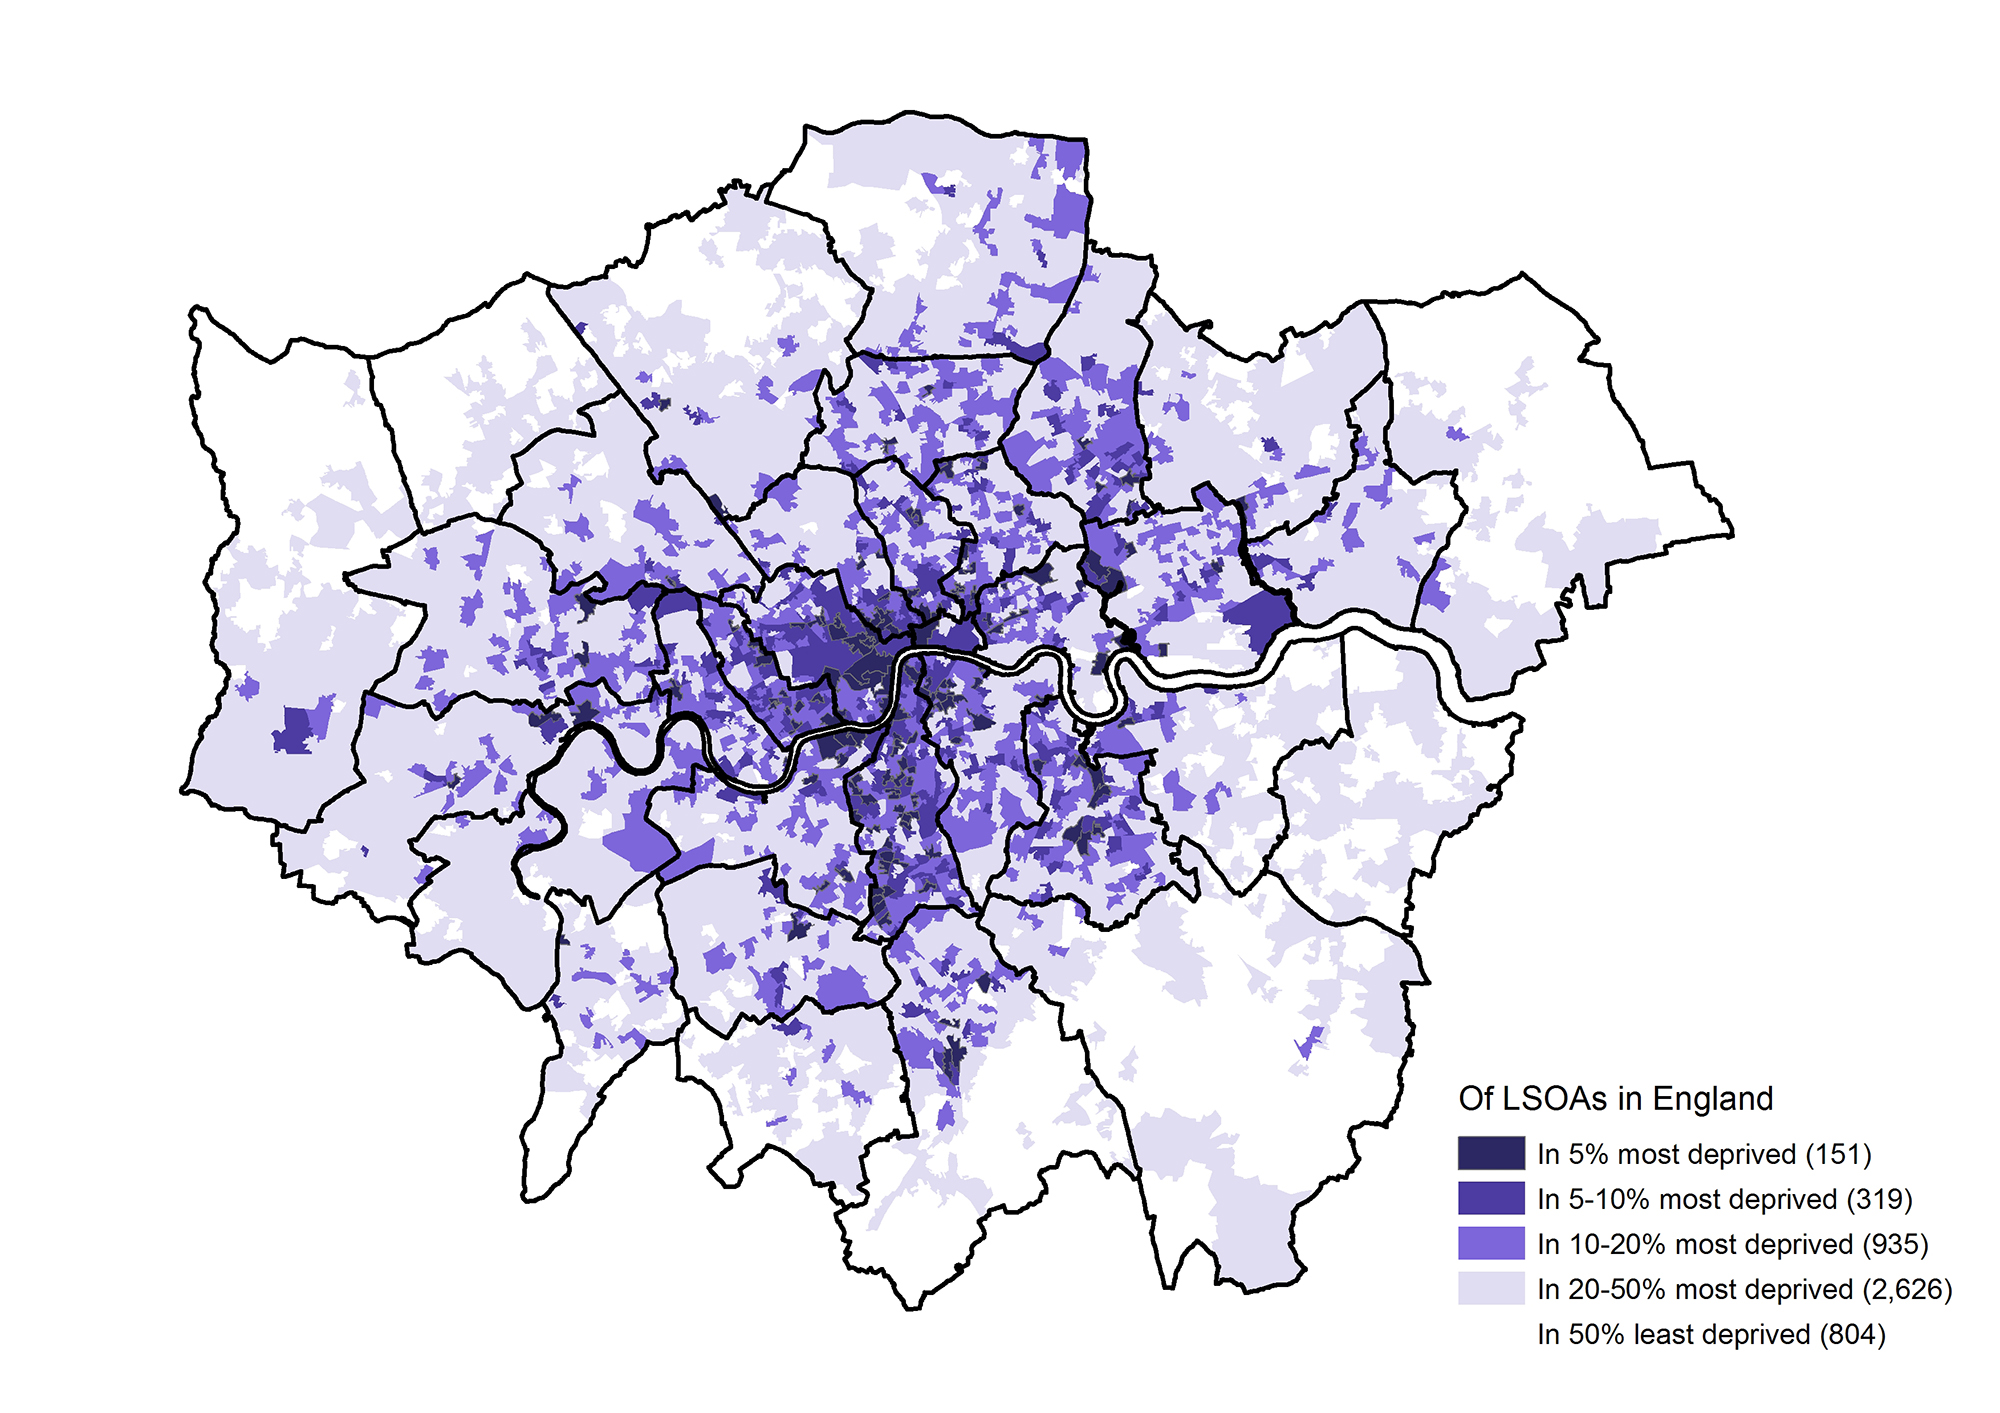
The IDAOPI shows much higher levels of income deprivation among London’s
pension-age population, with 11 per cent of LSOAs among the most deprived 5% in
England on this index. The difference is most clearly visible in LSOAs across
Hackney, Tower Hamlets and Newham. Seven of the ten local authority
districts with the highest levels of income deprivation among older people are
in London. This is unchanged from the ID2015.
Figure 5 Income Deprivation Affecting Older People Index 2019, LSOAs in London
Source: Indices of Deprivation 2019, MHCLG
The seven domains that make up the IMD2019 are the same as
those used for the previous index, though there have been some changes in the
underlying indicators, such as incorporating data for Universal Credit
claimants and their families[2].
The domains show very different patterns of deprivation
across London. While the overall income deprivation domain is similar to the
overall IMD, the employment deprivation domain, illustrated in Figure 6,
reflects the low levels of unemployment and work-limiting disability in London
and a further improvement in this domain since 2015.
In IMD 2015, the Education Skills and Training Deprivation
domain showed how London is doing well in this respect. Further improvement
means that there are no LSOAs at all in London falling in the most deprived 5%
in England, while there are just 12 in the most deprived 10%. More than two
thirds of London LSOAs have below average deprivation in this domain. The
proportions of London LSOAs in the Health Deprivation and Disability domain
falling into each band are similar to those for the Education, Skills and
Training Deprivation domain, though the pattern of distribution is different,
with inner London areas more likely to show deprivation in health and
disability while outer London areas were more likely to show deprivation in terms
of education, skills and training.
Figure 6 Employment Deprivation Domain 2019, LSOAs in London
Source: Indices of Deprivation 2019, MHCLG
The Crime domain from IMD2019 (see Figure 7) shows a very
different pattern, with much more widespread deprivation, though again improved
from IMD2015. The IMD2019 records fewer London LSOAs with the highest levels of
crime, while also fewer areas in London with below average levels. Similarly,
London has fewer areas in IMD2019 than in 2015 with the highest levels of
deprivation on the Living Environment domain, incorporating measures of air
quality and road traffic accidents along with housing conditions. Though the
pattern, illustrated in Figure 8, was very different, with deprivation on this
domain heavily concentrated in inner, particularly central, London areas.
The Barriers to Housing and Services Domain is the only one
of the seven domains making up the IMD2019 that shows relatively more
deprivation in London LSOAs compared with IMD2015, and even then, it revealed
more deprivation in this respect than any other domain. Two boroughs that
appear to have bucked this trend are Westminster and Tower Hamlets, with
neither area containing LSOAs in IMD2019 among the most deprived 10% in
England, whereas almost all of Newham falls into the most deprived 5% (see
Figure 9).
Figure 7 Crime Domain 2019, LSOAs in London
Source: Indices of Deprivation 2019, MHCLG
Figure 8 Living Environment Domain 2019, LSOAs in London
Source: Indices of Deprivation 2019, MHCLG
Figure 9 Barriers to Housing and Services Domain 2019, LSOAs in London
Source: Indices of Deprivation 2019, MHCLG
The Barriers to Housing and Services Domain incorporates
indicators of distance to various essential services, homelessness, housing
affordability and overcrowding.
All maps produced are © Crown
Copyright and database right 2019 Ordnance Survey 100032216 GLA
[1]
The population estimates used for this calculation are the ONS 2015 mid-year
population estimates less prison population. GLA analysis suggests that there
is some over estimation of net international inflow of children, particularly
affecting some inner London Boroughs. This has the effect of reducing the IDACI
score in the affected areas.
[2]
Universal Credit started to be rolled out in 2013, so was not incorporated into
the ID2015. Roll out has covered population groups in different parts of the
country at different times. The initial roll-out, completed by April 2016
mainly covered claimants without dependants. Most of the figures incorporated
into the IMD2019 therefore include children and partners under the old benefit
system.