
A Summary of the Skills Evidence Base 2018
GLA Economics recently published an Evidence Base[1] about skills in London, to support the Mayor’s new skills and adult education strategy[2]. This strategy sets out policies relating to further education and technical skills. The GLA will also soon consult on implementation plans for the newly-devolved Adult Education Budget (AEB), worth around £300m per year. See the Box below for information about the context for the Evidence Base, and the key policies in the Mayor’s new strategy.
‘Skills’ is a broad topic, and the Evidence Base reflects this. It includes analysis of skills demand and supply, inequalities, employer training, and various issues relating to the education and training system. This supplement picks out some of the main findings.
Box: policy context for the Skills Evidence Base
In June the Mayor launched ‘Skills for Londoners’, a strategy for skills in London. This is the first such strategy. The strategy sets three aims: improving opportunities for Londoners by expanding access to education and skills, meeting the needs of London’s economy and employers, and delivering a ‘strategic’ city-wide technical skills and adult education offer.
Its key policy measures are:
- £88m for capital spending on post-16 education
- A new ‘Construction Academy’,
- Improvements to careers information and advice in London, including a new skills and employment ‘knowledge hub’.
- Work with businesses – Mayor to create an ‘occupational skills board’ to advise on meeting London skill needs.
One reason for the strategy is that London, along with England’s eight Mayoral Combined Authorities, will soon have greater powers relating to skills, with devolution of the Adult Education Budget (AEB). This budget is worth around £300m per year in London, which from 2019/20 will be administered by the GLA. The strategy will be followed by the Skills for Londoners framework, which will consult on implementation plans for the AEB, as well as other skills-related budgets (including European Social Fund money and the new skills capital fund). The framework is expected to include more information on the following priorities:
- The move towards outcomes-based commissioning
- Basic English, maths and digital skills
- English for Speakers of Other Languages
- Support for learners with Special Educational Needs and Disabilities (SEND)
How do we measure skills?
‘Skills’ is a well-understood term with a clear common sense meaning, and a formal definition is not really necessary[3]. A more interesting question is how skills are measured. Importantly, it is often not possible to ‘directly’ measure a person’s skills, since this requires an assessment of proficiency. Some data sources do this, such as the OECD’s Adult Skills Survey, which in 2012 assessed adults’ proficiency in numeracy, literacy, and problem solving. However, such sources are limited, and skills are most often measured through a proxy – qualifications. Specifically, a person’s highest qualification level (GCSE, A-Level, Degree, etc.) is taken as a proxy for their skill level. However, using qualifications as a proxy has problems. One is that people continue to develop skills after leaving formal education, through experience in and outside work. They are also a narrow measure, missing important work-related skills like communication, management, and so on.
In some ways, the data on skill demand is better. We can use jobs data to measure labour demand, and can break these down by detailed occupations and sectors. Since occupations can be understood in terms of their skill requirements, this tells us about skill demand. Furthermore, we can also use employer surveys, and data on vacancies, to learn about the sectors and occupations in which there are skill shortages.
Why are skills important?
The first two aims in the skills strategy – empowering Londoners to access the education and skills to participate in society and progress in education and in work, and meeting the needs of the London economy and London employers – do a good job of reflecting why skills are important. Briefly, skills are important because they are linked to labour market and social outcomes for individuals, and because, at the level of employers and, in aggregate, the economy, skills are a driver of productivity and output.
The Evidence Base refers to some of the literature showing these relationships. For example, research suggests that improvements in skill levels explain a fifth of productivity gains in the UK in the run up to the recession. In terms of individual outcomes, there are associations between skills and individual outcomes – for example, people with higher level qualifications have greater employment rates, higher earnings, and also better health outcomes. However, these relationships also appear to hold when controlling for outside factors, such as an individual’s background. Vocational qualifications and degrees alike have been shown to increase individual earnings compared to similar people with lower level qualifications.
Skills demand and supply
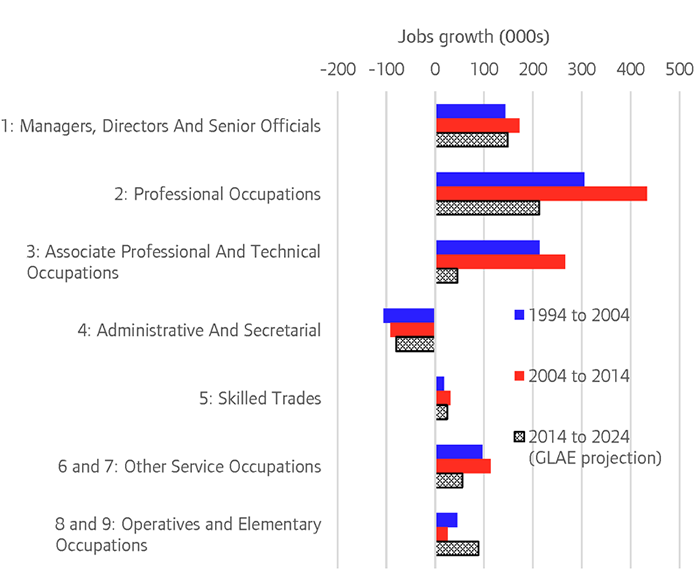
The demand for skills in London has increased substantially in recent decades, both in terms of the total quantity of labour demanded, but also in terms of the skill profile of labour demand. There are currently 5.9 million jobs in London, up from 4.1 million 30 years ago, an increase of 84,000 jobs per year. This jobs growth has been concentrated in the higher-level occupations (in terms of skill requirements and earnings). Between 1994 and 2014 London saw 1.5 million additional jobs in the top three occupation groups top three occupation groups (managers, directors and senior officials, and professional and ‘associate professional’ occupations), compared to 130,000 in all other occupation groups (see Figure A1 below). This translates into higher demand for people with higher level skills. Between 2004 and 2014, London saw an additional demand for 1.1 million jobs with degree level qualifications, including 340,000 people with higher degrees.
Figure A1: jobs growth in London (recent and projected) by occupation level
As demand for skills has increased, so has supply, again both in terms of quantity (London’s population grew by 1.2 million between 2007 and 2017) and level. The proportion of prime working age London residents (age 25-64) with a degree-level qualification (NVQ Level 4+) increased from 36% in 2004 to 56% in 2017. This compares to 40% in the rest of the UK. Indeed, London is more highly qualified not just than the rest of the UK, but than the rest of Europe. Figure A2 below shows all the ‘NUTS 2’ regions[4] in the European Union, of which there are five in London, and thirty-five in the rest of the UK. London’s five regions rank first, second, third, fourth and eighth across the whole of Europe in the proportion of working age residents with tertiary-level education[5].
Figure A2: qualification level of working age residents in ‘NUTS 2’ areas in Europe, 2016

Are demand and supply in balance?
The headline trends appear to suggest that demand for and supply of skills in London have grown side by side. Furthermore, both are relatively weighted towards higher level skills than elsewhere. But that does not quite tell us whether demand and supply and in balance. Supply could be ‘high’ compared to elsewhere, as it is, but still not ‘high’ enough relative to demand. That would lead to a skills shortage, potentially with negative implications for employers and the London economy.
The best measure we have to answer that question is from the Employer Skills Survey, formerly produced by UKCES, and now by the Department for Education. In 2015 (the latest survey round available) there were 196,000 workers considered by their employers to lack proficiency. There were a further 42,000 vacancies that employers struggled to fill due to the availability of appropriate skills. Taking these together suggests that London faces a skill shortage of around a quarter of a million people – a significant problem. However, due to the size of London’s labour market, this shortage amounts to only 5.3% of overall labour demand, suggesting that for the most part demand for skill is met adequately by supply.
Therefore, supply does indeed appear to have kept pace with demand. Compared to many other parts of the UK, where one or both of demand or supply of skills may be ‘low’, London has been described as being in a ‘high skills equilibrium’[6]. It is also worth noting that the ‘balance’ of demand and supply is not just about supply meeting demand, although this is what employers will be most interested in. The opposite may also matter. In fact, the Employer Skills Survey suggests that the number of people whose skills are at a higher level than required by their job (‘over-skilled’) is about twice the number whose skills are lacking. Therefore, in London a lack of demand for high level skills may be a more significant problem than a lack of supply, in terms of the balance of supply and demand.
However, although skills demand and supply appear, in aggregate, to be roughly in balance, there may still be particular sectors and occupations facing problems. Two such sectors in London are Construction, and Accommodation and food services because in both around a third of workers are from the European Economic Area, meaning both are vulnerable to changes to the immigration system post-Brexit. Construction is also, strategically, a highly important sector in London given the Mayor’s housebuilding commitments, and has received specific attention in the Skills Strategy, with the creation of a new ‘Construction Skills Academy’.
Employer training
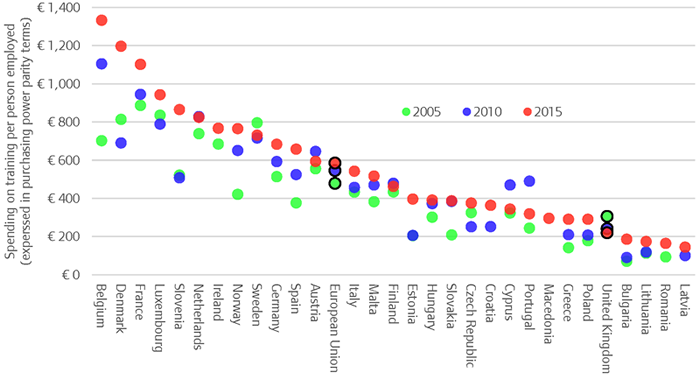
Another topic covered in the Evidence Base is employers’ role in the skill system, and specifically in contributing to the cost of skill acquisition by investing in the skills of their employees. The facts here are stark. In 2015, UK employers spent €220 on training per person employed. This compares to €585 across the EU as a whole. In the highest-investing countries employers spend around six times more than UK employers[7]. It is also notable that investment levels in the UK went down between 2005 and 2015, unlike almost every other EU country. See Figure A3 below.
Figure A3: employer investment in training in European countries, 2005, 2010 and 2015
The Evidence Base used the Labour Force Survey to measure levels of employer investment in London and the rest of the UK. The measures available are the proportion of workers that have recently received training, and the number of hours of training received. This data suggests that employer investment in training in London is similar to the rest of the UK, but that investment has fallen in both. In London the number of training hours per person employed fell by 72% between 1997 and 2017, slightly above the 65% fall in the rest of the UK.
What explains such low (by comparison to the rest of Europe) and falling (compared to two decades ago) employer training? One reason sometimes suggested is that employers are worried about free-riding. Workers can leave their employer after training, meaning the employer loses their investment. However, the evidence does not bear this out. Employers that are asked why they do not train their staff hardly ever mention concern about their staff being ‘poached’ by other employers. Furthermore, this would not explain falling investment over time[8].
Instead, the better explanation seems to be that training levels are low because employers don’t see a need to invest. This is what emerges from the Employer Skills Survey. But this is also implied in the demand and supply data above. If, as the data suggests, London is in a ‘high skills equilibrium’, with supply meeting demand, then employers have little need to spend resources on training.[9] Given that skill supply has increased in recent decades (with, for example, a greater proportion of people going to university) while employer investment has fallen, this suggests that the cost of skills acquisition have increasingly fallen on the state, and individuals, and less on employers. Concerns over employer investment in skills have come to the fore recently, and are one reason behind the new Apprenticeship Levy, which essentially forces (large) employers to contribute by imposing a tax.
Other issues covered in the Evidence Base
There is not enough space in this supplement to cover all the material in the Evidence Base. For example, there are sections in the Evidence Base on inequalities in skills outcomes (chapter six), and on the challenges facing the education and training system (chapter nine), which have not been touched on here. Please refer to the Evidence Base (which can be found along with our other publications on our publications page) if you are interested in those topics, as well as for greater detail on the issues discussed in this supplement.
[1] GLA Economics (2018) ‘Skills strategy for Londoners: Evidence Base’
[2] GLA (2018) ‘Skills for Londoners’
[3] If interested, the Evidence Base describes skills as the ability to complete a task, with categorisations referring to the type of task (solving numeric problems, communication, coding, etc.) and to the difficulty of the task (i.e. hard numeric problems versus easy ones).
[4] NUTS 2 areas are statistical regions, each with between 800,000 and 3 million inhabitants.
[5] Note that this paragraph refers to London residents. Of course, commuters also comprise a significant part of London’s labour supply. About 1 in 5 jobs in London are filled by commuters.
[6] Ann Green research for the OECD: Green (2012) ‘Skills for competitiveness: Country Report for United Kingdom’
[7] Note: data is provided in purchasing power parity terms, accounting for differences in prices between countries and over time. This means comparisons between countries are valid.
[8] The UK’s flexible labour market means free-riding might explain some of the difference between the UK and other countries. But as mentioned, very few employers cite this as a reason for low investment.
[9] As above, it should be noted that these London-wide statistics will mask higher training in some specific employers, sectors and occupations.