Labour market update for London – June 2018
London’s employment rate unchanged, but fair jobs growth on the year
Labour market data for the three-month period February to April 2018 was released today, as well as jobs data for the first quarter of 2018. Broadly, the figures suggest little change on the previous quarter, with employment (and unemployment) still at near record highs (lows). London’s employment rate was 74.8%, unchanged on the previous quarter[1], and the unemployment rate was 5.2%, up slightly on the quarter. In the UK as a whole, the employment rate was 75.6%, up slightly on the previous quarter.
The number of jobs in London grew by 1.9% on the previous year, compared to 0.5% in the UK as a whole. London jobs growth was greatest in Administrative and support services, Information and communication, and Health and social work. There were 5.9 million jobs in London in the first quarter of 2018, up 110,000 on the year.
- London’s employment rate (i.e. the proportion of London’s residents aged 16-64 population in employment) in the three months to April 2018 was 74.8%, unchanged on the quarter, but up 1.5 percentage points on the year. The UK’s employment rate was slightly higher than London’s at 75.6%, up 0.3 percentage points on the quarter 0.8 percentage points on the year.[2]
- In the three months to April 2018 London’s ILO unemployment rate was 5.2%, up 0.2 percentage points on the quarter but down 0.8 percentage points on the year. The UK unemployment rate was lower than London’s at 4.2%, down 0.1 percentage points on the quarter and 0.4 percentage points on the year.
- In the three months to April 2018 the rate of economic inactivity in London (the proportion of 16 to 64 year olds not in work and not looking for or not able to work) was 21.1%, slightly above the 21.0% in the UK.
Workforce jobs data was updated this month, with data for the first quarter of 2018. Overall, the number of London jobs (i.e. jobs located in London, whether or not taken by London residents) increased by 1.9% on the previous year to 5.9 million. By comparison, jobs in the UK as a whole grew by 0.5% on the year. The 1.9% growth in London is in keeping with the jobs growth rate over the past 20 years, where jobs have grown by 1.8% per year on average.
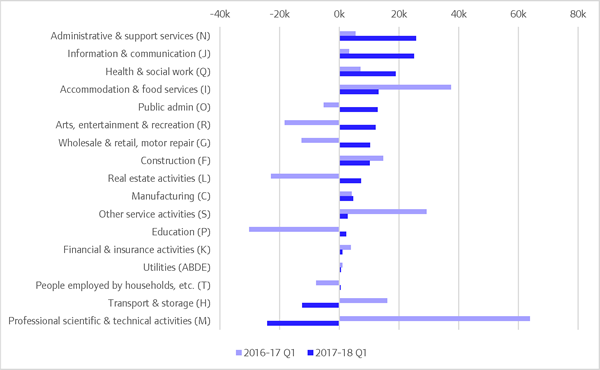
In terms of sectors, the largest jobs growth in London on the year was in Administrative and support services (+26,000 jobs), Information and communication (+25,000 jobs), and Health and social work (+19,000 jobs). There were job losses in Professional, scientific and technical activities (-24,000 jobs) and Transport and storage (-12,000 jobs). This pattern is different from the previous year, when jobs growth was highest in Professional services and Accommodation and food services. Please see the charts on page 4 for more information.
Note on interpreting labour market data: the statistics presented here are estimates based on a survey, and as such have a margin of error. Changes in the headline indicators for London are typically within this margin of error, meaning they are not statistically significant and may not reflect real changes.
Employment and jobs data

*All figures are seasonally adjusted. Rates are based on working age (16 – 64 male and female), with the exception of unemployment rate which is age 16 and above. Note: we are no longer including a table with the claimant count (the number of people claiming unemployment benefits). The roll out of Universal Credit has caused problems with this statistic because of differences in definition and administrative processes between Jobseekers’ Allowance and Universal Credit. The ONS no longer publishes the claimant count as an official statistic. In September 2017 we provided a briefing
Employment rate and unemployment rate charts
Note: charts show seasonally adjusted data.


Workforce jobs charts
Jobs growth, year on year, in London and the UK, 1997 to 2018

Source: ONS workforce jobs
Jobs growth in London by sector, past year (2017-18 Q1) and previous year (2016-17 Q1)
Source: ONS workforce jobs
[1] For avoidance of confusion, the previous quarter (Nov 17-Jan 18) showed an unemployment rate of 74.7% which implies the rate of 74.8% in the latest quarter (Feb-Apr 18) represents an increase. However, the two rates were 74.74% and 74.77% in the respective quarters, i.e. an increase of 0.03 percentage points, which when rounded to 1 decimal point is 0.0.
[2] Note: the employment rate published last month (May, referring to the period Jan-Mar 18) for London was 75.2%.This suggests the employment rate has fallen this month. However, the ONS advise that employment rates should be compared against previous quarters, not the previous month’s data (i.e. Feb-Apr should be compared with Nov-Jan rather than Jan-Mar). On this basis, the employment rate has not changed. The charts on page 3 use the monthly data, and show the fall in the employment rate in the latest month.