Labour market update for London – July 2018
London employment rate down and unemployment rate up (slightly) on the previous quarter
Labour market data for the three-month period March to May 2018 was released today. London’s employment rate fell on the quarter, one of only three UK regions to see a fall (along with the North East and East Midlands). London’s unemployment rate increased on the previous quarter. However, all changes in the London figures are within the margin of error in the data, and so do not suggest significant change.
In terms of pay, in the three months to May in Great Britain overall regular pay (i.e. excluding bonuses) increased 0.4% on the year (i.e. May 2017 to May 2018), compared to a fall of 0.5% over the previous 12 months (i.e. May 2016 to May 2018). Robust earnings data for London is only available annually. The most recent data we have is for April 2017, and showed pay had grown 0.5% in real terms on the previous year, compared to a 0.5% fall in the UK as a whole. Pay remains its pre-recession peak in both London and the UK as a whole in real terms.
GLA Economics have recently updated our ‘more detailed jobs series’, which gives estimates of employee jobs in London (i.e. not including self-employment) from 1998 to 2016 for detailed industry levels. For example, in 2016, 406,750 people were employed in ‘Information and communication’, of which 54,600 worked in ‘Publishing activities’, of which 50,300 were employed in ‘Publishing of books, periodicals, and other publishing of newspapers’, of which 13,300 people were employed in ‘Publishing of newspapers’. Similar detail is available for other industries. You can download the data on the GLA datastore[1].
ONS Jobs data was updated last month, and showed relatively strong jobs growth in London compared to the UK as a whole. ‘Jobs’ here refers to all jobs located in London (including self-employment) whether or not filled by London residents. London jobs growth was concentrated in Administrative and support services, Information and communication, and Health and social work. There were 5.9 million jobs in London in the first quarter of 2018, up 110,000 on the year.
Headline labour market figures (full tables below)
- London’s employment rate (i.e. the proportion of London’s residents aged 16-64 population in employment) in the three months to May 2018 was 74.7%, down 0.4 percentage points on the quarter, but up 0.7 percentage points on the year. The UK’s employment rate was 1 percentage point higher than London’s at 75.7%, up 0.3 percentage points on the quarter and also up 0.7 percentage points on the year.
- In the three months to May 2018 London’s ILO unemployment rate was 5.1%, up 0.3 percentage points on the quarter but down 0.4 percentage points on the year. The UK unemployment rate was lower than London’s at 4.2%, down 0.1 percentage points on the quarter and 0.3 percentage points on the year.
- In the three months to May 2018 the rate of economic inactivity in London (the proportion of 16 to 64 year olds not in work and not looking for or not able to work) was 21.2%, up 0.1 percentage points on the quarter, and slightly above the 21.0% in the UK.
Note on interpreting labour market data: the statistics presented here are estimates based on a survey, and as such have a margin of error. Changes in the headline indicators for London, and the gap between London and the UK as a whole, are typically within this margin of error, meaning they are not statistically significant and may not reflect real changes / differences.
Employment and jobs data

*All figures are seasonally adjusted. Rates are based on working age (16 – 64 male and female), with the exception of unemployment rate which is age 16 and above. Note: we are no longer including a table with the claimant count (the number of people claiming unemployment benefits). The roll out of Universal Credit has caused problems with this statistic because of differences in definition and administrative processes between Jobseekers’ Allowance and Universal Credit. The ONS no longer publishes the claimant count as an official statistic. In September 2017 we provided a briefing
Employment rate and unemployment rate charts
Note: charts show seasonally adjusted data.


Workforce jobs charts
Jobs growth, year on year, in London and the UK, 1997 to 2018
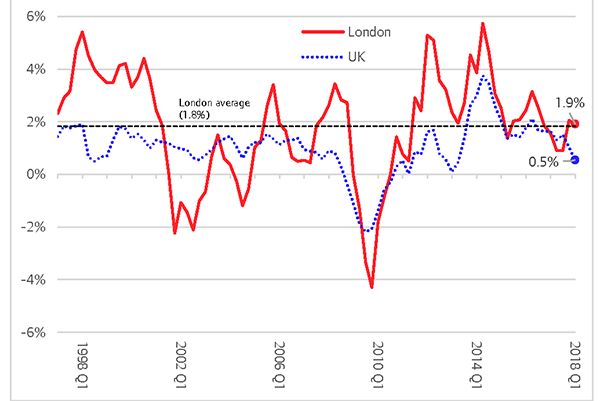
Source: ONS workforce jobs
Jobs growth in London by sector, past year (2017-18 Q1) and previous year (2016-17 Q1)

Source: ONS workforce jobs