EU Referendum Results: A Demographic Breakdown
Note: The analysis provided is by no means comprehensive and simply aims to provide some early pointers as to the relationship between socio-demographic factors and vote share in the Referendum.
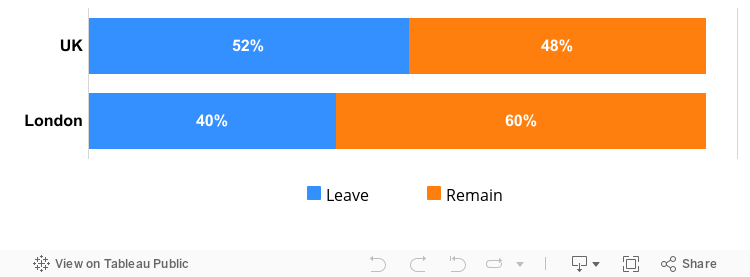
On the 23rd of June the British public were asked if the United Kingdom should remain a member of the European Union or leave. The results came in with 52% choosing to leave the EU; however this narrative wasn’t consistent across the country. Londoners in particular were much more likely to favour the UK remaining in the EU, with 60% choosing to do so.
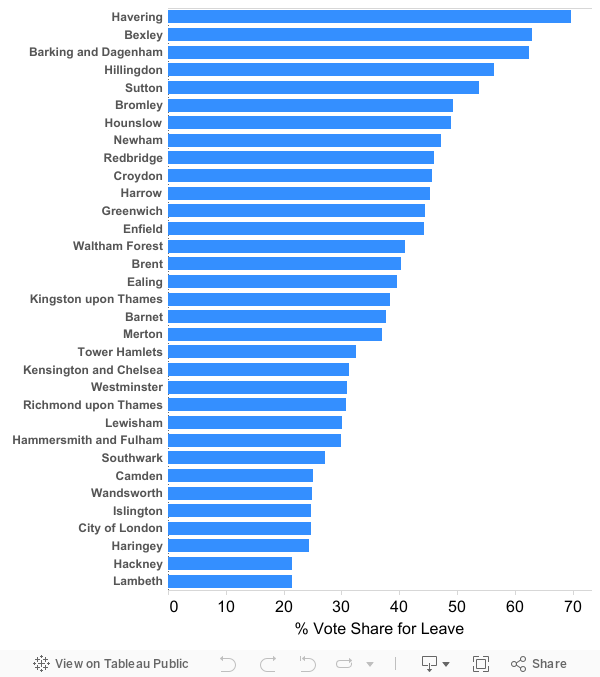
Even within London there was significant variation. On one end of the scale, some 70% of Havering’s residents voted to Leave – one of the highest rates in the country – while only Gibraltar had a higher rate voting to Remain than the Inner London boroughs of Lambeth, Hackney and Haringey. In fact, 8 of the top 10 highest Remain rates were found in Inner London boroughs.
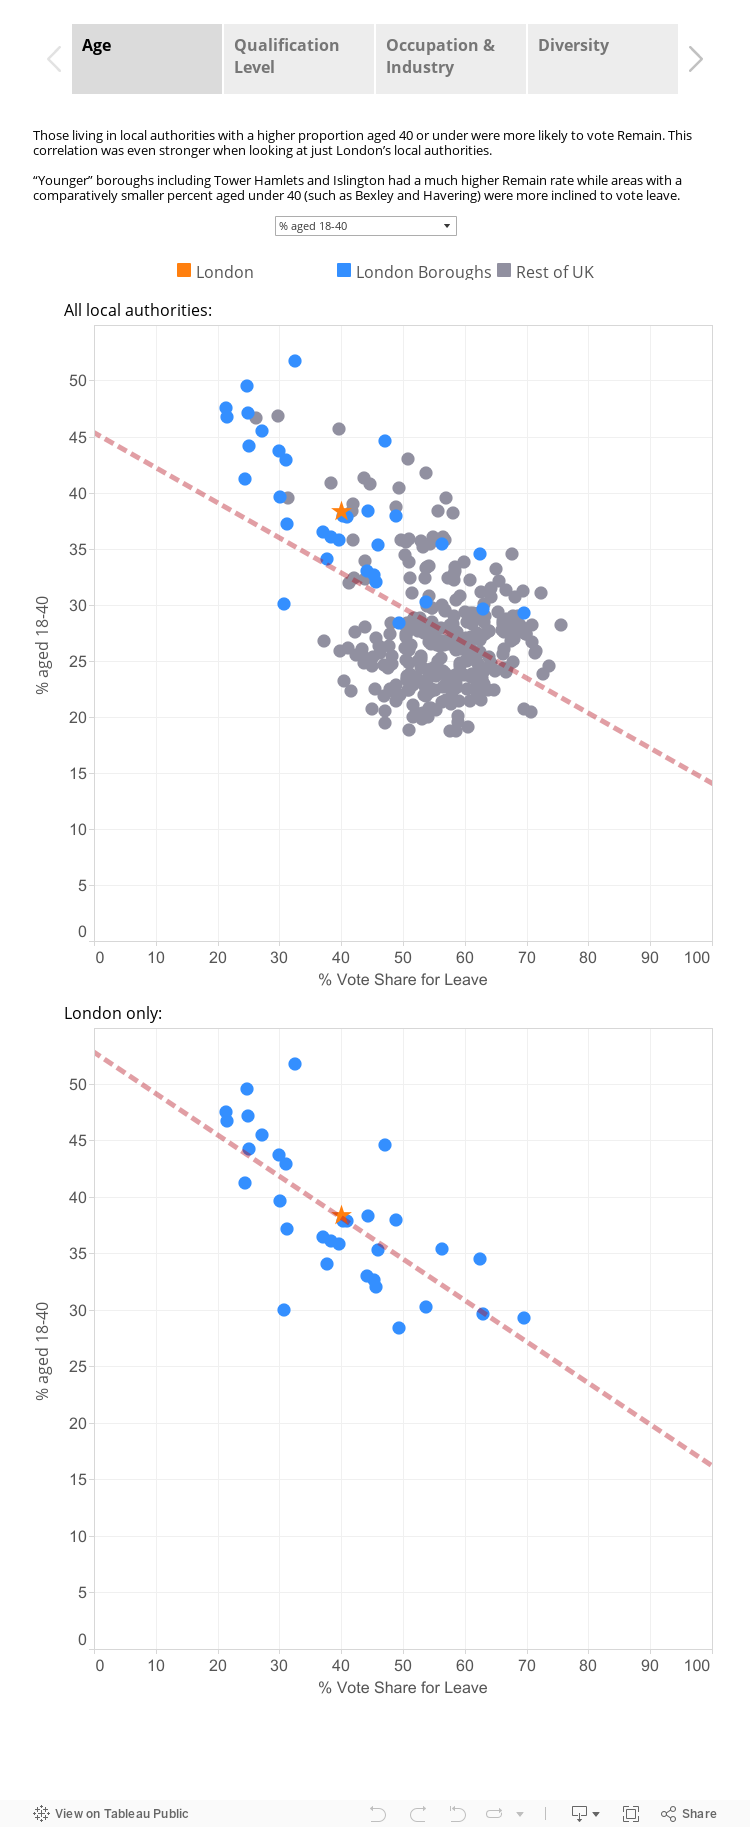
Demographic Breakdown
By comparing the characteristics of local authorities with their vote share we can get an idea of how demographic differences relate to how people voted. Select a box below to change breakdown.
Sources:
Electoral Commission
ONS 2014 SNPP
ONS APS 2015
ONS 2011 Census