Labour market update for London – March 2020
Employment rate in London hits record high
The ONS today released labour market data for the three months to January 2019. The latest figures show that London’s labour market remained buoyant during this period, with the employment reaching its highest level since the series began (in 1992).The workforce jobs series was also updated this month, with provisional estimates for the fourth quarter of 2019. The number of jobs in the capital increased by 2.8% on the fourth quarter of the previous year, compared to 1.5% in the UK as a whole.
- In the three months to January 2020, London’s 16-64 employment rate was estimated at a record high of 76.0%. This was up by 1.2 percentage points on the previous quarter and by 0.7 percentage points up on the year. For the UK as a whole the employment rate rose by 0.4 percentage points on the previous year, reaching 76.5%.
- The unemployment rate (the number of unemployed people as a percentage of the labour force) in the capital was5%, virtually unchanged on the quarter but 0.3 percentage points up on the year. The UK unemployment rate was estimated at 3.9%, 0.2 percentage points down on the quarter and unchanged on the year.
- London’s 16-64 economic inactivity rate was estimated at 20.4%, 1.3 percentage points lower than the previous quarter and 0.8 percentage points down on the year. The UK inactivity rate was 20.4%, down 0.4 percentage points on the quarter and 0.3 percentage points on the year.
- Provisional workforce jobs data shows that there were 6.1 million jobs in London in the fourth quarter of 2019 – an increase of 170,000 jobs or 2.8% on the previous year. This was higher than the UK growth rate over the same period (1.5%) and the London average over the last two decades (1.8%).
- Among London’s sectors, “Information & Communication” saw the highest annual growth in jobs (+40,000), followed by “Education” (+38,000). In contrast, “Transport & Storage” fell on the previous year (-25,000), along with “Admin & support service activities” jobs (-9,000).
Note on interpreting labour market data: many of the statistics presented here are estimates based on a survey, and as such have a margin of error – known as sampling variability. For example, a sampling variability of 0.1 and an estimated value of 2% would mean that if the survey was carried out 100 times, then in 95 of these the value would be between 1.9% and 2.1%. Changes in the headline indicators for London, and the gap between London and the UK are often within the survey’s margin of error, meaning they are not statistically significant and may not reflect real changes / differences.
Headline labour market data – employment rate, unemployment rate, and economic inactivity rate
Note: charts show seasonally adjusted data.
London’s employment rate (i.e. the proportion of London’s residents aged 16-64 population in employment) in the three months to January 2020 was 76.0%, up 1.2 percentage points on the quarter and up 0.7 percentage points on the year. The UK’s employment rate rose to 76.5%, up 0.3 percentage points on the quarter and 0.4 percentage points on the year.

In the three months to January 2020 London’s ILO unemployment rate was 4.5%, unchanged on the quarter and 0.3 percentage points up on the previous year. The UK’s unemployment rate was 0.6 percentage points lower than London’s, at 3.9%, 0.2 percentage points down on the quarter and unchanged on the year.

In the three months to January 2020 the rate of economic inactivity in London (the proportion of 16 to 64 year olds not in work and not looking for or not able to work) was 20.4%, down 1.3 percentage points on the previous quarter and 0.8 percentage points down on the year. The UK’s rate of economic inactivity was also 20.4%, down 0.4 percentage points on the previous quarter and 0.3 percentage points on the year.

Headline labour market data for London and the UK

*All figures are seasonally adjusted. Rates are based on working age (16 – 64 male and female), with the exception of the unemployment rate which is age 16+. We are no longer including a table with the claimant count (the number of people claiming unemployment benefits). The roll out of Universal Credit has caused problems with this statistic. In September 2017 we provided a briefing.
Jobs charts
Year-on-year jobs growth (%), London and the UK, 1996 Q4 to 2019 Q4

Source: ONS workforce jobs
Jobs growth in London by sector, last 12 months (2018-19 Q4) and previous (2017-18 Q4)
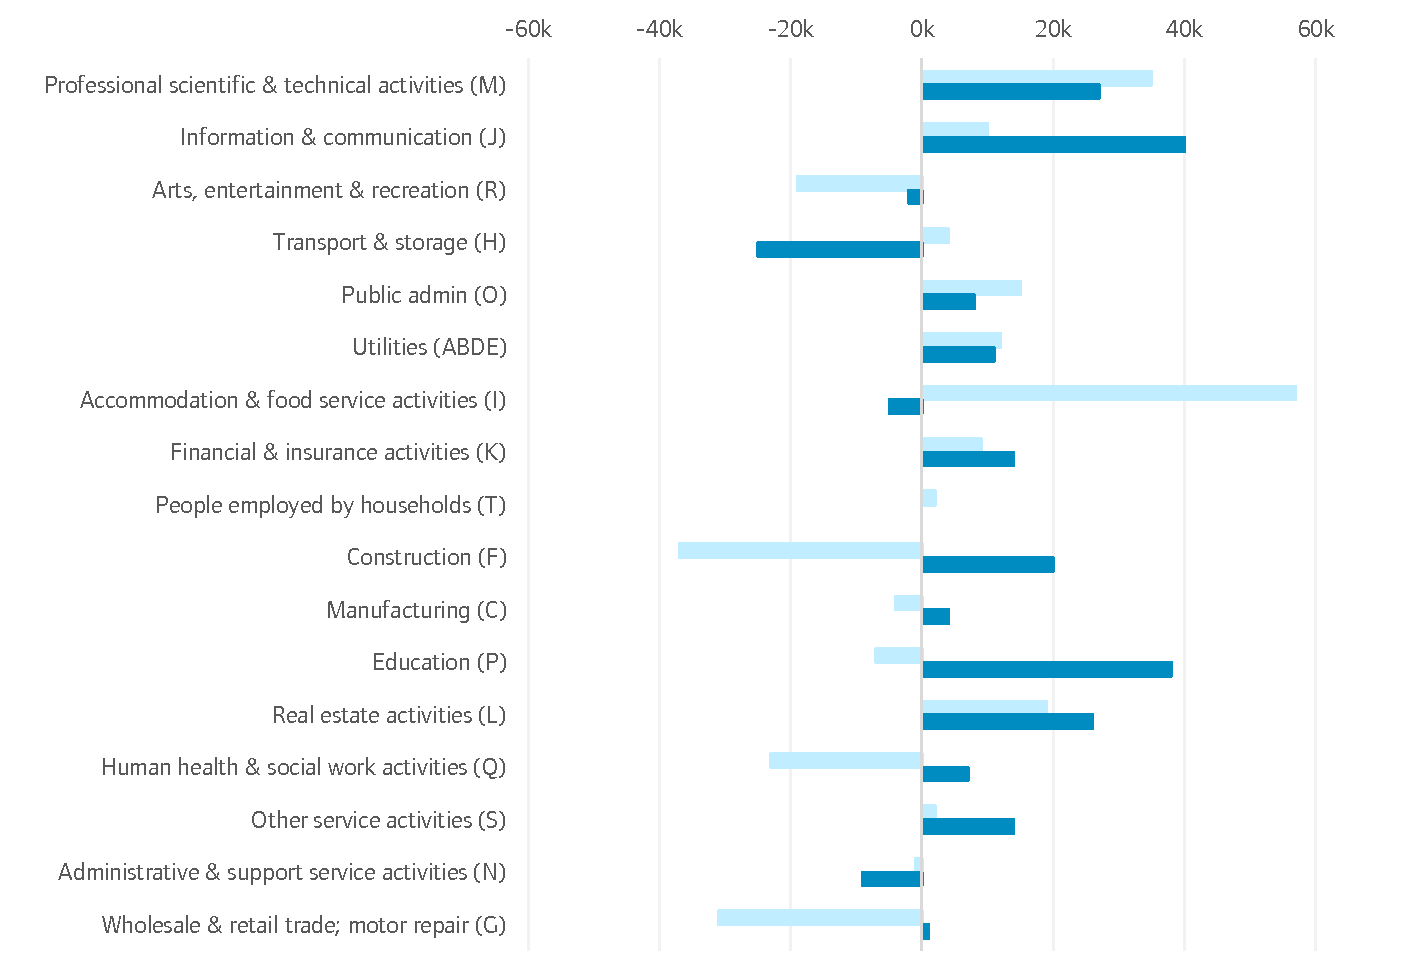
Source: ONS workforce jobs