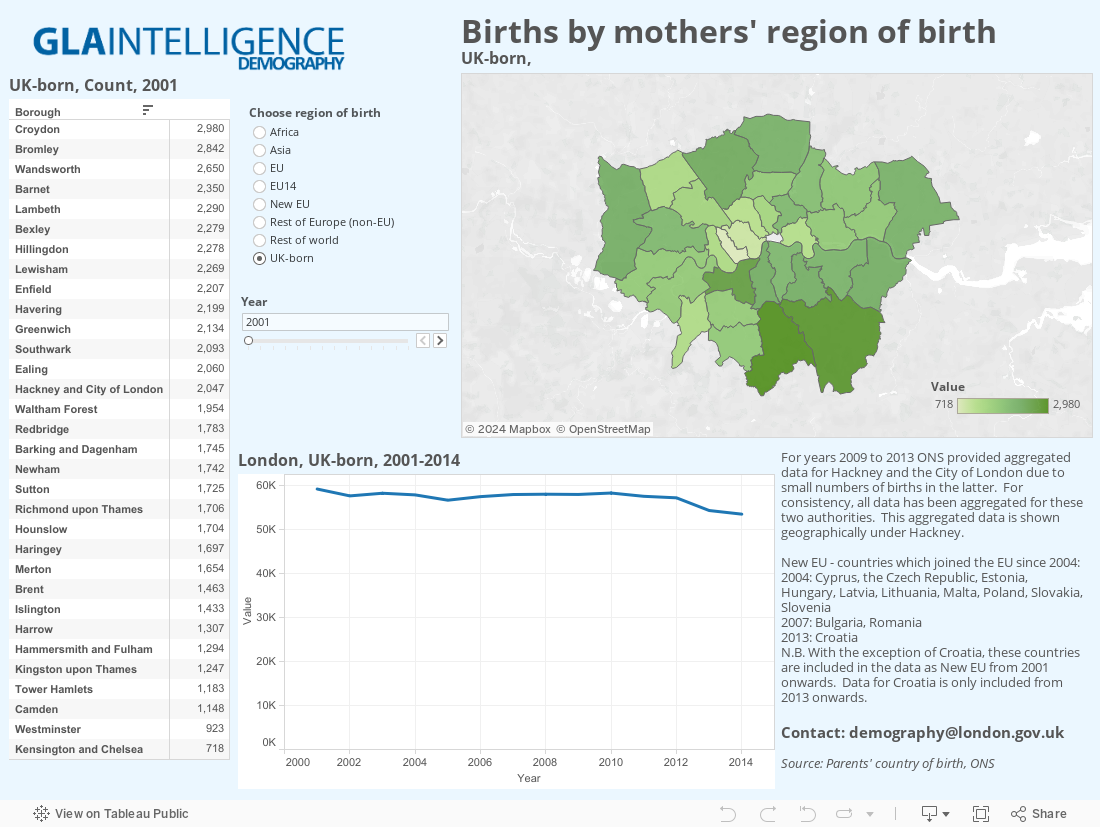
This Tableau visualisation presents data released by the Office for National Statistics (ONS) regarding mothers’ region of birth at a London borough level from 2001 to 2014. It should be viewed in conjunction with the accompanying GLA Update 11-2015.
Use of the visualisation: The visualisation lets you select a pre-defined world region and year. The thematic borough map will change based on the selection made as will the table of data. The line chart will always show the data at London level over time.