

27th November 2025 by Daryl Rozario, Jubair Ahmed, Gordon Douglass, Ali Ögcem and Sixia Zhang
Chancellor announces significant revenue raising measures in the Budget The Chancellor’s Autumn Budget introduces £26 billion in tax rises by 2029-30, to fund £11 billion in spending increases and cut borrowing from 4.5% to 1.9% of GDP over the forecast period. Spending commitments include removing...

10th November 2025 by Matthew Tibbles
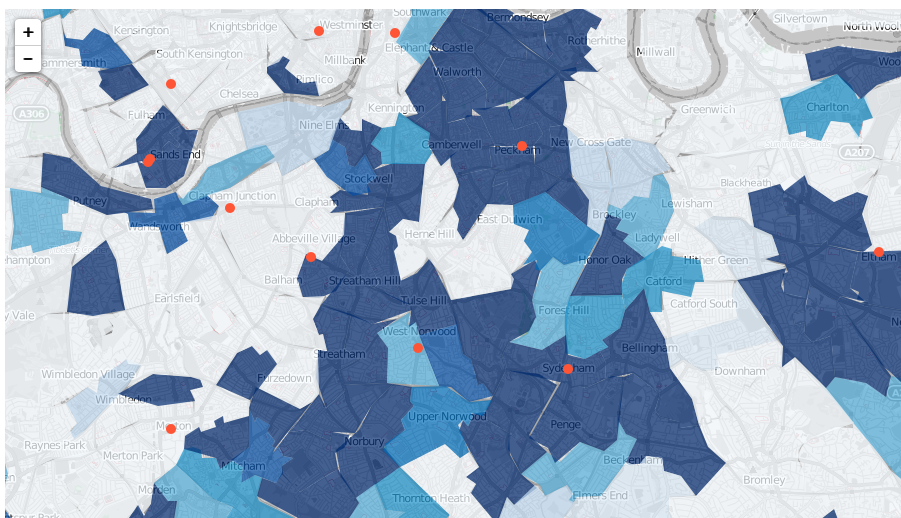
Introduction The Indices of Deprivation 2025 (IoD25) provides a suite of measures on relative levels of deprivation across 33,755 neighbourhoods, called Lower-Layer Super Output Areas (LSOAs), in England.[1] This latest release updates and replaces the Indices of Deprivation 2019 (IoD19). This note...

30th October 2025 by Pauline Bucher
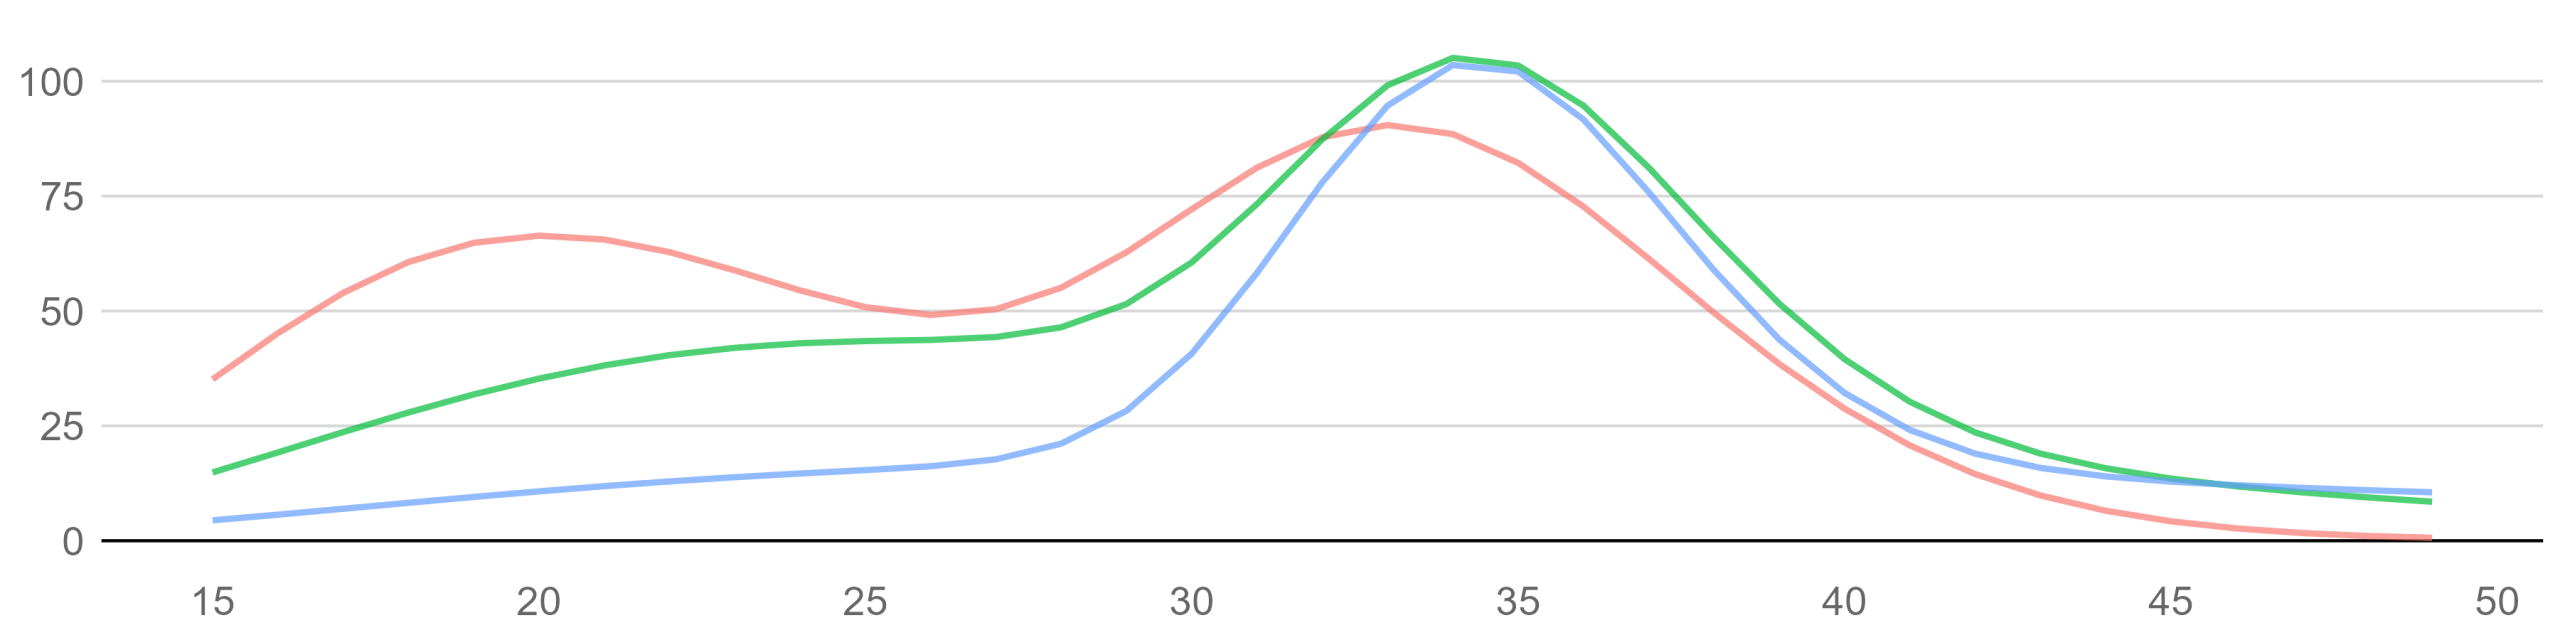
Gender inequalities in the UK and London labour markets are large. Recent data show that women living in London are around 10 percentage points less likely to be in work than men; and earn on average 19% less per hour than men.[1] Economists highlight the role of children in gender inequality, with...
21st October 2025 by IzabelBahia
Summary Earlier this month, the London Assembly’s Economy, Culture and Skills Committee met to discuss the falling birth rates in London. The open investigation comes after the publication of several newspaper articles and research papers in the past few months highlighting the effects of falling...

17th March 2025 by Guillaume Paugam
1 Introduction In London, 2.2 million people were in relative poverty according to the latest data for 2020/21-2022/23 – meaning that 24% of the capital’s residents lived in households with less than 60% of UK median income.[1] This was higher than the UK-wide rate of 22%. At that time, many labour...

27th April 2023 by James Watson
This article was recently published on the Economics Observatory website. London is a famously expensive city. But higher salaries, lower energy bills, and better public transport led some to believe that people living in the capital may be resilient to rising prices. By analysing the latest prices...

27th March 2023 by Rachel Leeser
Key points: The data collection used to create these poverty statistics was heavily affected by the coronavirus (COVID-19) pandemic, as in the previous year, but to a lesser extent. As a result, only a single recorded change in the Department for Work and Pensions’ (DWP) published headline...

30th September 2022 by Barry Fong
The City Intelligence Unit has published the headline findings from the Survey of Londoners 2021-22, a major social survey designed to assess the impact of COVID-19 and associated restrictions on key social outcomes for Londoners, not available from other data sources. It follows up on a similar...

22nd August 2022 by Daryl Rozario, James Watson, Nick Jacob and Yvette Smith
The cost of living crisis increasingly dominates the outlook for London, threatening to widen existing inequalities, halt the recovery from the pandemic and push many into being unable to afford necessities. Our latest report builds on previous work at the start of this year to set out an evidence...

26th May 2022 by Daryl Rozario, Mike Hope, and Jasmine Farquharson
Rising prices and higher taxes are squeezing household budgets Evidence is becoming firmer of the impact of the cost-of-living crisis both on what is happening now, the differential impacts across households, and the possible impacts over the course of the year. There has been a 57% jump in the...
7th April 2022 by Rachel Leeser
Key Points Overall poverty levels fell in the UK during the first year of the pandemic as median income decreased slightly and the £20 per week uplift to Universal Credit and Working Tax Credit increased income for some people towards the bottom of the income distribution. Due to difficulties during...

1st February 2022 by James Watson, Rachel Leeser, Yvette Smith, Christopher Rocks, Barry Fong, Myles Wilson
Executive summary Key points for London: Inflation is running at a 30-year high of 5.4% year-on-year, driven by supply chain challenges and rising global fuel prices. Price growth in London is likely higher than the rest of the UK, with the National Institute of Economic and Social Research (NIESR)...
28th March 2021 by Rachel Leeser
Key Points Overall poverty levels in London, in the period prior to the pandemic in the UK (up to March 2020), fell marginally. Evidence from elsewhere suggests that poverty levels will have increased during the pandemic, but the official data currently available covers the three year period ending...
27th March 2020 by Rachel Leeser
Key Points: Overall poverty levels have stayed the same in London and nationally. Child poverty has risen in London, both in terms of number and rates and now stands at 39 per cent of all the capital’s children. This represents 800,000 children living in poverty – more than at any time since the...

20th January 2020 by Andrew Jolly, University of Wolverhampton
Estimating the numbers of migrants in the UK is notoriously difficult, especially those with an irregular migration status who may not be counted in official government statistics. It is not for nothing that the task has been described as counting the uncountable. However, information about the...

27th September 2019 by Rachel Leeser
The Indices of Deprivation 2019 (ID2019) are the Government’s primary measure of deprivation for small areas (known as LSOAs) in England. They replace and update the Indices of Deprivation 2015. The main index is the Index of Multiple Deprivation (IMD), which combines measures across seven distinct...

17th July 2019 by Spencer Thompson
Today, GLA City Intelligence published the first cumulative impact assessment (CIA) of welfare and tax reform in London. The UK tax-benefit system has undergone wide-reaching changes since 2010, including the gradual rollout of Universal Credit, above-inflation increases in the tax-free personal tax...

27th June 2019 by Vivienne Avery
City Intelligence has published the headline findings from The Survey of Londoners, a major new social survey designed to measure social integration, economic fairness and food security across the city. Over the last two years, we have been working with colleagues across the GLA to develop our...

26th June 2019 by Barry Fong
Back in October 2018, we wrote about the GLA’s plans to measure food security in London for the first time, through a series of questions included in the Survey of Londoners. The Survey has now concluded and the first results have been published on the London Datastore. With regard to food security...
29th March 2019 by Rachel Leeser
The total number of Londoners living in poverty has continued to rise over the last few years with the growing population and now stands at around 2.4 million people, according to official government figures. This means 28 per cent of everyone living in the region are in poverty, averaged over three...
5th April 2017 by Rachel Leeser
Official government figures show that the total number of Londoners living in poverty has risen a little over the last few years with the growing population and now stands at around 2.3 million people. In percentage terms, the rate has stayed the same, at 27 per cent of all those living in the...
9th February 2017 by Giovanni Tonutti
Policy in Practice are embarking on an ambitious project to track over half a million low-income households in London to understand how they are impacted by welfare reforms and other government policies over the course of almost two years. Using councils’ anonymised household level data, the project...
29th September 2016 by Rachel Leeser
London, along with other regions in the south of England, has a lower proportion of households (with at least one person aged 16-64) with no-one in work. Previously, London has had higher levels of workless households, but both the number and the proportion of such households have decreased with the...
24th June 2016 by Andy Hamflett and Lucy Kimbell
Over the past 18 months, the Trussell Trust, the UK’s biggest foodbank, has been exploring its data in new ways. Working with researchers from Hull University Business School, data science firm Coppelia and social innovation agency AAM Associates, the project honed in on new insights and ways of...

18th January 2016 by Joseph Colombeau
Older people can face various barriers to experiencing the full range of benefits that society affords. Poor transport links, social isolation and insufficient income can all have a detrimental impact to a person’s quality of life. This inability for an individual to benefit from the opportunities...