
Poverty in London 2020/21
Key Points
- Overall poverty levels fell in the UK during the first year of the pandemic as median income decreased slightly and the £20 per week uplift to Universal Credit and Working Tax Credit increased income for some people towards the bottom of the income distribution.
- Due to difficulties during the pandemic with the underlying survey, from which the official poverty statistics are derived, increased uncertainty in the data means that DWP have taken the decision not to publish the more detailed characteristics data, such as looking at work status or family type or any regional statistics, so there are no published poverty estimates for London for 2020/21.
- Child poverty and pensioner poverty decreased slightly across the UK, while poverty among working age people remained stable.
- Persistent poverty remains a significant issue, with the latest data suggesting that three quarters of London’s children in poverty were in poverty in at least three of the four years prior to the pandemic, meaning that almost three in ten of London’s children are growing up in persistent poverty.
- Modelled estimates of children living in low income families indicate that 17 per cent of London’s children overall were living in poverty before taking housing costs into account in 2020/21. Estimates for small areas highlight some of the areas in London where the issue of child poverty is most acute, most notably some of the wards in Tower Hamlets and Camden.
- Material deprivation estimates have been compromised by the restrictions imposed as a result of the pandemic, with several elements in the questions being unavailable for at least some of the year for example, holidays away, trips out, friends to tea etc. Nevertheless, new estimates of working age material deprivation and low income have been published showing reductions over the last decade at a national level.
- Just 88 per cent of households in the UK and in London have high food security. Low or very low food security was reported for 7 per cent of households in the previous 30 days.
The data used in this analysis relates to the year ending 31st March 2021, so covers the first year of the Covid-19 pandemic. The timing means that the underlying data collection for the main poverty statistics were impacted significantly. The Family Resources Survey (FRS), the Department for Work and Pensions’ (DWP) main survey, was conducted by telephone rather than in person during 2020/21, which meant that response rates were lower than in previous years, but also somewhat biased, with those responding tending to be older, more affluent and better educated than would be expected. While the outputs have corrected this bias to a large extent, there is additional uncertainty and so DWP have decided not to release the more detailed data looking at characteristics of those in low income and there is no regional data published from the main poverty statistics.
This note concentrates on the measure of relative poverty after housing costs (AHC), which is people living in households with equivalised[1] income to spend below 60 per cent of contemporary median income after taking account of essential housing costs of rent, mortgage interest, council tax, water bills etc, but not including fuel bills .
At a national level, median income was lower during 2020/21 than during the previous year, down £9 per week before housing costs (BHC) to £539 per week for a couple with no children and down £7 per week AHC to £472. Income inequality decreased slightly, with poverty rates lowered on all measures, which is expected, given the lowering of median income and the temporary uplift to benefit levels for many people in lower income groups. There are a large number of individuals living in households with equivalised incomes close to the 60 per cent of median equivalised income or the “relative poverty line”. For the UK as a whole, relative low income was down from 22 per cent to around 20 per cent AHC, or one in five of all UK residents were considered to be living in poverty in 2020/21.
The latest data available for London for the three year period 2017/18-2019/20 showed 27 per cent of all residents living in poverty, at least two percentage points above the rate for any other region or part of the UK. This does not take into account any of the changes occurring during the pandemic.
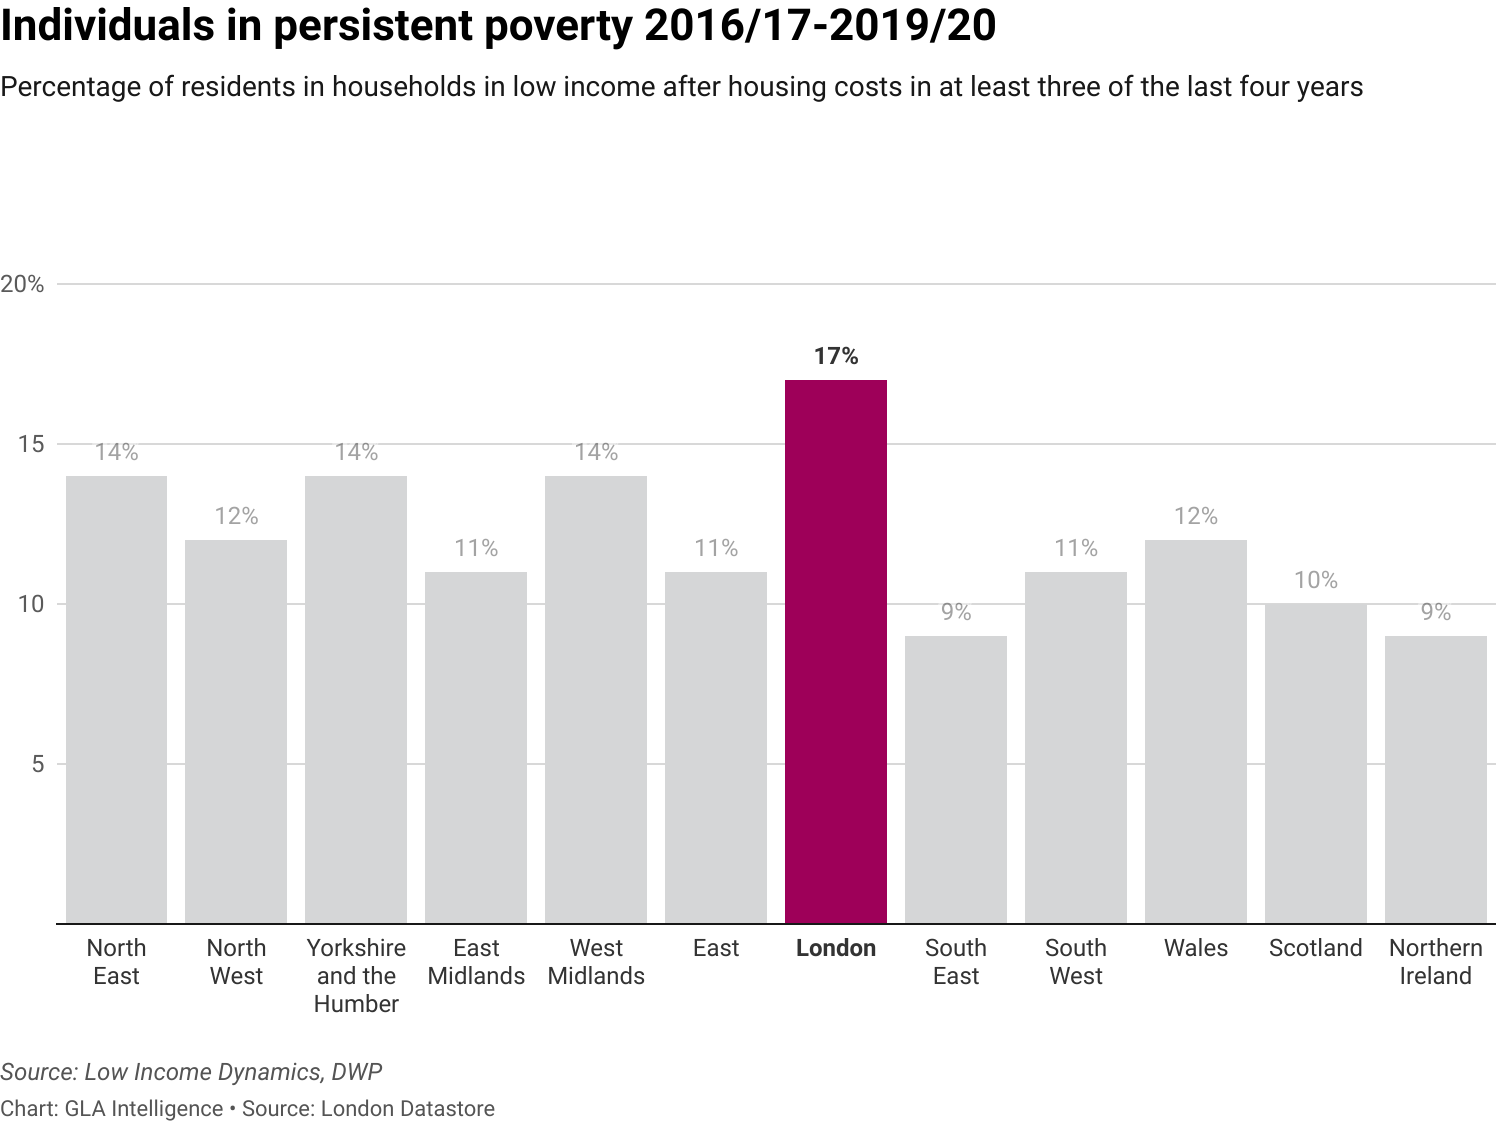
While no update to the main poverty statistics is available for London, the measure of persistent poverty [2] produced by DWP, using the Understanding Society survey, does provide an update to include the 2019/20 year. This shows that around one in six Londoners were in households in persistent low income AHC between 2016/17 to 2019/20, well above the proportion in any other region.
Poverty by age group
Children
Again at a national level, child poverty shows as having fallen in the latest statistics. Although the drop is not statistically significant, with increased levels of uncertainty, it appears larger than the drop for the overall population, reducing by four percentage points. That puts the national measure of the percentage of children living in relative poverty AHC matching its lowest level since the series began in 1994/95, at 27 per cent.
For some children, their experience of poverty may be relatively short term, but most children in poverty stay in poverty. The percentage of all children in London counted as being in persistent poverty in 2015/16-2019/20 was 29 per cent AHC, again clearly above the rates for other parts of the UK. That suggests that more than three quarters of London’s children in poverty in 2017/18-2019/20 are counted as being in persistent poverty.
Material deprivation – when people cannot afford what are commonly regarded as essentials for life in Britain – has been measured and reported alongside income data for children for several years. Prior to the pandemic (2017/18-2019/20), low income (below 70 per cent of median income BHC[3]) and material deprivation affected one in eight children in London, while the level of severe low income (below 50 per cent of median income BHC) and material deprivation was lower, at around one in sixteen. Access to some social opportunities and services, and even to some goods, such as holidays away from home, having a friend round for a meal or snack, going out with friends, getting hair cut regularly, was affected by lockdowns and restrictions during the pandemic, so the measures of material deprivation for 2020/21 are not directly comparable with those for previous years and there is greater uncertainty in any estimates of material deprivation even than for the other poverty statistics derived from the FRS . Around one in ten UK children were counted as in low income households and material deprivation which appears to be somewhat lower than previous estimates, at one in eight.
The DWP also publish a set of estimates of the numbers of children in poverty for areas across the UK, down to small area level. This uses administrative records of benefit data, combined with income levels consistent with the HBAI Before Housing Costs measure to give estimates of the number of dependent children in poverty (BHC). Using GLA adjusted figures[4] for the number of children under 18 to calculate rates, this suggests that the proportion of children in low income families BHC reduced from 19 per cent for London as a whole in 2019/20 to 17 per cent for 2020/21, still almost 400,000 children under 18 living in poverty before taking account of housing costs.
The map below shows the ward distribution of poverty among children under 18 in London.[5]
The rates given are not comparable with those used elsewhere in this note, since the data are for a single year and the definition does not take into account housing costs, which are a clear driver of poverty levels in London. Nevertheless, these estimates may give some indication of where child poverty is particularly acute within London.
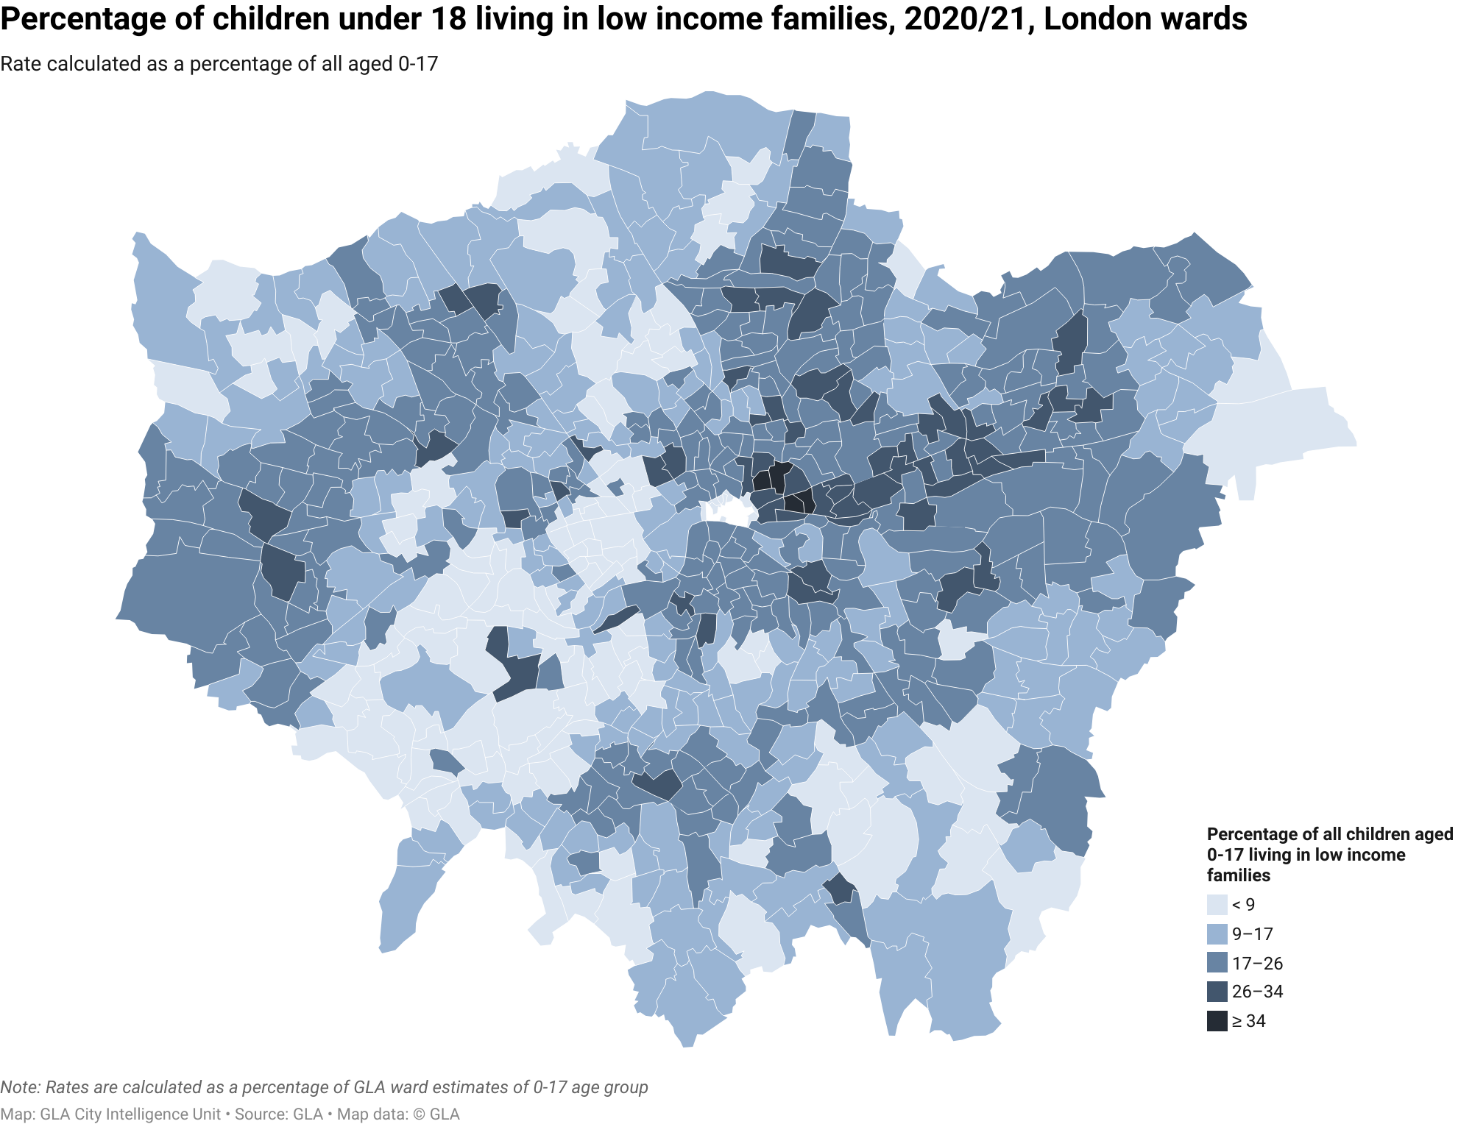
Source: Children in low income families, 2020/21, DWP
and GLA ward population estimates
Working-age adults
Poverty among working age people in the UK has shown relatively little change over twenty years, and indeed the latest estimate, for the first year of the pandemic, shows very little change, staying at 20 per cent in relative low income AHC. The London poverty rates for this age group stood just below one in four prior to the pandemic, which was still well above the national figure. This represented 1.4 million working age Londoners living in relative poverty after taking their housing costs into account. Around half of working age Londoners in poverty were classified as in persistent poverty – around 13 per cent of all working age Londoners. This rate was matched only in Yorkshire & the Humber and in Wales.
Statistics on working age adults in combined absolute low income and material deprivation have been published for the first time in 2022. Absolute low income means living in a household with less than 60 per cent of the equivalised median income for 2010/11, so held constant in real terms. Even allowing for the uncertainty in the FRS, some questions around material deprivation would have been particularly affected by the restrictions, such as ‘A holiday away from home for at least one week a year, not staying with relatives’, making differences especially difficult to interpret. For the UK, five per cent of working age individuals were counted as in absolute low income and material deprivation. The overall trend was decreasing since 2012/13, when nine per cent were estimated to be in absolute low income and material deprivation.
Pensioners
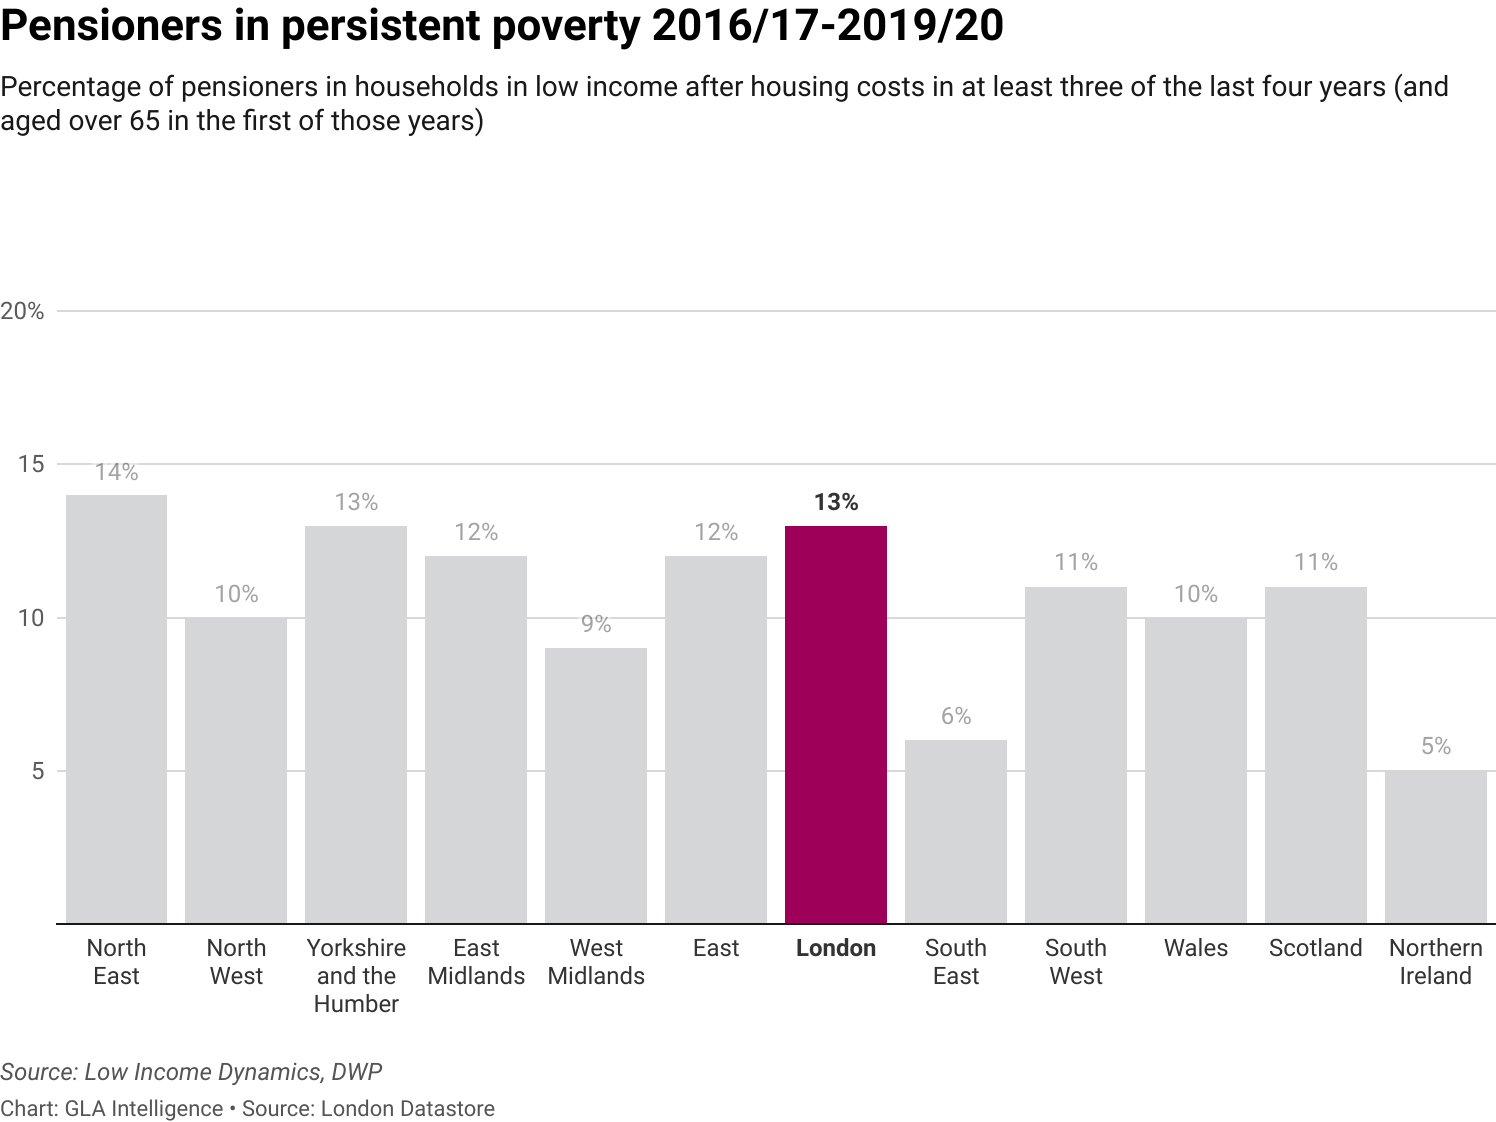
Pensioner poverty across the UK appeared to fall in the latest estimates, though again there is greater uncertainty in the latest figures and the change is not statistically significant. Because a larger proportion of pensioners own their homes outright, poverty among pensioners tends to be higher BHC than AHC. However, previous data has shown that pensioners in London were more likely to be in poverty than those in other parts of the UK, and poverty rates in London, even among pensioners were higher AHC than BHC, likely due to higher proportions of renters among this age group in London. Around one in eight London pensioners are classified as in persistent poverty (AHC), according to the latest figures for the period from 2016/17 – 2019/20, having been counted as living in poverty in at least three years out of the last four[6]. This was an increase from one in ten for 2015/16-2018/19.
National estimates of material deprivation among pensioners suggest that it may have been slightly lower in 2020/21 than previous years, at around five per cent. However, due to many considerations around the pandemic, including restrictions, shielding etc, interpretation of these figures needs to be treated with extreme caution. Prior to the pandemic, the FRS showed that material deprivation levels among pensioners in London were double those in most of the rest of the country.
Food security
Now included as part of the FRS are questions around food security[7]. It found that 88 per cent of UK households had high food security in the previous 30 days, with a further 5 per cent having only marginal food security but seven per cent were food insecure with either low or very low food security in 2020/21. The figures for London are similar to those for the UK, though slightly more households had very low food security as opposed to low food security in London (5 per cent very low, 3 per cent low in London, compared with 3 per cent low and 3 per cent very low for UK).
While the food security status of individuals within households can vary, there were 4.2 million individuals living in food insecure households in the UK. Just 2.4 million of these were living in households that were in relative poverty AHC, out of a total of 13.4 million people living in households in relative poverty AHC. However, more than half a million of people living in food insecure households had incomes above 70 per cent of median income AHC, which indicates that the measure of low income does not capture the full extent of people in financial hardship in the UK.
All data in this briefing note are derived from published DWP Households Below Average Income series, based on the Family Resources Survey, other published tables from the Family Resources Survey, DWP Income Dynamics, which uses underlying data from Understanding Society and DWP estimates of Children in Low Income Families, which are derived mainly from data collected to administer benefits and tax credits and the new Working Age Combined Absolute Low Income and Material Deprivation Estimates, also from DWP.
[1] Equivalised means adjusted for number and age of household members to allow for comparisons between different types of households.
[2] Persistent poverty is defined as being in poverty in the latest year and in at least two of the previous three years.
[3] Note that this level of 70 per cent of median income is higher than the headline poverty level of 60 per cent of median income.
[4] Estimates for wards used here are based on ONS mid year estimates, but adjusted for known issues with local estimates for children relating to international migration.
[5] A small proportion of children aged under 18 would not be included as dependent children, including those who live independently of their parents, those in employment, those with their own partner or child. Additionally, children are counted at their term time address, so there may be some underestimation of poverty rates among children with a home address in a ward which includes a boarding school, while wards with a higher proportion of children with a home address in that ward, but who attend a boarding school would tend to show overestimated poverty.
[6] Note that this is of people who were counted in poverty in the latest data and were already over state retirement age in the first of the four years.
[7] Households with high or marginal food security are “food secure”. Food secure households are considered to have sufficient, varied food to facilitate an active and healthy lifestyle. Households with low or very low food security are “food insecure”. Food insecure households have a risk of, or lack of access to, sufficient, varied food. For more details, see https://www.gov.uk/government/statistics/family-resources-survey-financial-year-2019-to-2020/family-resources-survey-financial-year-2019-to-2020#household-food-security-1