

21st March 2025 by Macarena Plaza Helguero and Hong Chen, GLA
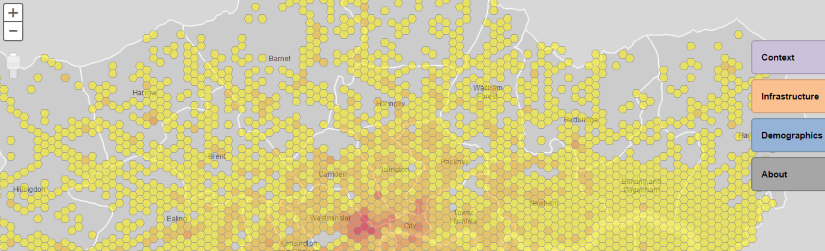
Blog 3: Celebrating London’s data story The evolution of the Infrastructure Mapping Application (IMA) Toolbox and its role in the planning and delivery of infrastructure across London London’s infrastructure landscape is as complex as the city itself. With nearly nine million residents spread across...

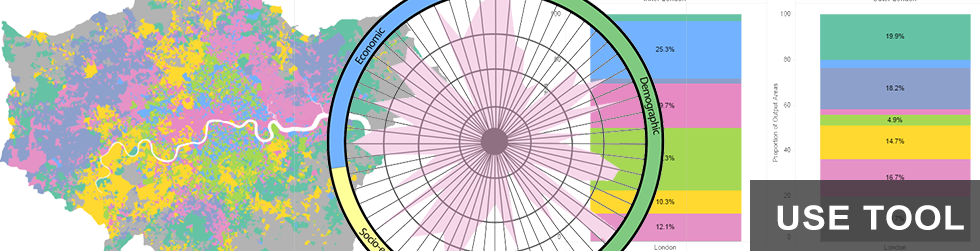
29th March 2021 by Rosa Sulley, Amanda Robinson and Chris Paddock (PRD)
The emerging London High Streets Data Service provides the most comprehensive locally derived evidence base for specific places ever assembled. Bringing together a range of proprietorial, public and primary data, it will provide a rapidly updated view of how London recovers and how specific places...

28th April 2020 by Iveta Krajciova
CONFIGURING DOCKERIZED WSO2 API MANAGER v3.0 PRODUCT ON UBUNTU 18.0 SERVER AS THE PART OF URBAN SHARING PLATFORM New sensors and Internet of Things (IoT) devices are springing up across cities. They provide a great opportunity for more detailed and up to date information for city planners and...

18th July 2018 by Nye Cominetti
In 2017 the GLA published a ‘pubs audit’, to look at what was happening to pubs in London. We recently updated this audit for 2018 – this blog outlines some of the findings. The 2017 audit showed that the number of pubs had fallen by a quarter since 2001. In response, the GLA has moved to protect...

15th June 2017 by Simona Ciocoiu & Duncan Wilson (Intel)
Be part of the next wave of experiments in urban data and IoT in London. Are you a citizen, a community group, a local authority, a public sector body, a business, or a researcher looking for funding to change London for the better? And do you want to use data to do so? Funded by the European...

4th April 2017 by The Conversation
This blog was taken from The Conversation. Read the original article here. The blog authors are: Sarah Barns, Western Sydney University Donald McNeill, Western Sydney University Ellie Cosgrave, UCL Michele Acuto, UCL This is the second article in The Conversation’s series Making Cities Work. It...

18th May 2016 by Nathan Pierce
When is stealing something the right thing to do? We learn from a young age that society frowns on the concept of stealing. Yet, in the case of the Horizon 2020 programmes, I would argue that we should actively borrow from each other, with transparency and with pride, in order that we can combine,...
19th January 2016 by Graham Colclough
If there was one city that should be able to deliver on such a bold goal then it would be London – the city with more financial muscle than most. The good news is that this goal is one that is shared. It is one of ten bold goals that are shared with Lisbon, Milan (as lead cities) supported by...
4th January 2016 by Alan Lewis and Ben Corr
In 2013, the GLA launched the London Schools Atlas. This was a ground-breaking new resource for parents, planners and policy makers – providing a unique view of patterns of attendance across the capital’s schools together with a wide range of contextual information. Two years on from release, we...
13th November 2015 by Gareth Piggott
Data viz by AnhTu Phuc Hoang uses data contained in the London Borough Profiles. It is described as an open-data intiative mapping municipal data on to mobile for the benefit of people to live even better in cities. Click on a red pin to reveal data about the area.

13th October 2015 by Alan Lewis
We haven’t checked but it’s a fair bet that the words big, data, smart, and analytics would appear in the top 10 most frequently used words in our Datastore blog posts. With this in mind we’d like to share an example of a project from across the pond that certainly ticks all these boxes, whilst...

8th October 2015 by Gareth Piggott
This data present the average daytime population on a weekday during term-time. The dataset is available on the datastore. The population of London swells to over 10 million people on an average day. Around 2 million people, or around a fifth, are in just three local authorities – Westminster, City...

24th September 2015 by The City Data Team
Everyone has a transport app on their phone nowadays – they’ve been extraordinarily successful. But what’s next? What are the new combinations of data that will transform our lives and drive successful new businesses, products and services? We at City Hall have been working with London-based startup...
28th August 2015 by Madalina Ursu
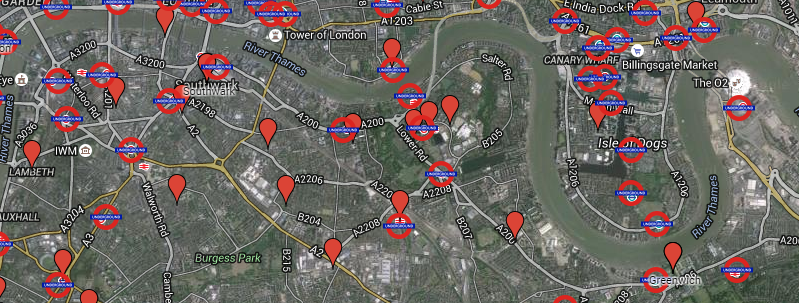
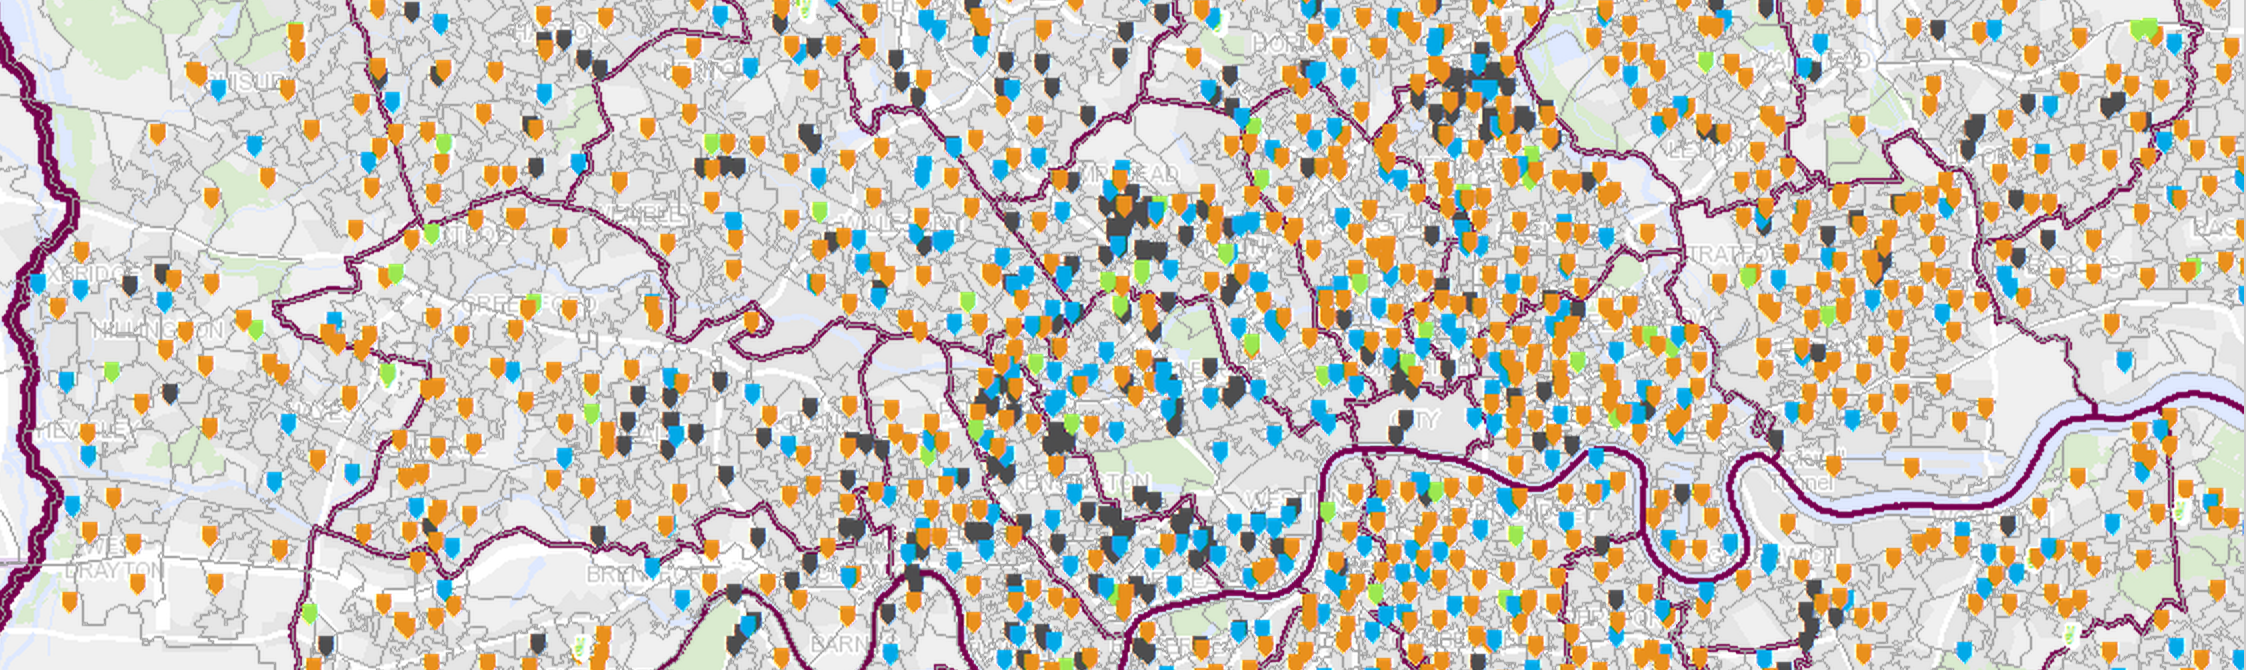
Today we publish a first version of the London infrastructure map. UPDATE: April 2016 now replaced by guest version of the Infrastructure Mapping Application (IMA). The aim is to create a database to better understand the phasing of projects, the synergies and tensions that arise when looking at the...

19th August 2015 by Fran Bennett
As I mentioned in my previous blog post, Mastodon C is working together with the Greater London Authority to develop a flexible approach to city modelling. The aim is to take forecasting beyond the limitations of Excel, while providing modellers with the benefits of sophisticated data management...

11th August 2015 by Andrew Collinge
We need to make smart cities and smart government real. To do so, we need to take city data seriously, and give shape to a complex marketplace. An elderly man sits comfortably in his housing association flat. As usual, his son is having a busy day. Both are content that (aided by an integrated...
27th July 2015 by Larissa Suzuki
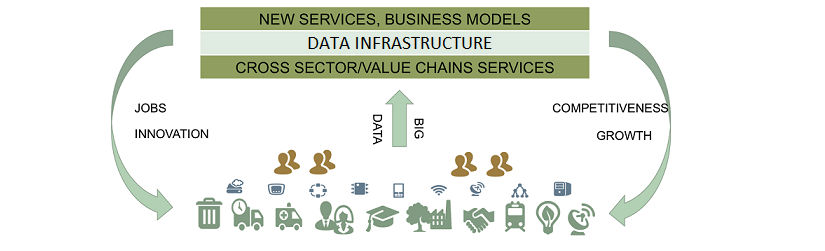
The need for data infrastructures (by this we mean data platforms, marketplaces, open data portals and so on) for smart cities is well established. Cities of today must be prepared to cope with population growth, scarcity of natural resources and environmental issues. The answer to these problems...

20th July 2015 by Larissa Suzuki
The modern city should provide an environment in which information flows rapidly and easily, making of itself a platform for both the dissemination and active consumption of innovation to improve the way it works and peoples’ lives. It needs to. Every day nearly 180,000 people move to cities,...

18th June 2015 by Gareth Piggott
Data from the Valuation Office Agency on build period, or age of property, has been used to create 12 property build period categories. The report below uses Tableau to present some of this data at both MSOA and borough level. This geographical presentation highlights that a high proportion of the...

15th June 2015 by Gareth Piggott
Average Floor Area Cartogram maps showing the average floorspace by borough for all properties, houses and flats added to the energy certificate register between Q1 2012 -Q1 2015. Houses include Bungalows, Flats include Maisonettes. The register records information about the certificates issued for...

11th June 2015 by Andrew Collinge
I spoke at the Hypercat Summit earlier this week. I suffered the shame of being buzzed out when my allotted three minutes were up, so here is my talk, published in full…. I will be straightforward. I want to see a range of actors in this city aware of and organised around the sharing and...

9th June 2015 by LarryAlton
London has long been known as one of the busiest cities in the world, and it would be difficult for it to function without Transport for London (TfL), which runs a network of footpaths, roads, cycle paths, buses, trains, taxis, and ferries. Millions use this service every day, which makes planning...

8th June 2015 by Gareth Piggott
London Tube Stats maps by Oliver O’Brien from UCL CASA data about how the London Underground is used – how many people use each station at various times of the day, and where they go once they are on the tube. The main view shows the entry/exit data, by time of day, for 2003-2012. Choosing an option...
29th May 2015 by DataPress
The London Schools Atlas is a real triumph of the city data agenda. It illustrates perfectly the power of accessing previously locked up data and using it in innovative ways to help solve real world public policy problems.For context, planning the provision of sufficient school places for London’s...
26th May 2015 by Unknown
At a time of constrained finances across all sectors of service delivery, getting resource allocation right is of paramount importance. Of equal concern are the costs associated with acquiring the evidence needed to make those informed decisions. Therefore, the ability to understand the...