
From Waste comes Value: Transferring New York’s expertise on waste-related Analytics
We haven’t checked but it’s a fair bet that the words big, data, smart, and analytics would appear in the top 10 most frequently used words in our Datastore blog posts. With this in mind we’d like to share an example of a project from across the pond that certainly ticks all these boxes, whilst proving the value these things bring when they are brought together by some bright academic minds.
Back in 2011, New York Mayor Bloomberg put out a call to the world’s universities to build a new urban science campus to address the world’s pressing urban challenges. The result was the Centre for Urban Science and Progress (CUSP): a science institute dedicated to using data to create solutions to city challenges. One such challenge that merited investigation was New York City’s waste. Working with the NYC Department of Sanitation CUSP researchers (Ghandehari, Johnson et al) attempted to predict the daily waste generation across the city at building lot (i.e. super-local) level – pretty ambitious stuff. Importantly, with 11 years of daily waste collection data, they have very powerful set of ground truth results!
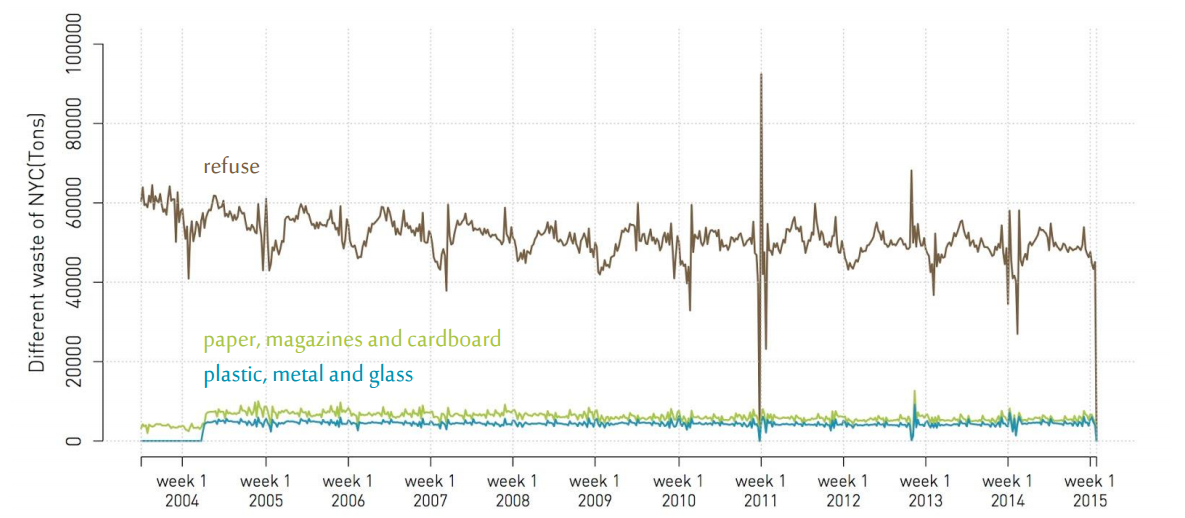
Temporal fluctuations of refuse and recycling in NYC.
They combined this with a range of other datasets they thought could affect the estimation of waste generation – weather, holidays, disaster, population, income and housing tenure – and applied machine learning techniques to look for patterns. The result was a regression model which assessed the relative importance of these criteria and predicted the waste each household would produce. An invaluable piece of information when trying to drive changes related to front line service delivery – think both allocation of resources and behaviour change:
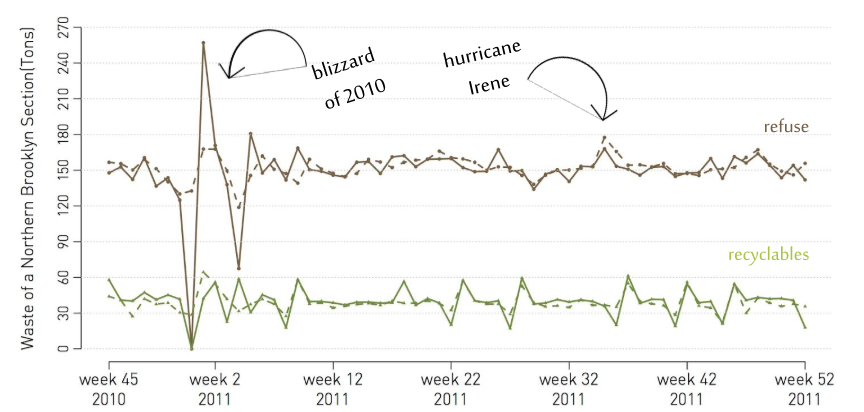
Predicted versus actual waste data over a year.
The model now provides them with a powerful tool that can help estimate future service demand in the short (events), medium (seasonal variations) and longer-term (new housing developments). Furthermore, given that the academics knew the amount of waste collected they were also able to estimate the number of refuse trucks that were actually required on the collection rounds, to improve the efficiency of collection routes around the city.
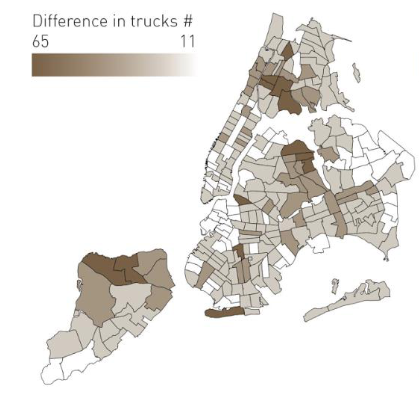
Estimated difference in waste collection trucks.
We think this a great example of how (big) city data can be practically used to really drive decision making and improve resource allocation and the efficiency of front-line services. All the clever code produced by CUSP is openly available on GitHub (a store to share open-source software projects).
So all the tools are at our disposal. Our issues are largely the same as New York’s; and they certainly are from one London Borough to the next – data analytics at this level must be investigated as a means of eeking out service efficiencies, and exploring new business models and means of influencing the behaviour of residents and businesses alike. Shall we do something similar for London? All interested Boroughs, please step forward.
All credit and thanks must go to our colleagues at CUSP for allowing us to share this work with you all. Click below to explore a web map of the results: