
New population projections for London - building on the results of the 2021 Census
Each year the GLA demography team publish population projections reflecting the most recent available data. Our 2021-based interim projections, published at the end of January, are the first to incorporate updated estimates that build on the results of the 2021 census.
A summary report and detailed outputs from the 2021-based projections are available for download from the London Datastore, together with short downloadable summaries of the results for each of London’s 679 wards. Full local authority results, covering all of England and Wales are available in the detailed outputs file.
These projections are the first we’ve published for London’s updated electoral wards, which will make them more relevant to users (but also take us a little longer to update the Projections Explorer with the results).
Rather than resummarise the information already covered in the results document, I wanted to use the rest of this post to provide some additional background and commentary aimed at helping prospective users interpret the projections and make better informed decisions about if and how they should consider them in their work.
What makes these projections ‘interim’?
The projections were produced during a period when much of the data that underpins our models are in a state of flux. The release of results from the 2021 census is ongoing and the process of reviewing and rebasing official annual estimates to be consistent with these is only just beginning. A complete set of updated official estimates aren’t due until November 2023, when ONS’s rebasing work concludes with the release of a revised population series for small areas. Until then, the available data will contain various gaps and inconsistencies.
We’ve badged the projections as ‘interim’ to reflect both the limitations of the data available at the time they were produced, and the fact that we expect a steady trickle of relevant new data to be released over the coming months, some of which has the potential to be used to update the projections (or at least reveal shortcomings of data used in their production).
Why are the results lower than in previous projections?
For anyone who has been paying attention to population statistics over recent years, it will come as no great surprise that the latest results point toward significantly lower population growth in London than those produced just a few years ago.
There are several factors that together explain why this is the case:
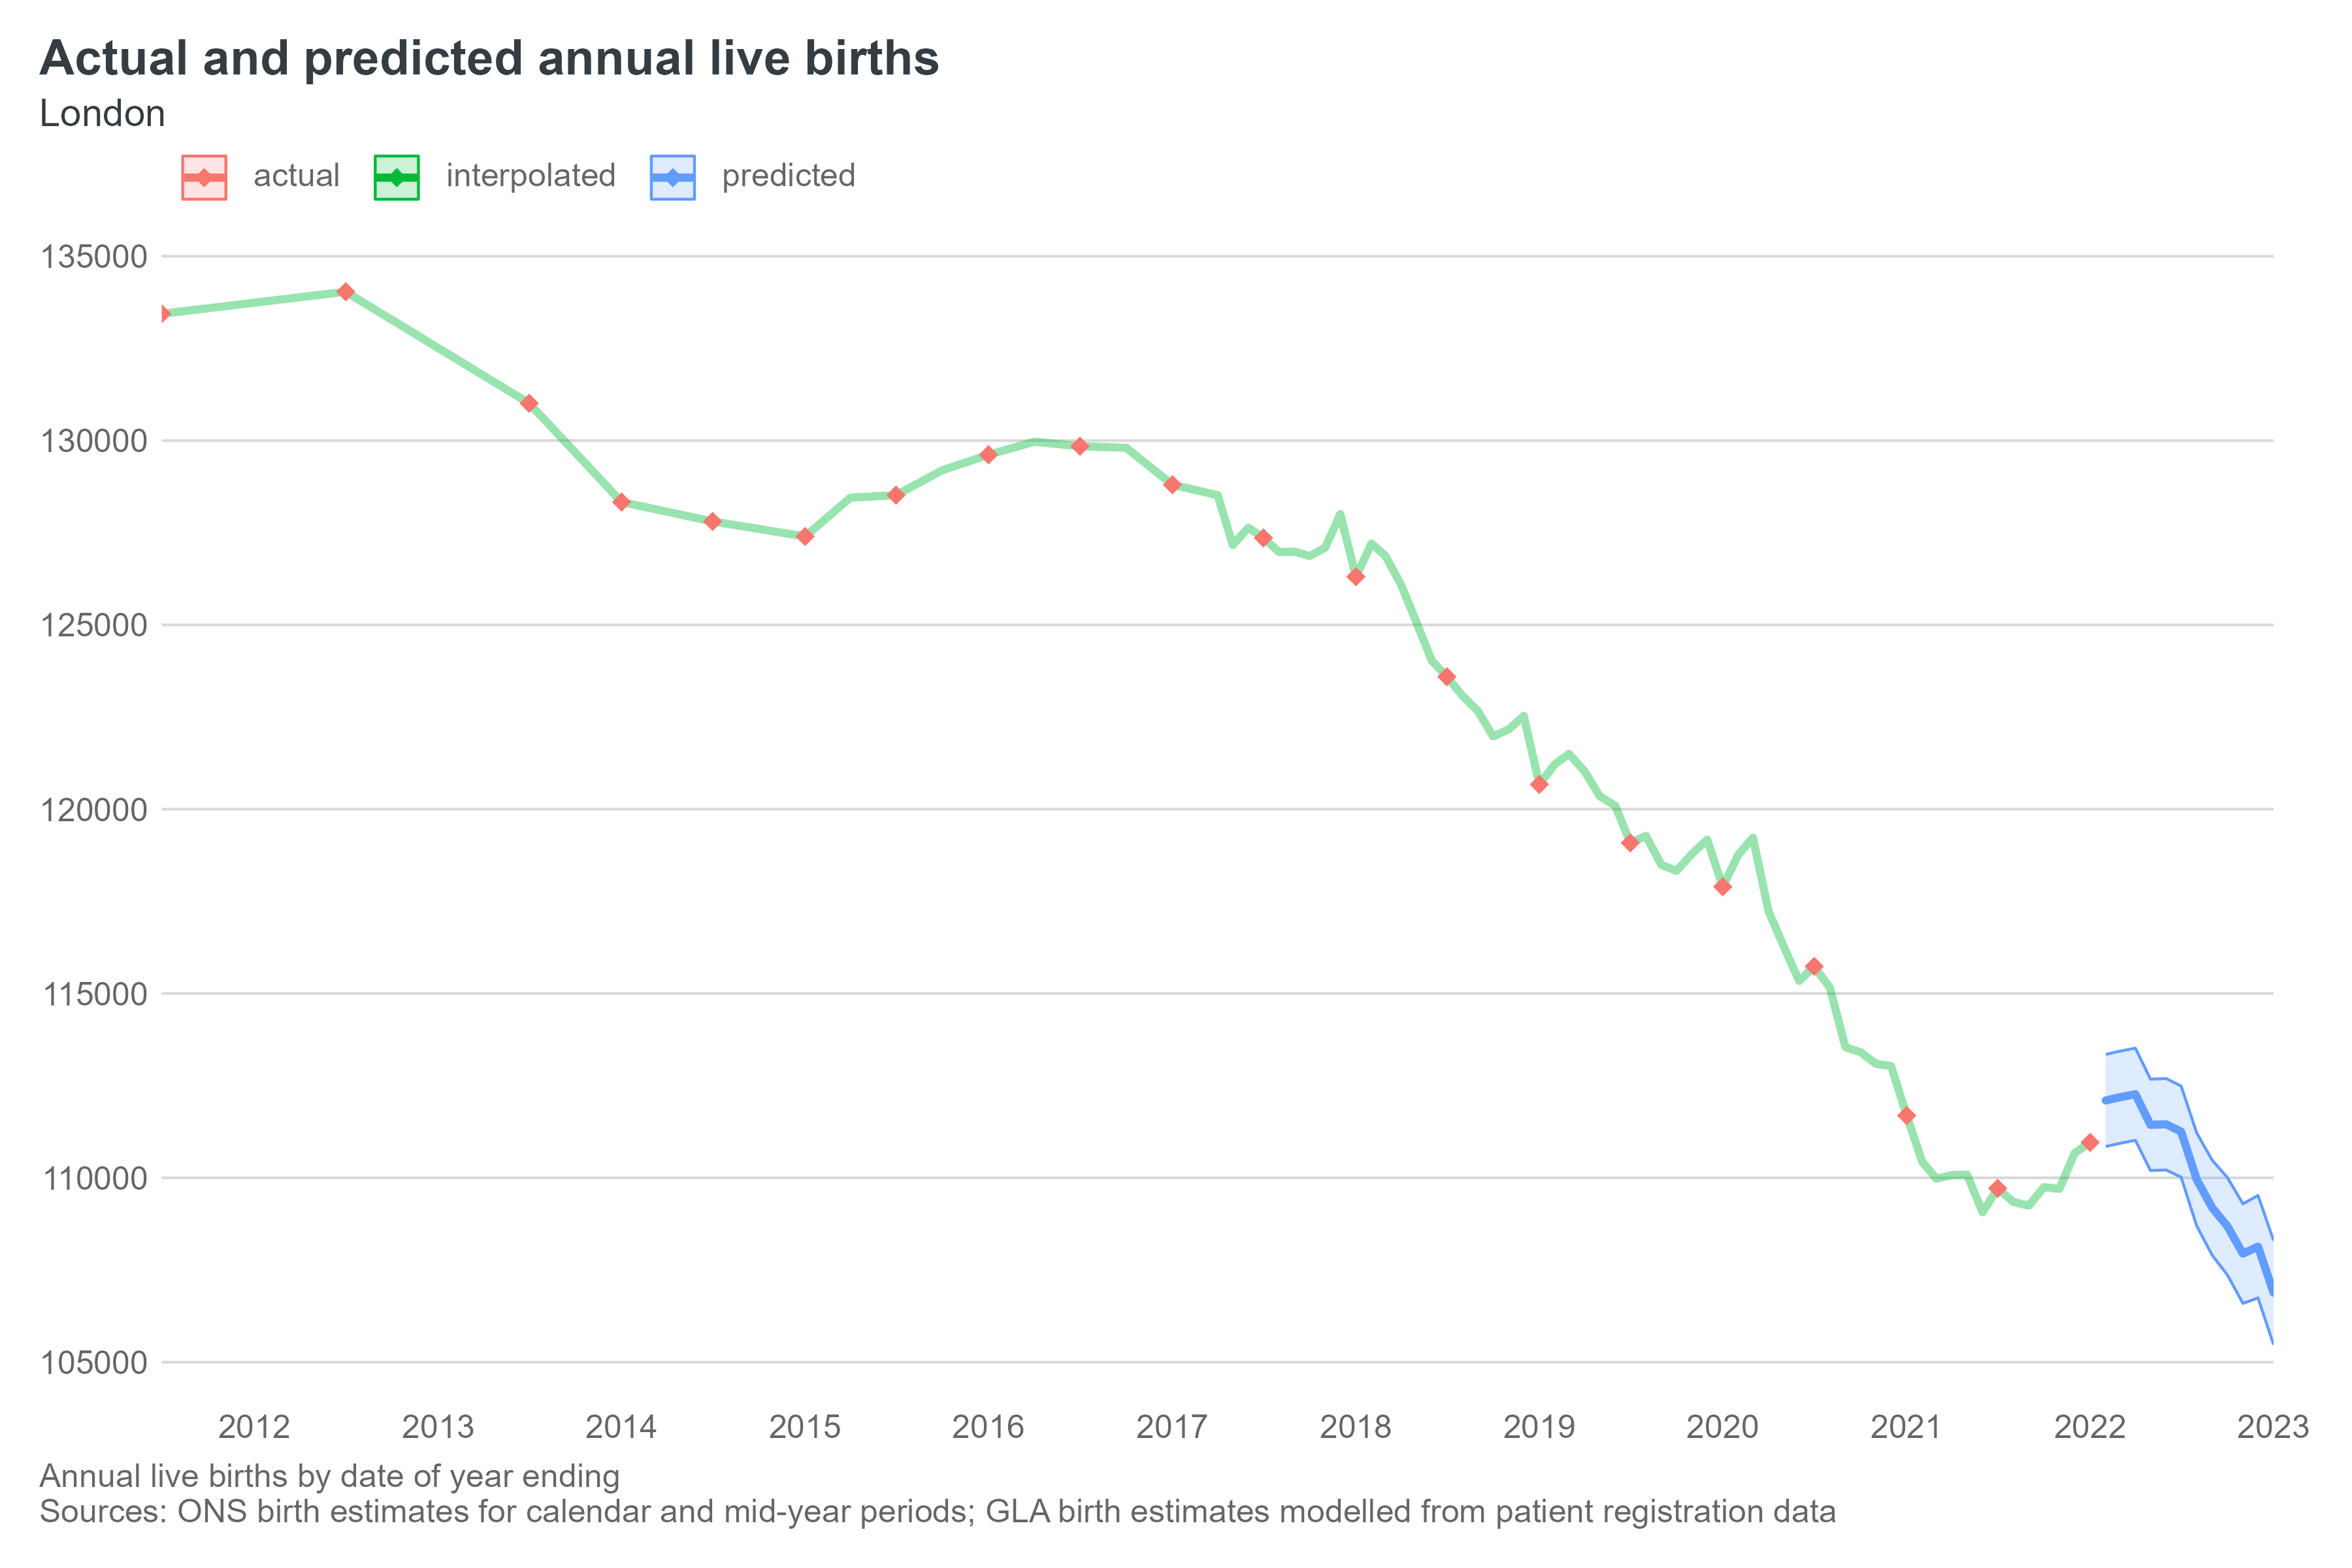
1. London’s population growth slowed markedly after 2016. This was result of a combination of factors: falling birth rates, a drop in international migration (due in part to Brexit), and the recovery of domestic outflows after the disruption of the 2008 Financial Crisis.
2. Impacts of the COVID-19 pandemic. The pandemic not only caused tens of thousands of deaths, but had a huge impact on migration flows to and from London. The latest data from ONS estimate a net outflow of close to 130 thousand people from London in the year to mid-2021.
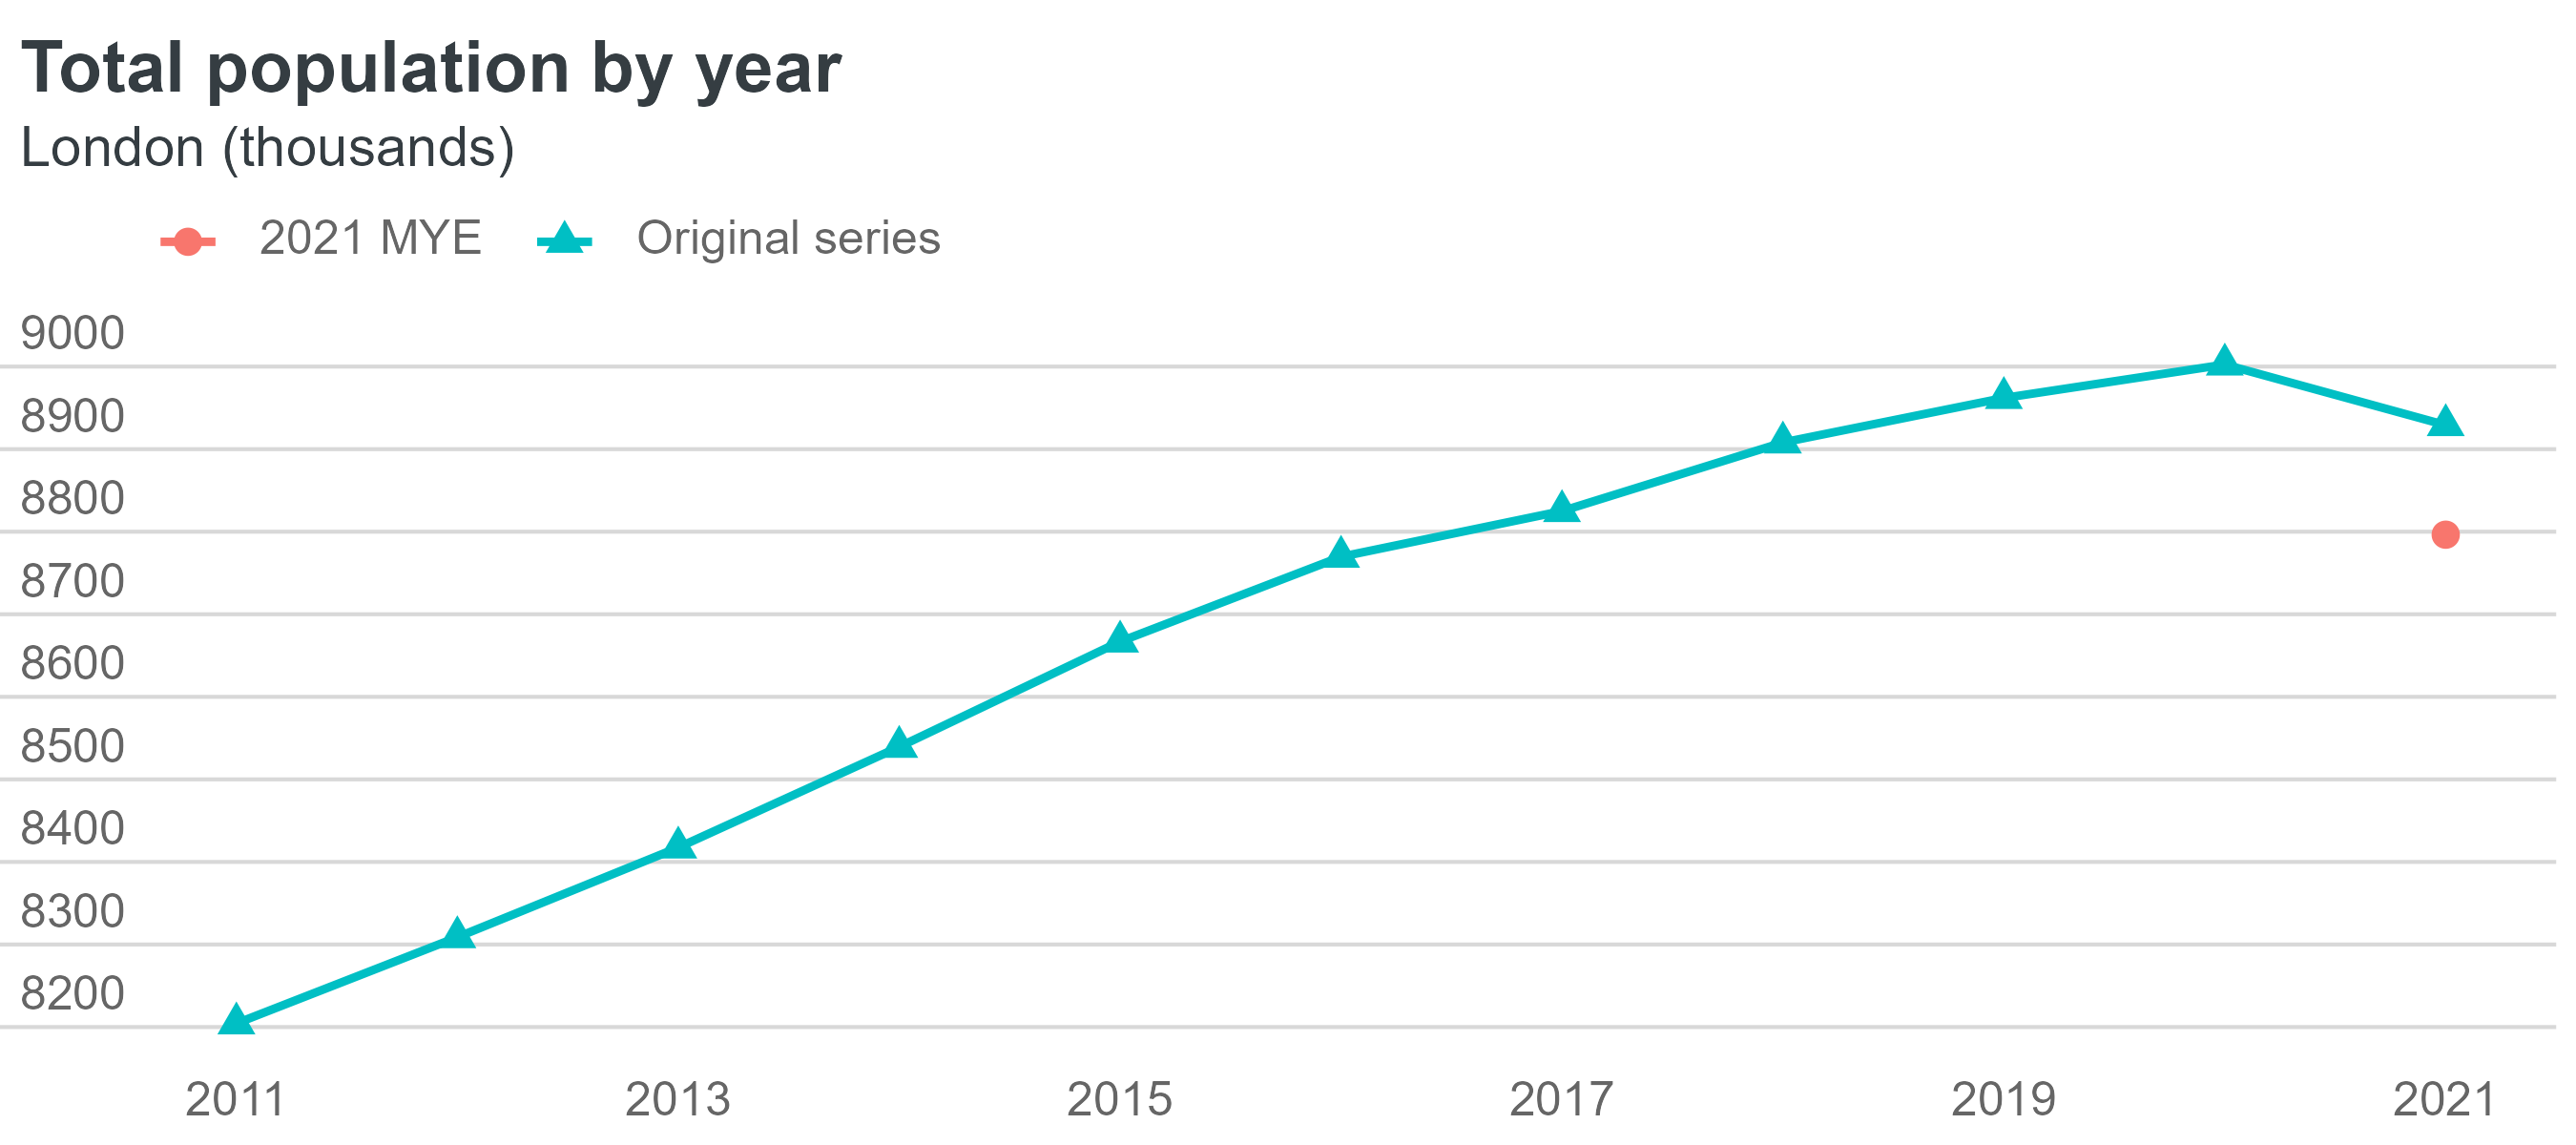
3. Downward revision of official estimates following the census. After rebasing to account for the results of the census, ONS’s estimate of London’s population in mid-2021 was 133 thousand lower than it would otherwise have been.
The net consequence of these factors is that the 2021-based projections are not only starting from a lower point than was the case in previous rounds of projections but do so on the back of lower recent growth trends.
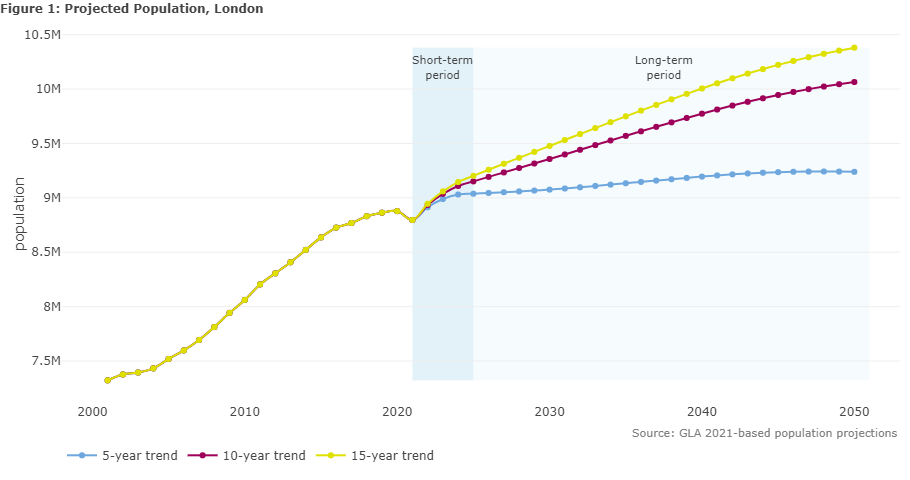
The three trend variants we have published – based on 5, 10 and 15 years of past migration trends – give projected populations for London in 2041 that span a range of 9.2 to 10.1 million. Compare this with the equivalent figure from the 2016-based projections which spanned 10.5 to 10.9 million. This is a big shift, but there are a few things to keep in mind when considering the latest projections:
1. They don’t fully account for the expected 2022 ‘rebound’. Provisional estimates for the UK published by ONS in November, indicated a record net inflow to the UK of 504 thousand long term international migrants in the year to mid-2022. While we added a temporary uplift to migration at the start of the projection period, any increase won’t get factored into projected long-term trends until it shows up in the 2022 MYE. If the provisional national figure translates into a big increase for London, then expect to see this reflected in stronger migration trends in our 2022-based projections.
2. The 5-year trend variant probably can be treated as an outlier. This variant projects forward exclusively on the basis of migration trends from a period dominated by the combined impacts of Brexit and the pandemic (up to, but not including the anticipated rebound). Expect this variant to see a significant uplift in future rounds of projections.
3. There’s a chance the 2021 MYE could be revised upwards. ONS has signalled that they expect to revisit the 2021 estimates later this year. Given the potential for young adults to have been underrepresented in the estimates, a modest upward revision for London certainly seems feasible. Any upward revisions to the 2021 figures would translate into both a higher starting point and stronger projected trends for the projections.
The 2021 challenge: building a better backseries
When producing projections, it is necessary to not only know what the starting population is, but also how it got to that point. So, while the new 2021 mid-year estimate (MYE) provides us a new base to project forward from, for the projections to be coherent we also need a consistent series of past estimates from which to extrapolate future trends.
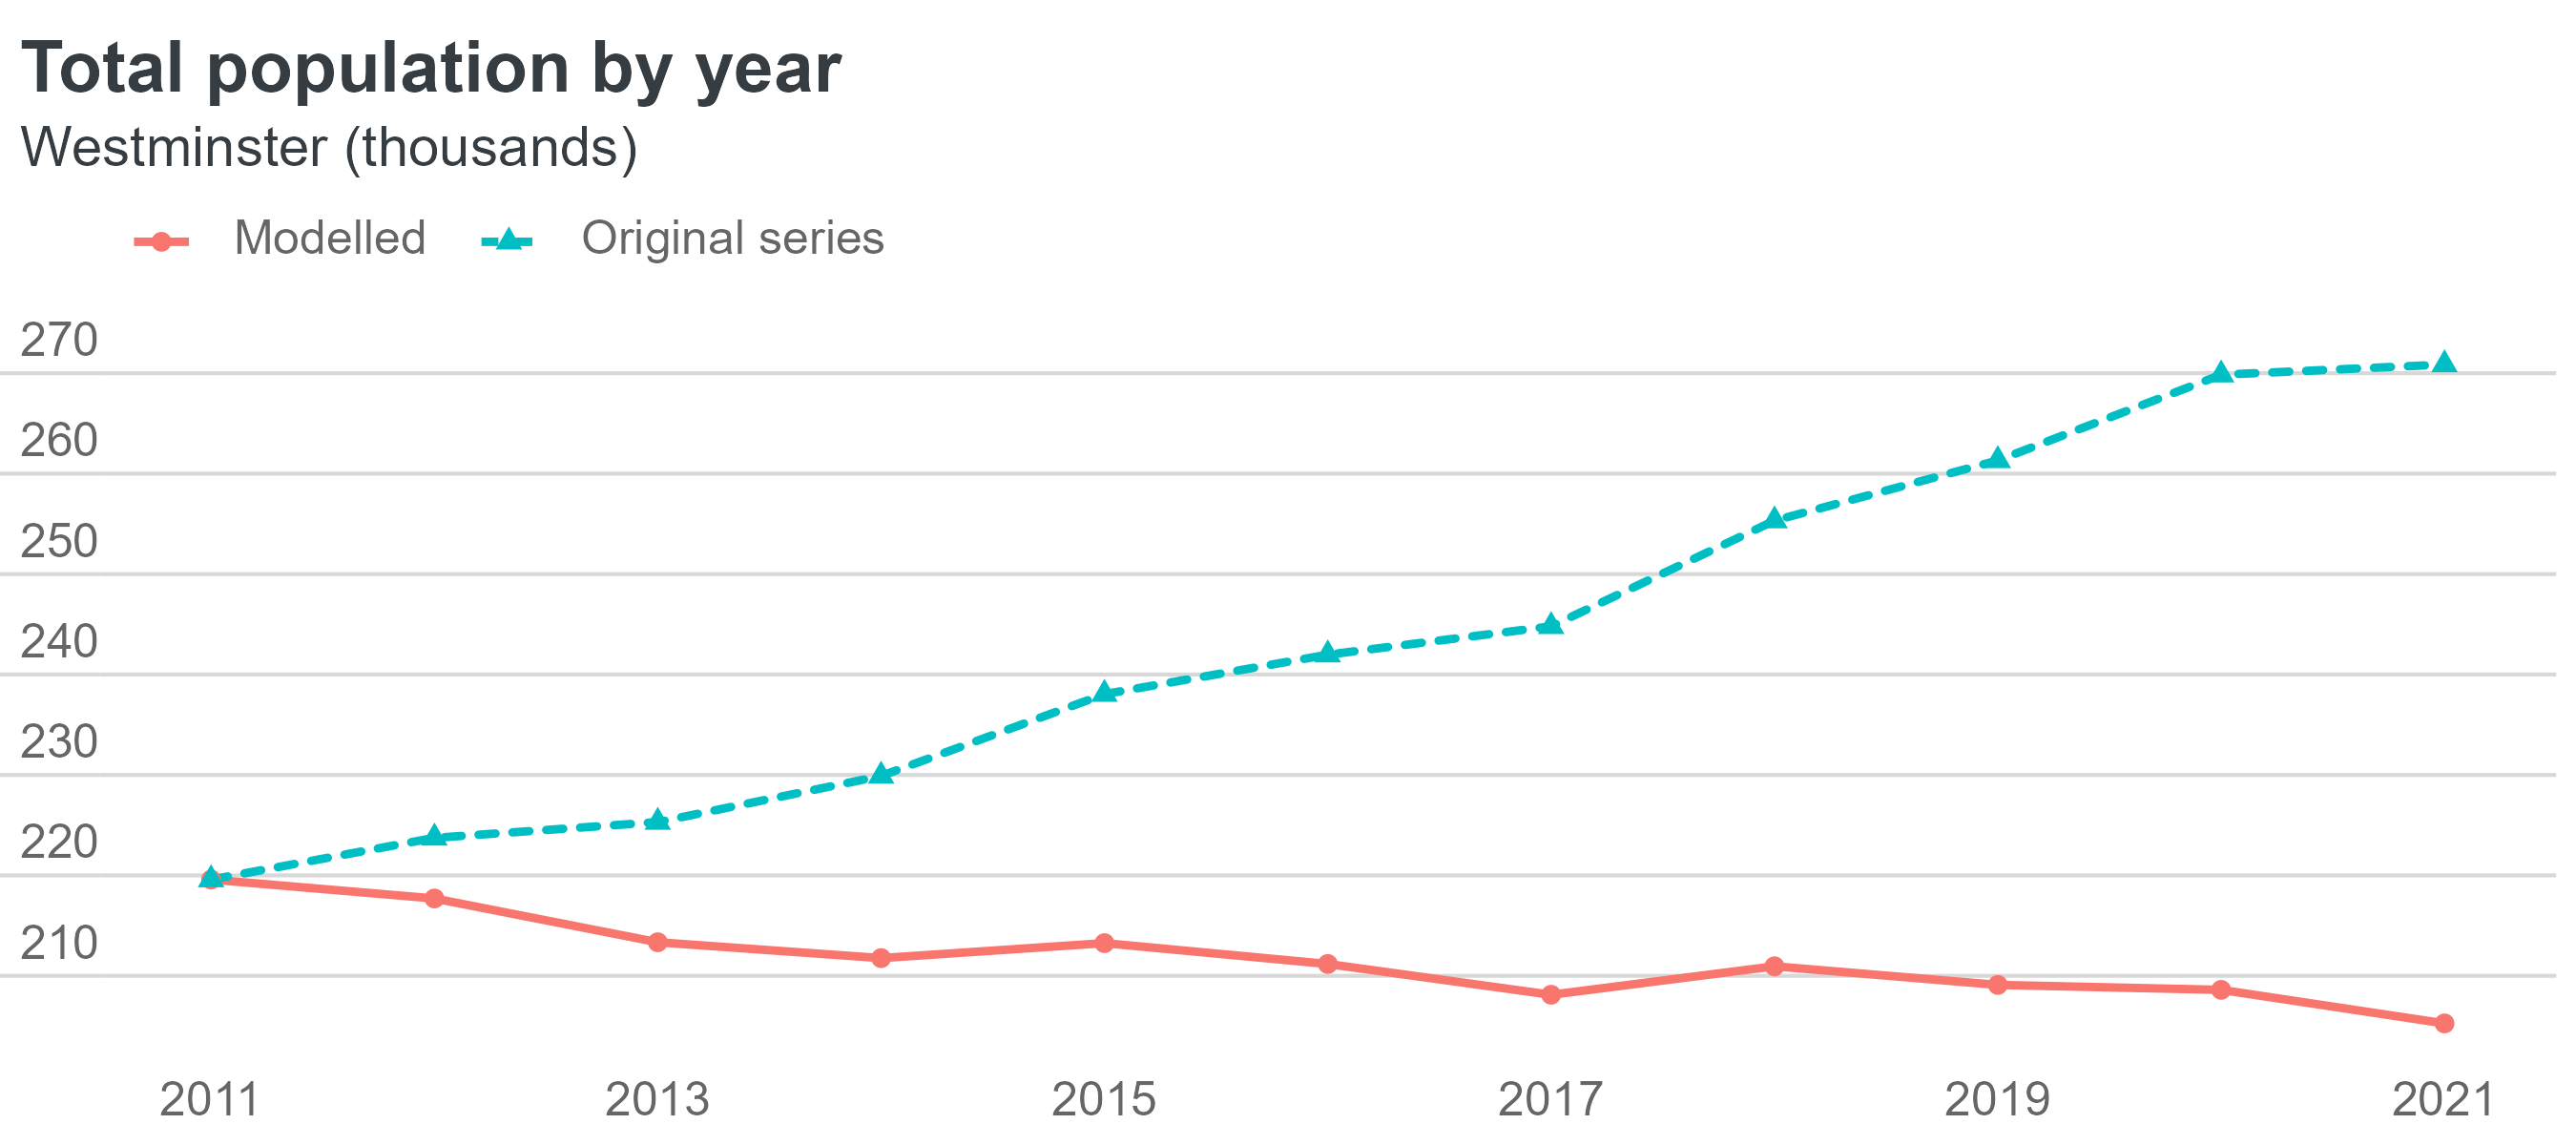
Many local authorities saw large disparities between their original estimates and the 2021 MYE, with some of the most extreme cases being in London. Taking Westminster as an example: the original estimates series showed the population of Westminster growing by 51 thousand (23 percent) over the decade, whereas the 2021 MYE showed a decrease of14 thousand (6 percent). The difference in the total populations is very large (65 thousand), but this masks the true scale of the disparity between the estimates which becomes more apparent once the figures are broken down by age and sex.
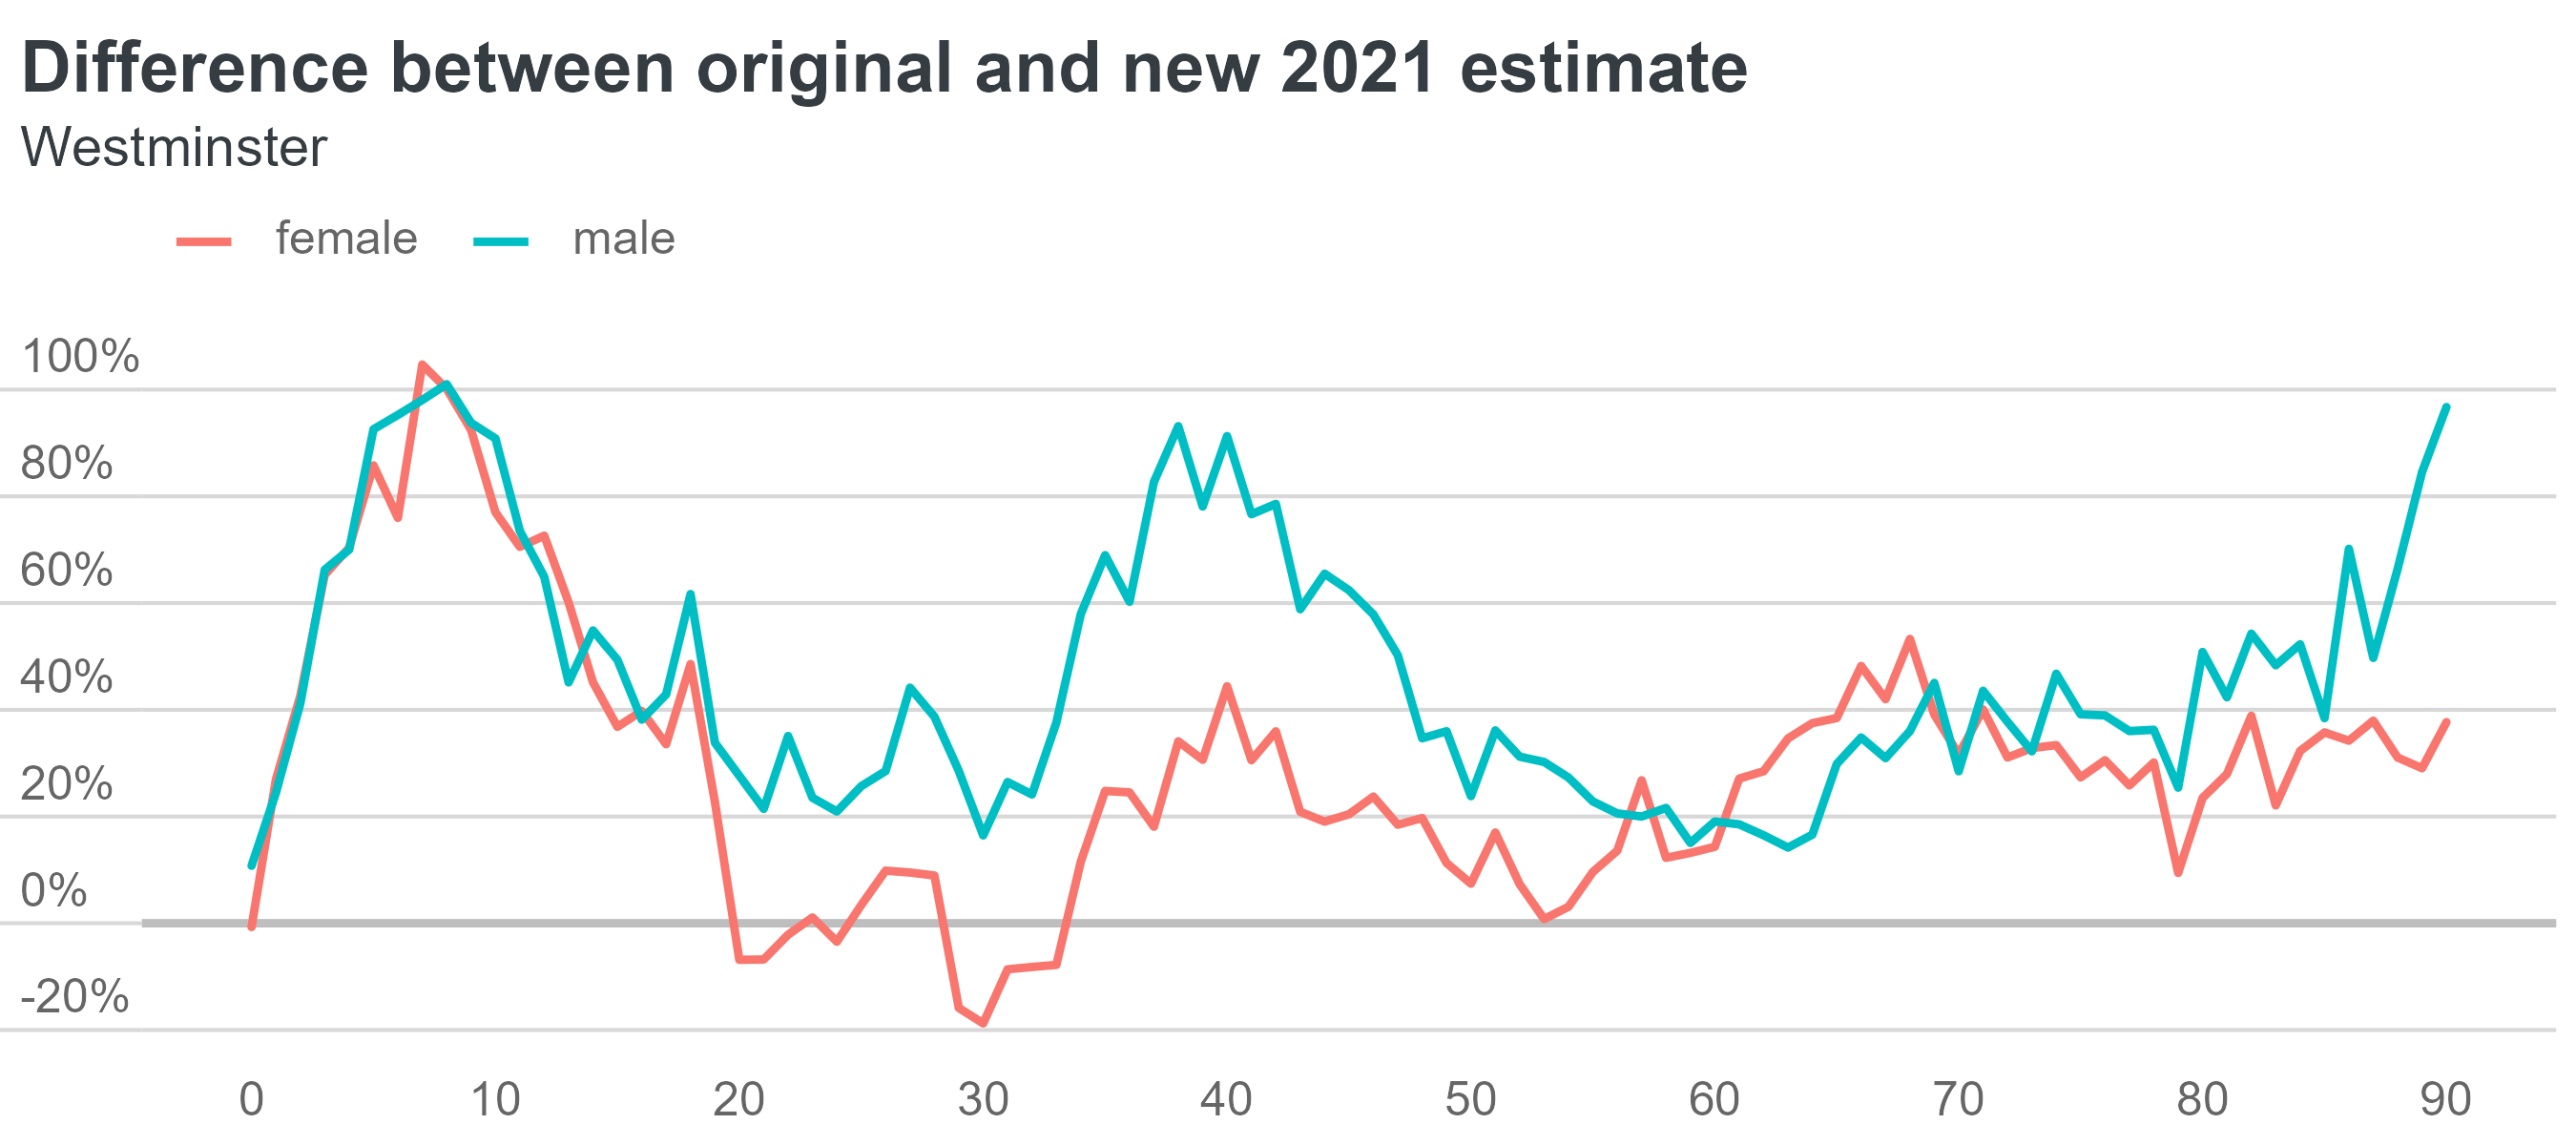
While some of this difference might be explained by pandemic-linked issues with the 2021 census, the majority is the result of ten years of compounding errors in the original estimates series. Clearly using trends from the original series as a basis for projecting forward from the new 2021 starting point isn’t going to yield coherent results.
To address this problem, we created a whole new series of annual estimates that are not only consistent with the 2011 and 2021 estimates but also get between these points in a realistic manner. These alternative estimates form the inputs to our projections.
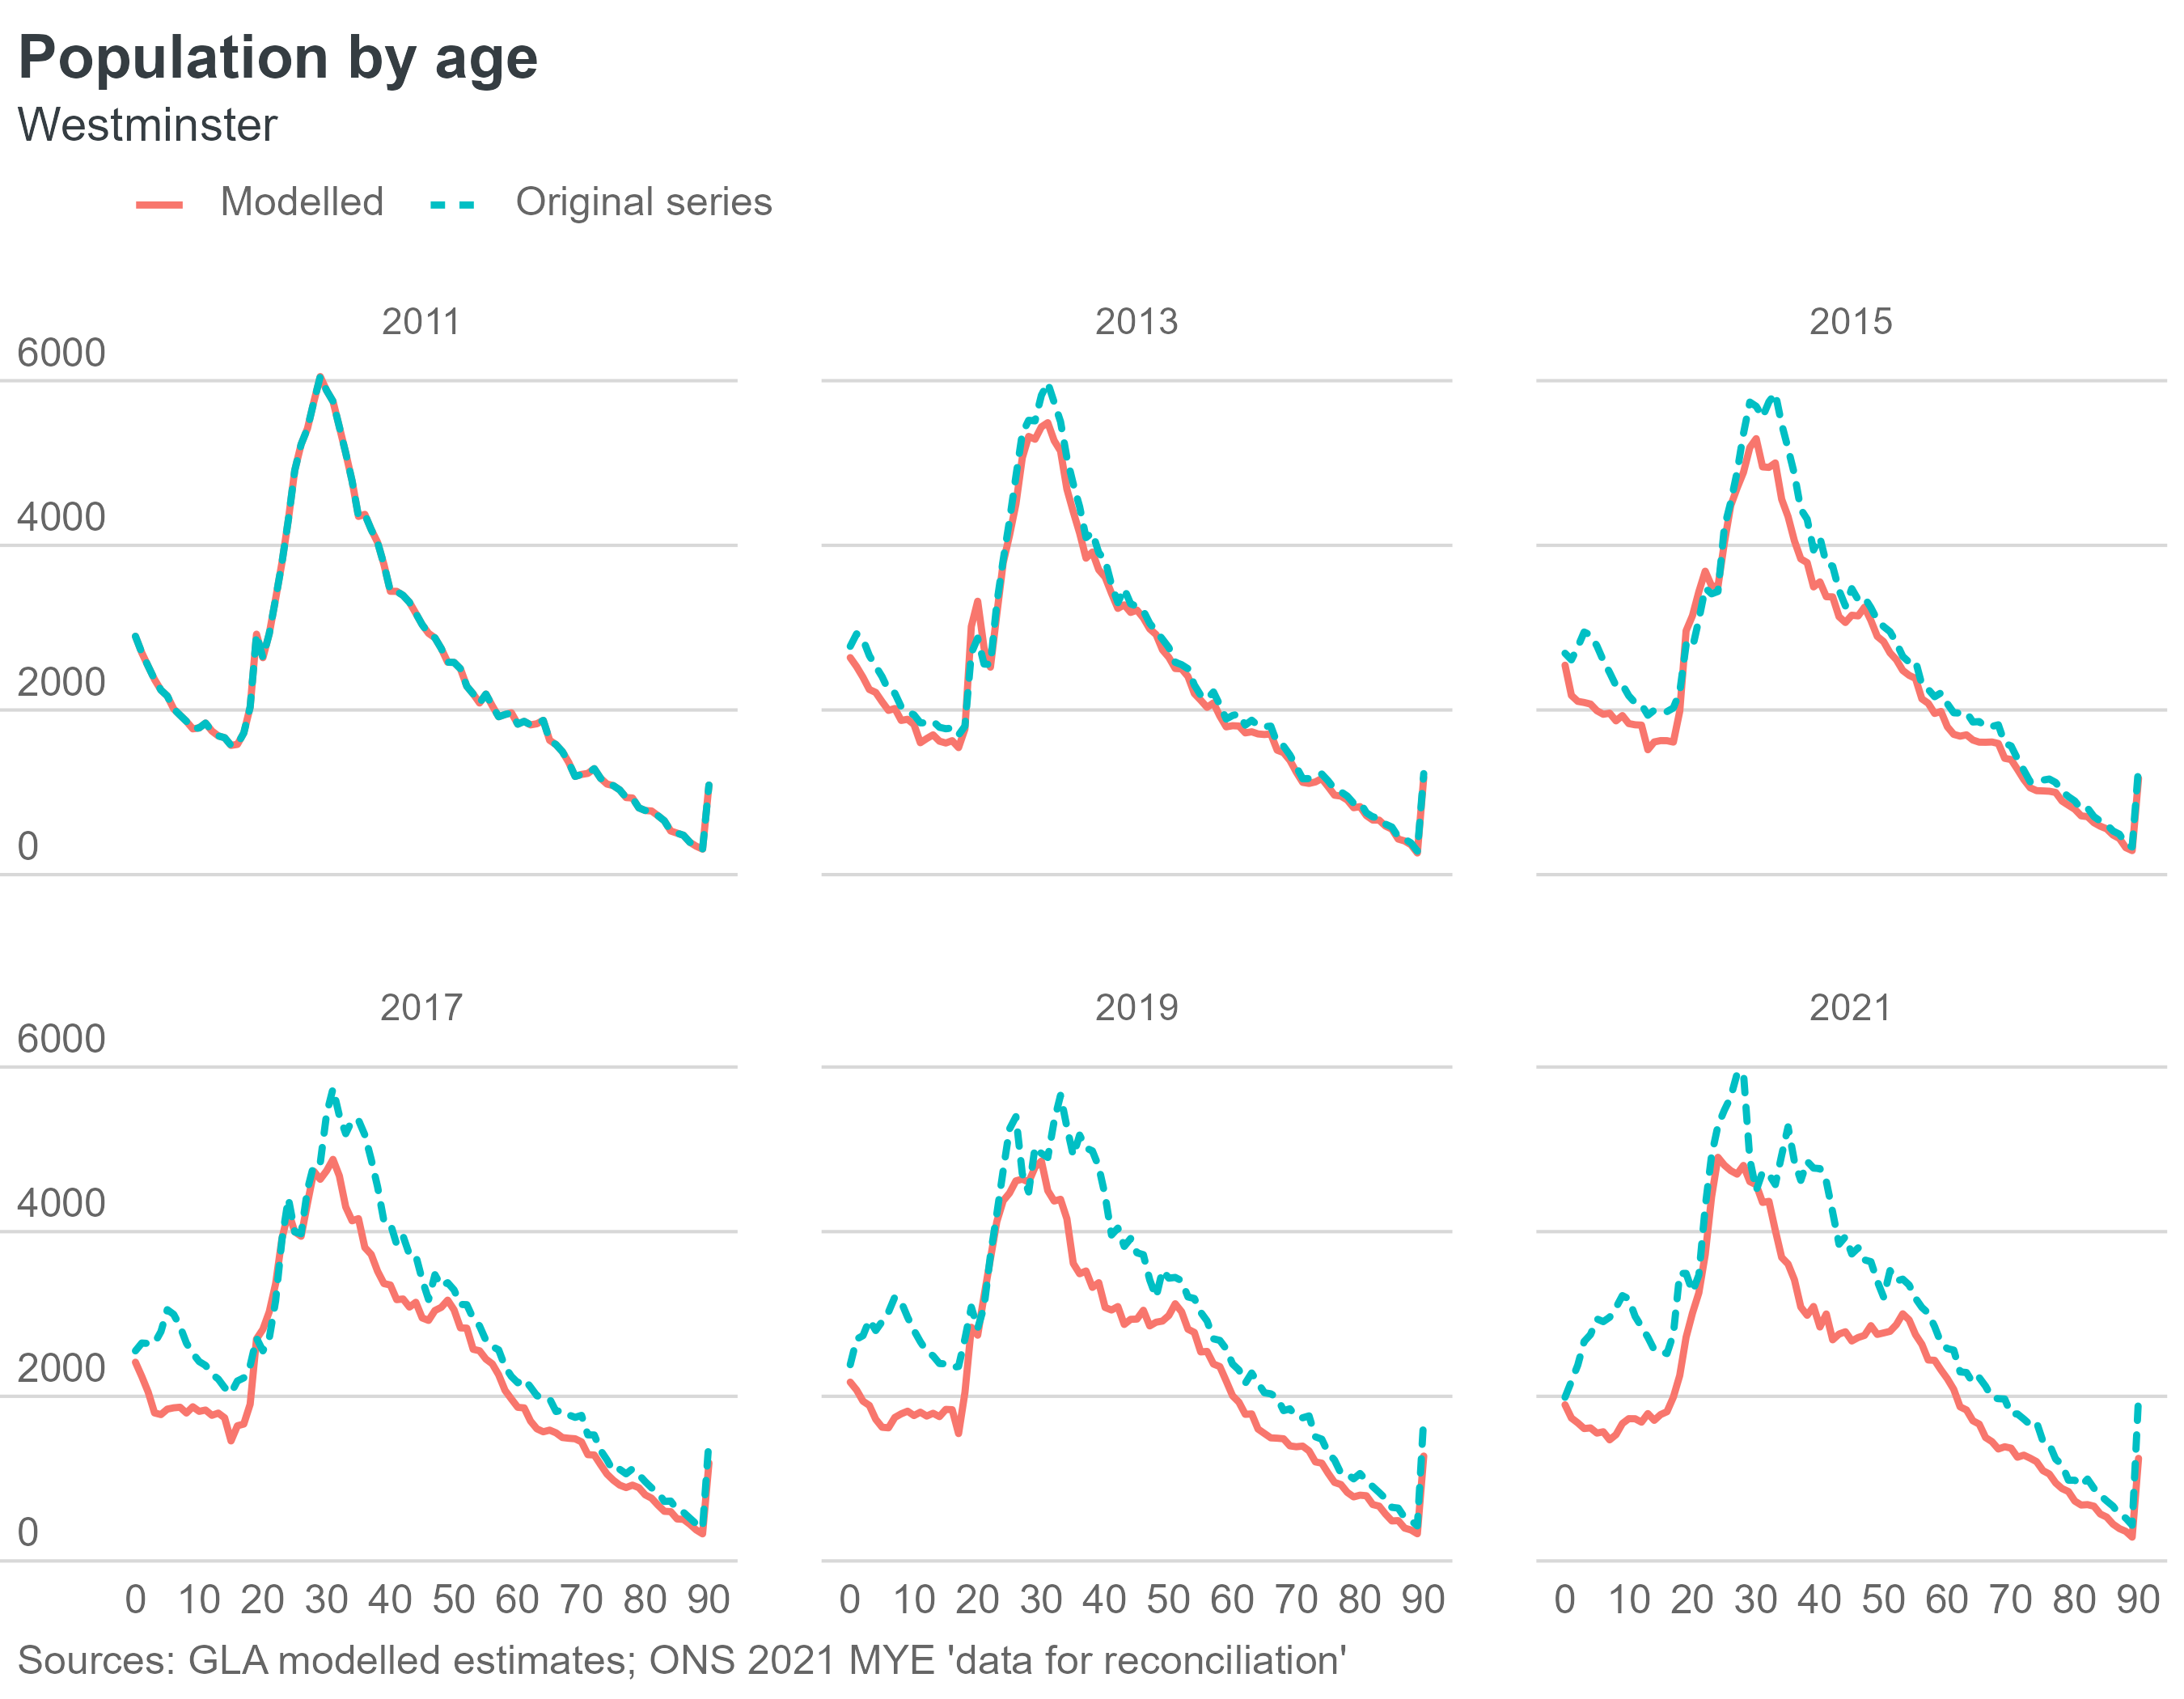
Creating a decade’s worth of detailed annual estimates for every local authority and output area in England and Wales was a significant undertaking, but it’s one we had anticipated and planned for. Over the last year we invested time in developing a set of tools and methods that allowed us to rapidly turnaround both revised estimates and new projections following the release of the 2021 MYE on 21 December.
The details of how the estimates were created is beyond the scope of this post (and probably of niche interest), but we’ll be providing them, together with the code we used, in an upcoming technical note.
And finally…
I’d like to take this opportunity to acknowledge the contribution of Wil Tonkiss. Wil has been my main collaborator on the projections work for many years, managing both the development of our codebase and the delivery of outputs. The publication of these projections marked a final hurrah for Wil before he departed the GLA last week.
We’ll be looking to recruit Wil’s successor in the coming months. If you think that could be you, then keep an eye on our vacancies page or get in touch to find out more about the role.