
The 2017 General Election - the numbers behind the result
It feels like groundhog day as Britain went to the polls and produced a result that few saw coming. Read below for some analysis of what happened and a link to download the results in full.
The 2017 General Election has resulted in a hung parliament, with no party able to win a majority of the 650 seats in the House of Commons. The Conservatives, widely tipped for a landslide victory at the beginning of the campaign, won 318 seats – down 13 seats from the previous election and 8 short of the 326 needed for a majority. Meanwhile Labour, who were initially expected to lose seats, won 30 more than the 2015 election bringing them up to 262 seats. This was however still 64 seats short of a majority.
Figure 1: Interactive maps and charts showing the 2017 General Election results
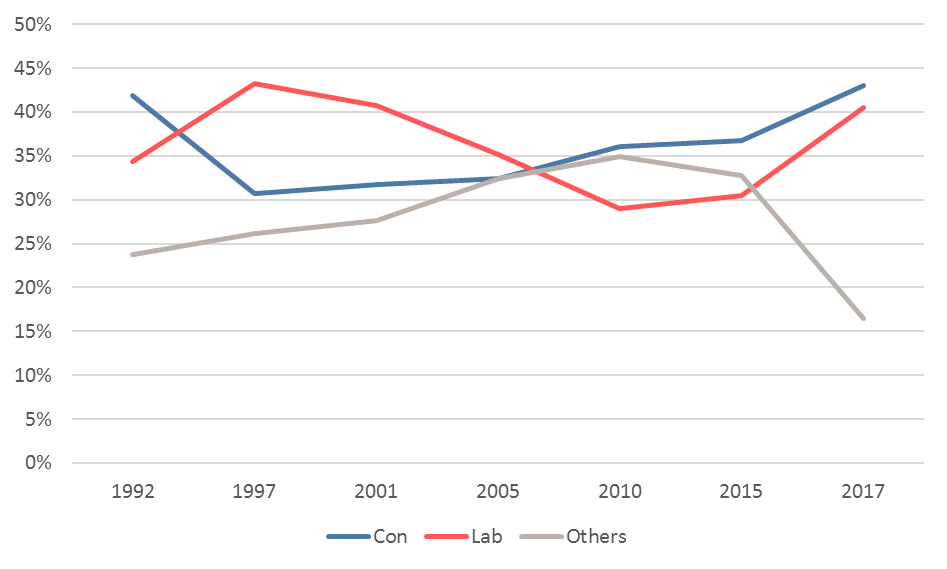
Despite a drop in the number of seats, the Conservatives actually saw a rise in vote share (up 5.5% points to 42.4%). Labour’s vote share rose at an even greater rate (up 9.5% points) and now sits at 40.0%.
Many of the smaller parties did not fare as well when compared to the previous election. SNP lost 21 seats and almost halved their vote share while UKIP’s national vote share dropped from 12.6% to 1.8%, failing to win any seats in the process. The Liberal Democrats gained 4 additional seats despite their vote share dropping by 0.5% points. Overall the percent of people who voted for a party other than Conservative or Labour almost halved from 32.8% in 2015 to 16.5% two years later.
Figure 2: Vote share in the United Kingdom by year
In London, Labour’s improvement was even more marked winning 4 additional seats including safe Tory seats in Kensington and Battersea. In fact over half (55.6%) of Londoners voted for Labour, up 10.9% points from 2015.
The Liberal Democrats also performed better this time around, winning back two of the seats that they had lost in 2015. Their vote share also increased slightly to 8.8% (up 1.1% points).
Meanwhile the Conservatives won 21 seats, however this was down from 27 in 2015. Their vote share also dropped to 33.1% (down 1.7% points).
Figure 3: Seats won and vote share in London by party
| Party | Seats | (+/-) | Vote share | (+/-) | |
|---|---|---|---|---|---|
| Labour | 49 | +4 | 54.5% | +10.8 | |
| Conservative | 21 | -6 | 33.1% | -1.7 | |
| Liberal Democrats | 3 | +2 | 8.8% | +1.1 | |
| Green Party | 0 | 0 | 1.8% | -3.1 | |
| UKIP | 0 | 0 | 1.3% | -6.8 | |
| Other | 0 | 0 | 0.5% | -0.2 |
Labour gained vote share in 71 of London’s 73 constituencies, losing vote share in only two. These figures are especially impressive when compared to the other major parties: the Liberal Democrats gained vote share in 39 London constituencies, losing share in 34; meanwhile the Conservatives gained vote share in 24, losing in 49. UKIP and the Green Party both lost vote share in every seat that they ran for.
Labour’s improvement was replicated across the country, gaining vote share in 97% of the constituencies they ran in (the same as the percentage for London). The Conservatives performed better outside of London, gaining vote share in 84% of all constituencies that they ran in compared to 33% in London. In contrast, the Liberal Democrats performed better in London gaining vote share in 53% of constituencies vs 34% nationally.
Figure 4: Percent of constituencies in which vote share was gained by party
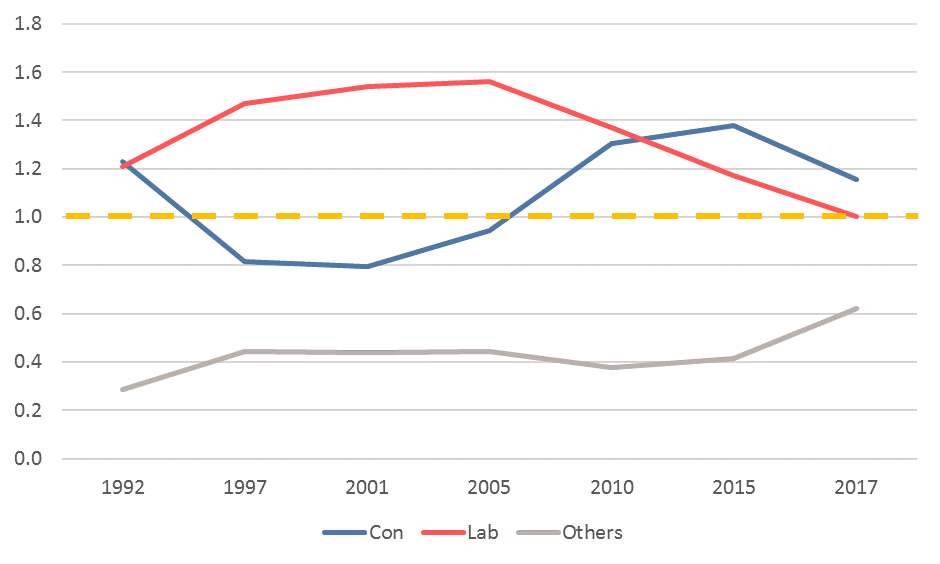
Traditionally, the two larger parties have won a higher share of seats when compared to the percent of the population who have actually voted for them. This year the Conservatives won 48.9% of the seats with 42.4% of the popular vote, giving them a seats to vote ratio of 1.2. Labour, however, won 40.2% of the seats with 40.0% of votes meaning their seats to vote ratio was 1.0. These ratio are in stark contrast to 12 years ago when Labour’s seat to vote ratio was 1.6 (winning 55.0% of seats with just 35.2% of the popular vote) and the Tories’ ratio was 0.9 (winning 30.7% of seats with 32.4% of the vote). The vote share for other parties rose in this election, however this is driven by a fall in votes rather than a rise in seats.
Figure 5: Votes to seats ratio in the United Kingdom, 1992-2017
The election was fought on many issues but, with the referendum on the UK’s membership of the European Union less than 12 months ago, one area that dominated the debate was the country’s approach to Brexit negotiations. This debate has divided the political spectrum in a different way to the usual left/right split. Indeed, over half of both the highest Remain and Leave voting areas were Labour constituencies showing splits within the party voter base.
Comparing what proportion of each constituency voted to leave the EU with party vote share doesn’t produce any particularly strong correlations (probably due to the multi-issue nature of a general election and Brexit itself) however comparing the correlation coefficients of each party may point to where they sit on the Brexit spectrum of Remain/”Soft Brexit”/”Hard Brexit” (or at least where the public perceive that each party sits).
UKIP vote share shows the strongest positive correlation with Leave vote share (CC=0.48) followed by the Conservatives (CC=0.37). The Liberal Democrats show the strongest negative correlation (CC=-0.30) with the Green Party (CC=-0.22) and Labour (CC=-0.19) also with negative correlations.
Figure 6: Correlation between the EU referendum and 2017 General Elections, England & Wales