
Preview of London employment projections (2024-based update)
GLA Economics has regularly updated trend-based long-term employment projections to inform policy making and city planning in London since 2002. A forthcoming publication will support the evidence base for the next London Plan, updating results to take into account changes in the outlook since the last London Plan evidence was published in 2017 and an interim update in 2022.
This supplement article previews the main assumptions and results.
About the projections
This update uses data available up to the end of 2024. It presents estimates of the number of jobs in London from 2025 to 2050, broken down by industry sector and local authority.[1] The full report presents a central (baseline) projection, sensitivity scenarios, and comparisons with alternative estimates to support interpretation.
The projections are designed to provide a guide to the long-run path of employment based on the data available at the time of construction. They are not intended as forecasts for individual years within the projection period.
Headline results
The 2024-based update indicates that:
- Workforce jobs across London will grow from 6.4 million in 2024 to 7.3 million in 2050, an additional 869,000 jobs, or 13.6% (Figure A1). This represents a higher level of projected employment than in the 2017 and 2022 projection rounds, largely reflecting a higher post-pandemic starting point rather than faster long-run growth.
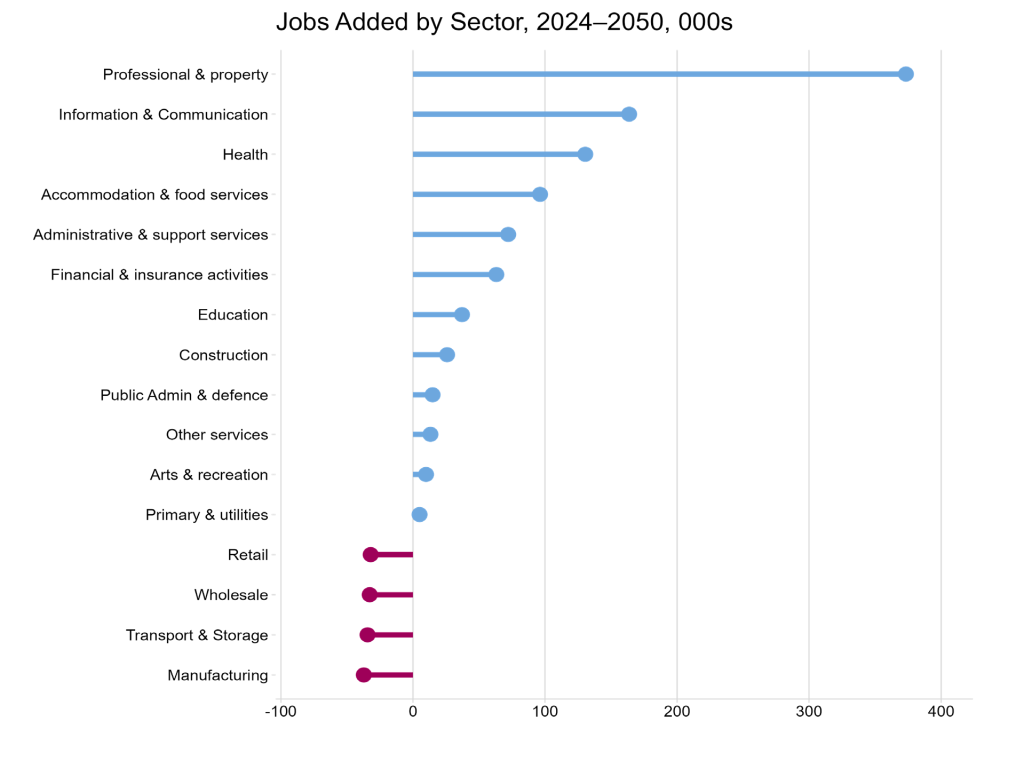
- London’s labour market will continue to be shaped by the long-term structural shift towards business services, with Professional, Scientific, Technical and Real Estate activities (+373,000 jobs from the 2024 level) and Information and Communication (+164,000) accounting for around half of the projected increase between 2024 and 2050 (Figure A2).
- Four sectors are projected to see declines over the projection period: Manufacturing (-37,000 jobs), Transportation and Storage (-34,000), Wholesale (-32,000), and Retail (-32,000). This is due to a combination of slower growth overall in London and the decline in the relative growth rates of these sectors over recent periods.
All long-term projections are subject to uncertainty. Sensitivity analysis suggests that the central projection sits within a plausible range of outcomes and is consistent with population-based employment projections and other benchmarks.
Figure A1: London’s historical and projected employment (000s), 1971-2050
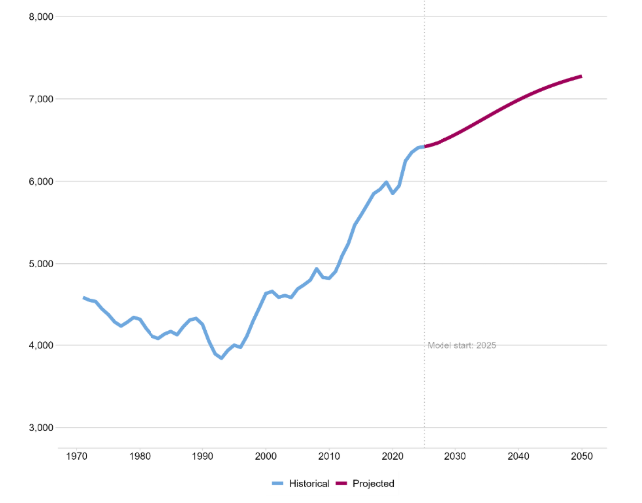
Figure A2: Employment projections for London sectors, % increase, 2024-2050
This report has been prepared based on historical data and in advance of any separate analysis of the impact of the 2024 National Planning Policy Framework and the Government’s standard method for calculating housing need.
Under that framework, London has an indicative housing need for 88,000 homes a year at the time of writing. The South East region, from which around 1 million people commute to work in London, has an indicative housing need figure of 71,000 homes a year, and the East of England has an indicative housing need figure of 45,000 homes a year.
These housing need figures are significantly above historic delivery rates. If they were met, they could support a higher level of workforce jobs in London than is projected in this report. However, this would only occur if higher housing delivery led to higher net migration to London or its commuter belt.
If housing delivery in the rest of the country instead made housing relatively more affordable outside London, and/or raised productivity and job opportunities in those areas, the number of workforce jobs in London could be lower than projected.
The implications of future housing delivery for workforce jobs in London will be considered alongside other London Plan evidence in subsequent analysis.
Methodology and key assumptions
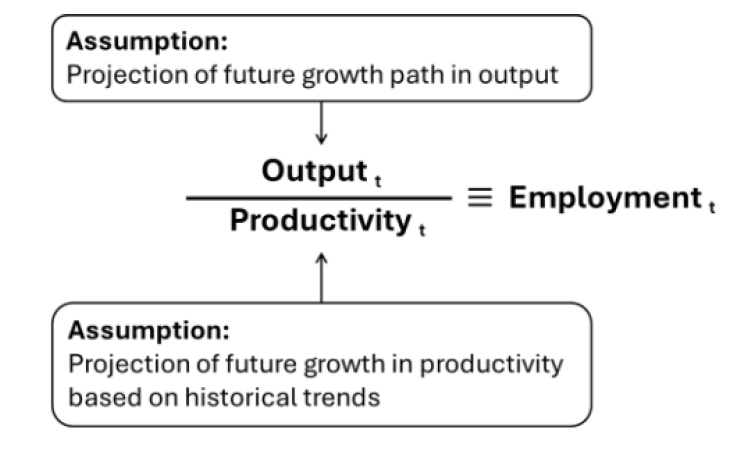
Our employment projections are based on historical trends of labour productivity in London (measured by output per job). Projected job numbers are calculated using assumptions of economic growth rates and productivity growth rates (Figure A3).
Figure A3: Schematic of methodology
In line with the previous updates, the GVA growth assumptions are guided by the UK Office for Budget Responsibility (OBR) long-term economic determinants, published alongside its Economic and Fiscal Outlook (EFO) of March 2025.[2] The OBR’s UK forecasts provide a consistent reference point for medium-term GVA assumptions to 2030 and long-term assumptions to 2050.
GVA input assumptions
While London GVA grew faster than UK GDP up to the mid-2010s, growth rates have been near identical since 2014. Given wider shifts since the financial crisis – including slower productivity growth and reduced projected growth in labour supply – it is reasonable to assume London will broadly align, rather than outperform, the UK over the long term, albeit from a higher base and without significantly underperforming.
For the very short-term (2024-2025) we use estimates from London’s Economic Outlook (LEO) published by GLA Economics in Spring 2025.
Together, these assumptions imply GVA growth of 1.2% in 2024, rising to 1.6% in 2025 (as in LEO Spring 2025), reaching around 2.0% in the 2030s (in line with the OBR EFO March 2025). It then gradually declines to 1.7% by 2050 (following the OBR’s long-term economic determinants).
Overall, the cumulative level of GVA growth from 2025-2050 in London implied by our assumptions is the same as that implied for the UK by the OBR.
Productivity trend assumptions
As in previous rounds of projections, we first identify historic productivity trends in London and then combine trends representing more recent experience with the longer-run outcomes.
Labour productivity in London has suffered from over a decade of low growth following the global financial crisis in 2008-09. Productivity growth during this period has also lagged behind the rest of the UK. Before the crisis, productivity growth trend was strongly positive from the 1980s onwards.
We combine our estimate of the historical long-term (1981-2007) growth rate of 2.8% per year with our estimate of the short-term (2008-2023) growth rate of minus 0.3% per year. Using a 55/45 weighting – placing more weight on recent experience than in earlier publications – we assume productivity growth of 1.4% per year from 2025 onwards.
The 1.4% productivity growth rate is just below the OBR’s Spring 2025 long-term UK labour productivity assumption and is in line with our previous rounds of long-term employment projections. It reflects a balance between stronger pre-2008 performance and weaker post-crisis outcomes.
Further details
This supplement provides an overview of our forthcoming long-term employment projection. Full details of the results and methodology will be published later in the year.
[1] This supplement focuses on the headline London and industry sector results. At the time of writing, local authority-level results are not available.
[2] The projection models are based on the data available at the time of construction (August 2025 in this update). The March 2025 EFO was the latest update.