
ONS 2022-based Subnational Projections
Summary
On 24 June, ONS published their 2022-based subnational population projections (SNPP). Whilst acknowledging that projecting future population is inherently difficult, we think there are problems with these projections and can’t generally recommend their use in London. In particular, they project future populations at local authority level that are out of line with past trends and repeat a pattern of issues seen in previous rounds of ONS projections. Concerns over the unrealistic projections for many areas have since been reinforced by ONS’s recently released population estimates.
These differences are significant and can run to several tens of thousands of residents for some Boroughs. It should be noted that the differences between outputs are much greater once the results are broken down by age and sex. This is not just a problem for users in areas where the projections are unreliable – a skewed distribution of future population growth across local authorities creates a problem for anyone looking to use these ONS projections to help allocate finite funding and resources between areas, to plan major infrastructure projects, or to prioritise policy interventions.
More detailed explanation is provided below, but at a high level, we believe the issues are due to a combination of:
- The projections being based on a series of annual migration estimates that are not fully consistent with population change over the previous decade. This results in projections for areas where population estimates were previously inflated continuing on an inflated trajectory (and vice versa).
- The process of constraining the projections to the results of the national projections leads to large step changes in annual population change for some local authorities that are out of line with past trends and which serves to distort the spatial distribution of the projections.
We find that the scale of the potential impacts of these issues are unlikely to be apparent to users and recommend that ONS undertakes and publishes more thorough sensitivity analysis alongside the projections.
This blog focuses on key aspects of the ONS’s current methodology, including examples of how certain methodological choices can affect the results for different areas. In the upcoming months, a more detailed explorations of these and other issues will be covered in an upcoming series of technical notes focussed on demographic projection methods
A quick note on the projections used in this analysis
In the following sections we illustrate the implications of particular aspects of the ONS methodology using projections produced with our own model, but configured in a way that largely emulates the ONS approach. Creating pithy names for projections is difficult, so here is a quick glossary/explanation of the various outputs used in case you get lost:
- Projections are labelled: [past estimates series used]/[constraint used] – these reflect the two elements of the ONS methodology that we are examining here.
-
Two different past estimate series are used:
- MYE – the published ONS mid-year estimates
- Converted UPC – a modified version of the ONS estimates in which past unattributed population change is reallocated to international migration
-
Three different constraint options are used:
- Unconstrained – no constraint is applied
- NPP 5yr – constrained to the 5-year variant of the national projections
- NPP Mig Cat – constrained to the Migration Category variant of the national projections
- We consider Converted UPC/Unconstrained to be a sensible baseline projection and is most similar in approach to the GLA’s standard trend-based projections
- MYE/NPP 5yr – is comparable to the ONS SNPP 5-year variant
- MYE/NPP Mig Cat – is comparable to the ONS SNPP Migration Category variant (designated by ONS as the principal variant)
Issue 1 – accounting for past estimate errors in the projections
The first aspect of the methodology we will explore is how the ONS has addressed previous errors in the population estimates that underpin their projections. The accuracy of the ONS’s population estimations tend to fall as we move further away from the last census point and errors in annual migration estimates compound. Errors in past estimates of population and components of change (births, deaths, and migration) will inevitably translate into errors in the projections. Accurately estimating the population is difficult — especially in areas with high volumes of annual migration turnover. For this reason, projections produced late in the census cycle tend to be accompanied by concerns about the accuracy of the data that has fed into them.
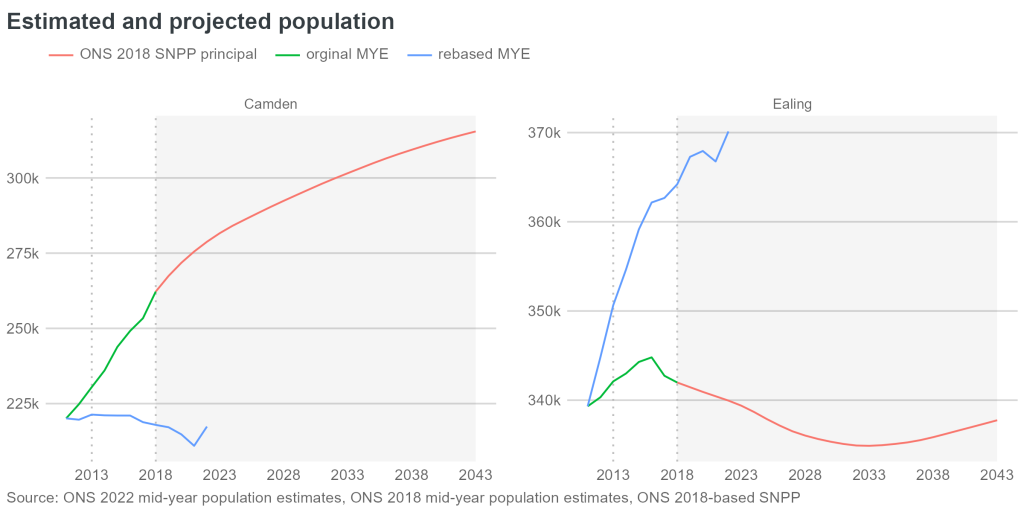
This problem can be seen clearly in the ONS’s 2018-based projections, which were based on estimates that had become increasingly distorted since the 2011 census. Projections for areas with inflated population estimates not only started from a level that was excessively high, but continued on a trajectory that was consistent with the inflated rate of growth in the estimates. For areas where the population had been underestimated, the converse occurred.
Projecting close to the start of a new census cycle should be easier. The census provides a more accurate starting point for the projections and an opportunity to address errors in past population estimates.
Rebasing population estimates
Once a new census-based population estimate is available, annual estimates for the preceding decade are updated to be consistent with it through a process known as ‘rebasing’.
In the process of rebasing the estimates for 2012 to 2020, ONS made revisions to annual migration estimates, which in many, but not all, cases reduced the gap between the population implied by the annual components of change (births, deaths and migration) and the new 2021 census-based population estimate.
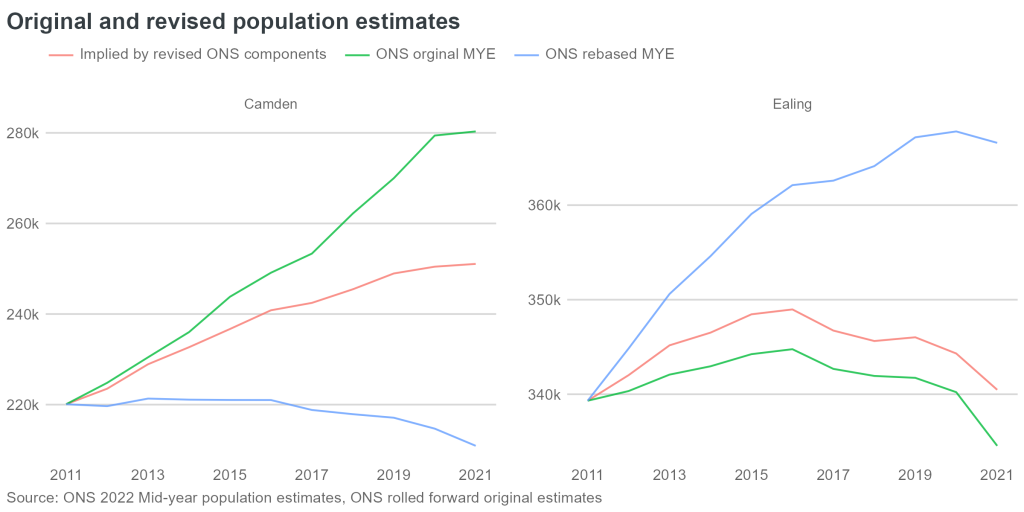
In the case of Camden, the revised migration estimates contributed less to the population over the course of the decade, and for Ealing they contributed more. In each case, the revisions were not sufficient on their own for the series to be consistent with both the 2011 and 2021 estimates.
Unattributable Population Change
Unattributable Population Change (UPC) is a catchily-named adjustment added by ONS in the process of rebasing past Local Authority population estimates to make the annual series consistent with census-based estimates. It represents the change over the decade that the ONS is unable to confidently assign to a specific source, and is included in the rebased series as a pseudo component with annual values by age and sex that can be either positive or negative.
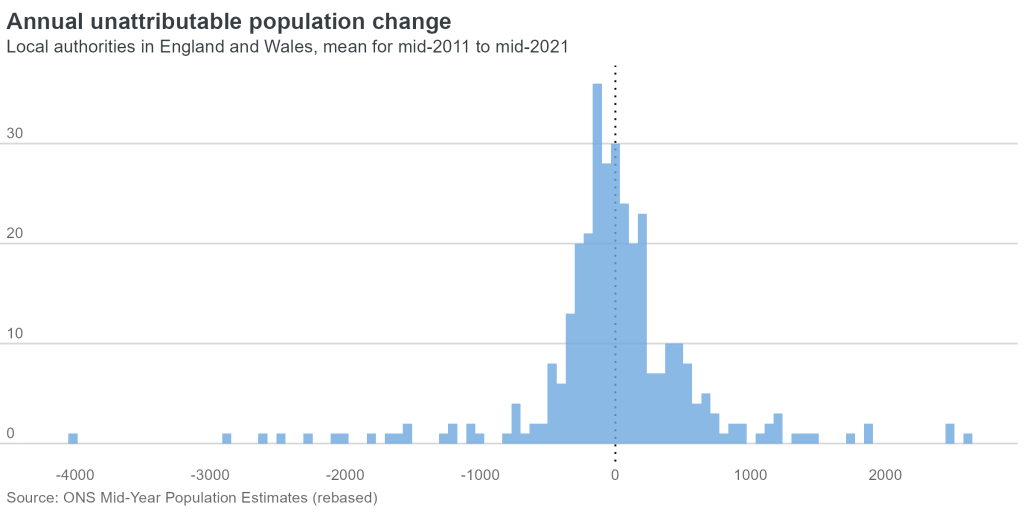
For ONS’s rebased estimates, the average annual UPC applied to local authority estimates ranged from -4,016 (Camden) to +2,612 (Ealing), with almost one in ten authorities having a figure with a magnitude of at least a thousand.
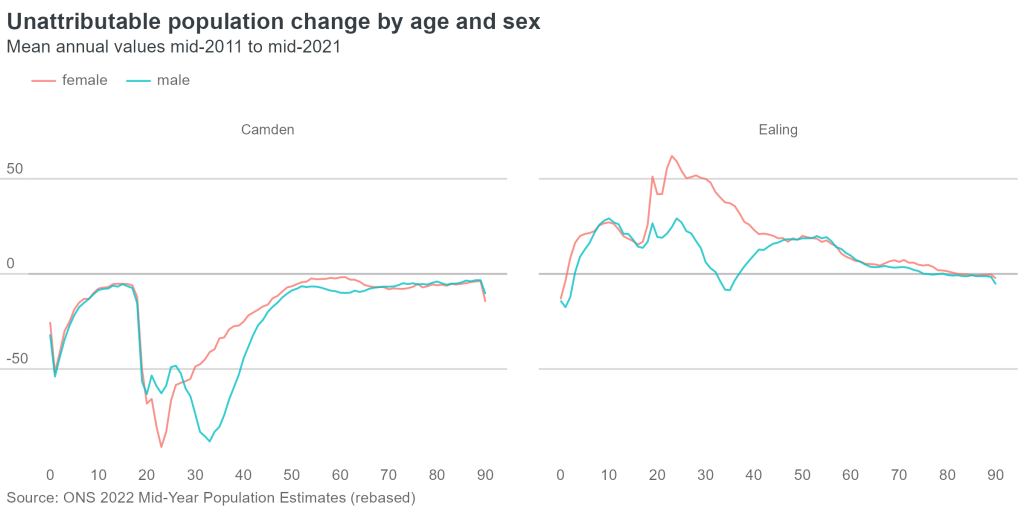
These totals mask the fact that the UPC adjustments tend to be strongly weighted toward individual age groups, with especially sharp features in local authorities with large student populations.
UPC and projections
The decision to assign residual intercensal change to UPC in the rebased series has implications for their use in the subnational projections, produced using models that only account for the standard components of change. Any UPC in the past estimates on which the projections are based is effectively ignored and has no bearing on the projected population. In cases where there is a substantial amount of UPC in the backseries, this tends to result in rates of projected future population change that are inconsistent with those seen in the period of past estimates on which the projections are based.
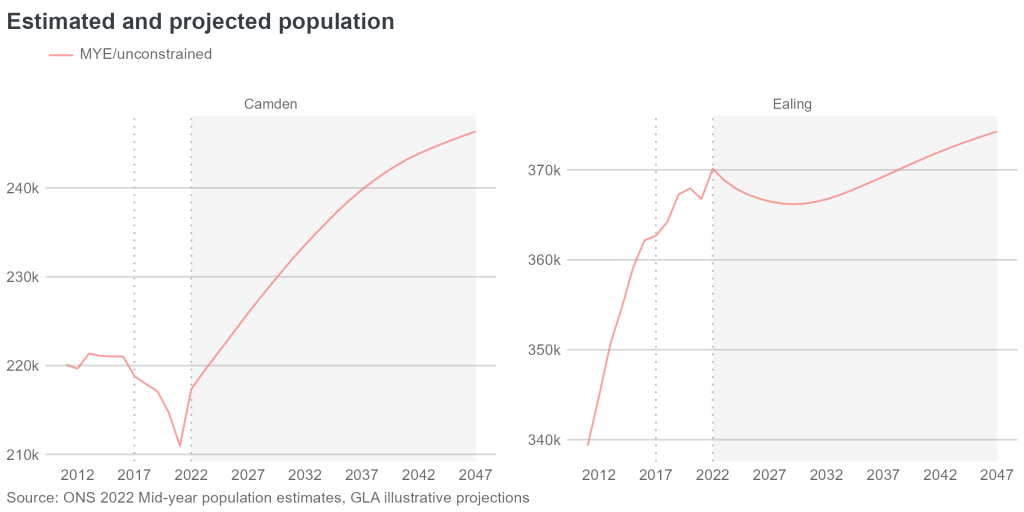
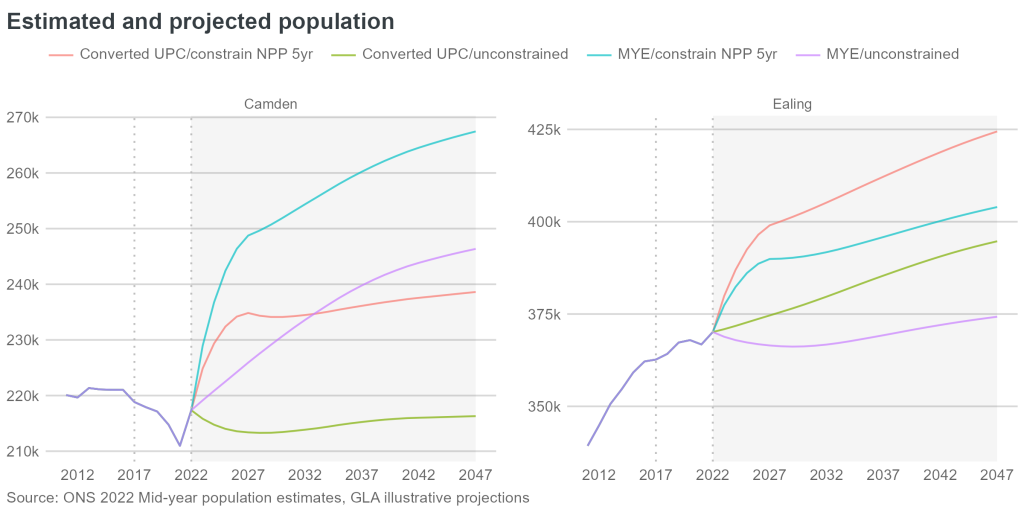
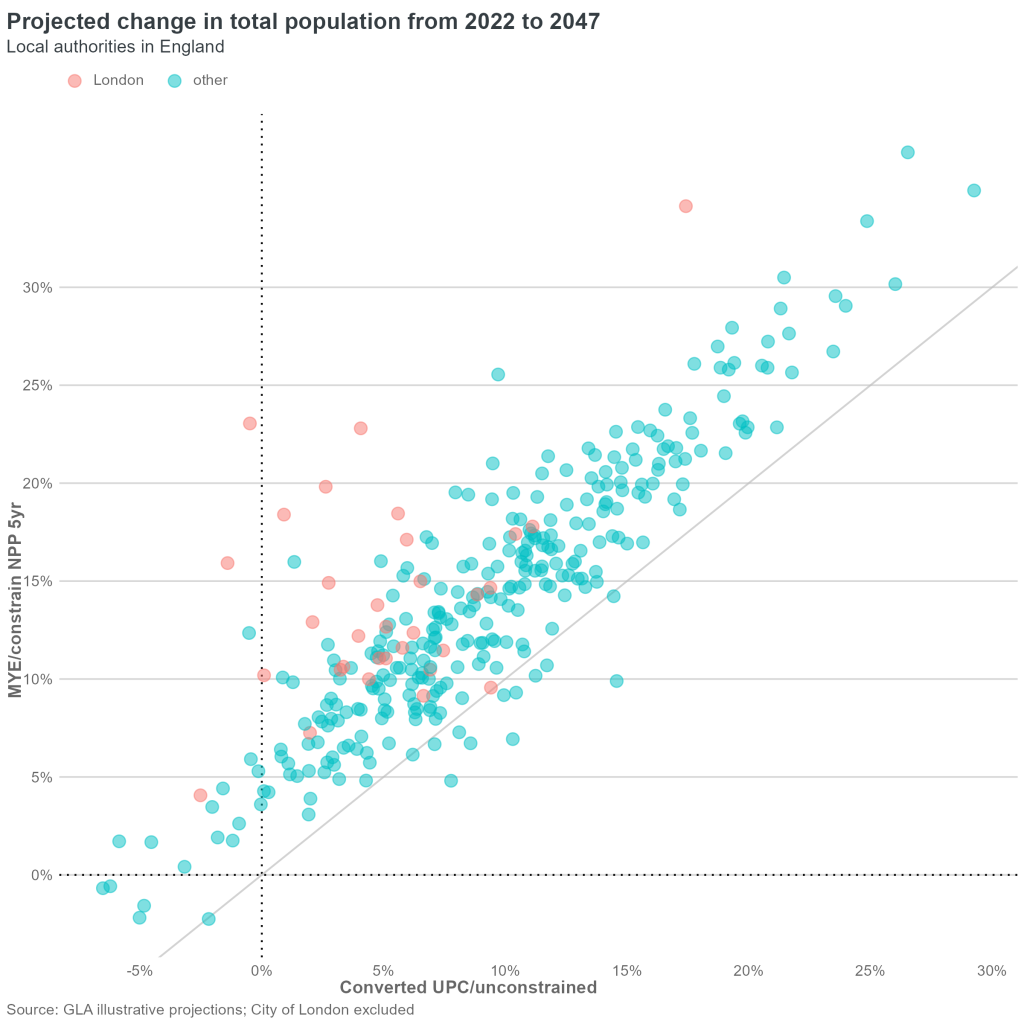
This is apparent if we consider the results of an illustrative projection that uses five years of past trends from the official population estimates as the basis for future patterns of migration. This is the approach used by the ONS in the SNPP.
We can then illustrate the scale of the impact that the omission of past change assigned to UPC has on projected population by considering a second projection that is identical in its configuration but based on a modified estimates series in which all UPC has been converted into international migration flows [using the simple method and code posted here].
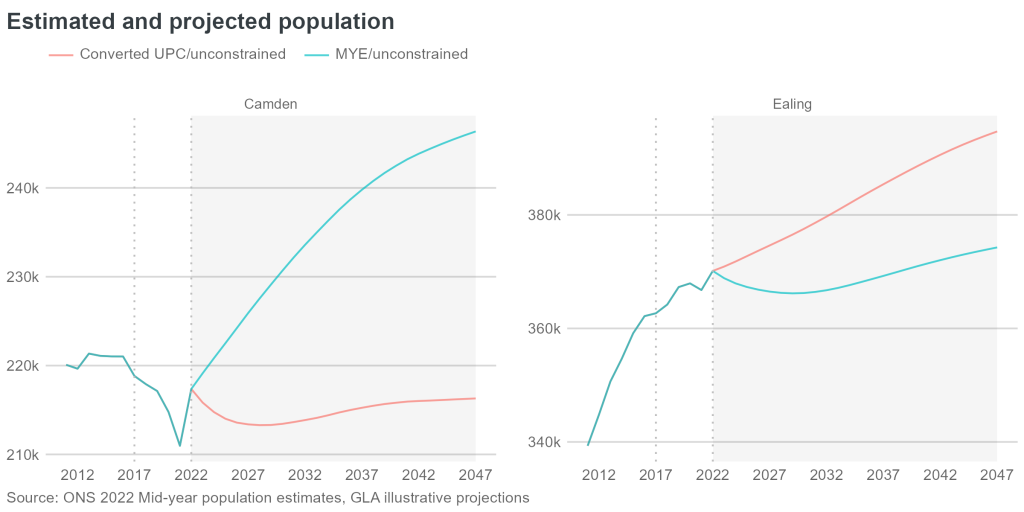
The results of this second projection (Converted UPC) are far more in line with recent trends for each area and clearly very different to those based on the official estimates series.
Issue 2 – constraining to the results of the national projections
The second aspect of the ONS’s methodology we will investigate is the process of “constraining” the components to the National Population Projections (NPP). “Constraining” means forcing the sum across all local authorities to match the results of the national level projections.
The purpose of this step is to ensure consistency with the national projections, which are considered more robust by virtue of being for a larger area. However, this consistency comes with potential side effects that ONS themselves note in their documentation:
“Constraining to the 2022-based national population projections’ migration assumptions will entail scaling of the local trends calculated. Therefore, there may be a step change between recent trends locally and the assumptions used in the subnational population projections (...)”
To illustrate the potential scale of these possible ‘step changes in recent trends’ we can again consider some example projections.
Each of these are based on 5 years of past migration trends and each is using the modified estimates series where UPC has been converted to international migration flows. The methdological difference between the projections is as follows:
- one has been produced without any constraining step,
- one has been constrained to the 5-year variant of the NPP
- one has been constrained to the Migration Category variant
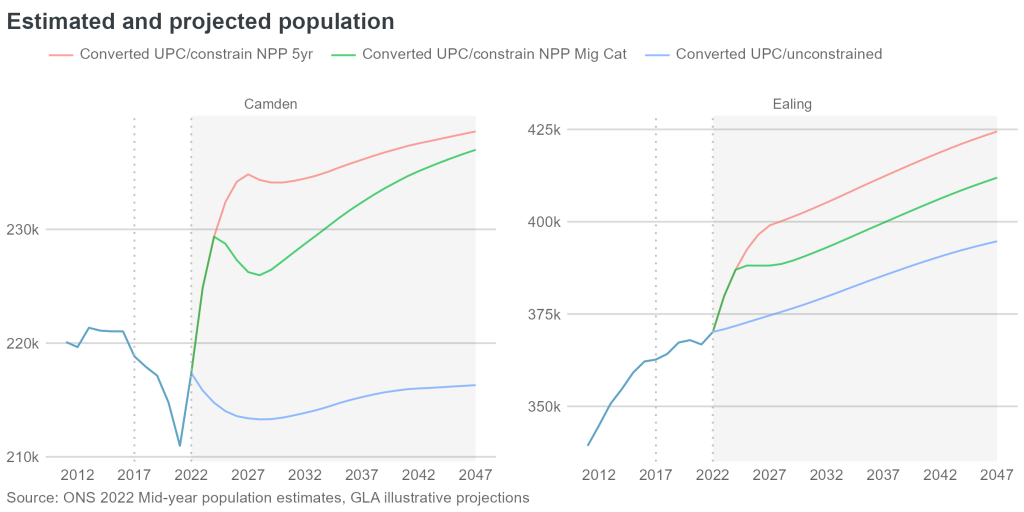
ONS’s description of the effects of constraining is techncially accurate, but I think it is fair to say that it does not convey the very significant scale of the impacts on projections for individual local authorities.
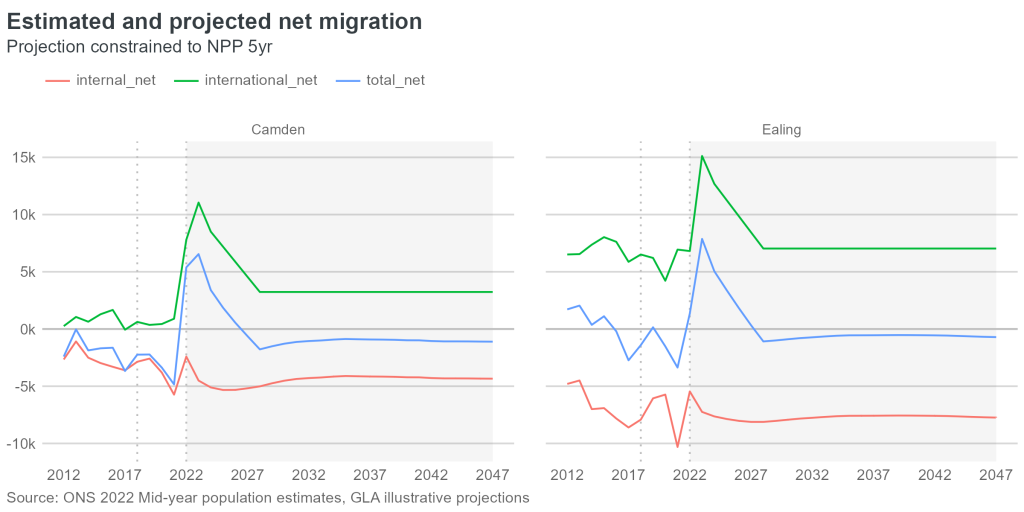
The main direct effect of applying the constraint is to increase projected international inflows to each local authority by the same proportion. Local authorities with large international inflows – e.g. London and cities with major universities – will therefore see the largest absolute increases.
Large international inflows are typically offset by similarly large domestic and international outflows. A significant proportion of these outflows are directly linked to the inflows – e.g. international students returning to their home country or moving elsewhere in the UK for work or further study. However, applying the constraint changes international flows without directly changing internal flows. Internal migration outflows do increase in response to larger inflows, but this is a second-order effect and much smaller in magnitude than the increase in international migration.
The increases in growth that results from applying the constraints are therefore often accompanied with a shift in established relationships between different migration flows without any obvious explanation of why these patterns are suddenly expected to change.
Note: the effects of constraining can cut both ways – for the 2016-based SNPP the principal variant of the NPP assumed a decrease in future net international migration, which led to a significant fall in the projected growth rates of local authorities with large volumes of international migration.
Interactions between these two effects
Having just established that the impacts of the constraining step are directly linked to the volume of past international inflow estimates, it should come as no surprise that there are interactions with the UPC issue.
Areas like Camden, where large negative UPC components likely reflect inflated net international migration estimates, the two effects are likely to reinforce one another. However, for other areas, such as Ealing, the two effects are operating in opposite directions, making it harder to predict the net impact.
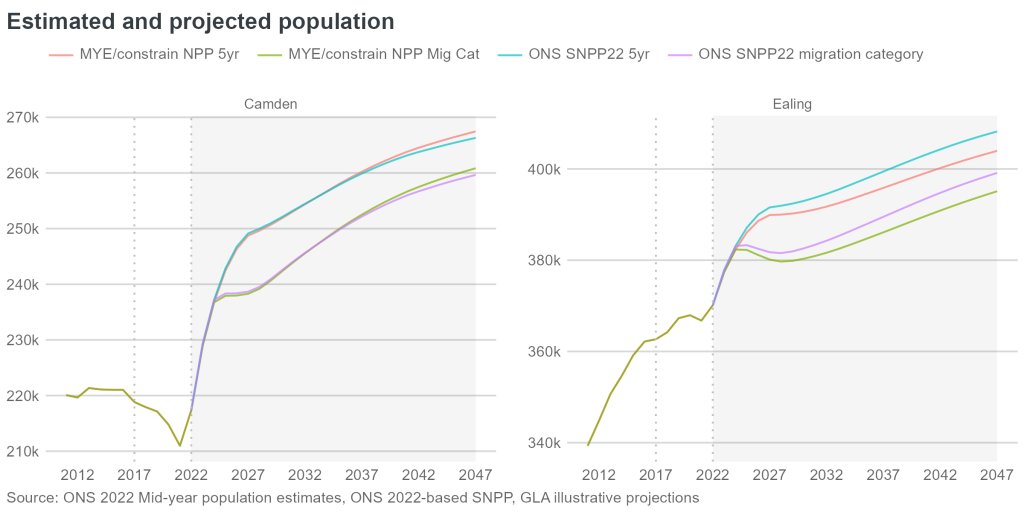
The simplest way to test the combined impacts of the two effects is by again comparing projections:
- With and without a constraint (for the purpose of illustration, we will only include the NPP 5yr version here, but note that ONS have now designated the Migration Category as the principal variant)
- With and without UPC in the backseries converted to international flows adjustments
As expected, using the unadjusted mid-year estimates backseries and applying the NPP constraint results in the highest projected population for Camden – 50 thousand above our ‘baseline’ projection by 2047. For Ealing, the two effects offset each other to an extent resulting in a difference of less than 10 thousand (with the Migration Category constraint, the difference is only 400).
Note: we have only looked at total population here. The differences between outputs are much greater once the results are broken down by age and sex.
An unexpected bonus issue – internal migration rates
In the course of analysing the impacts of these different methods, we discovered an additional and unexpected issue related to how internal migration is calculated in the model and its impact on the projections.
The illustrative projections used throughout the analysis were created by configuring our own model to emulate the ONS methodology (minus the step of excluding military personnel and prisoners from the main projections loop), and then to change individual methods to show their impacts.
While the results of our most ONS-like projections are similar to the published SNPP, there were larger than expected differences that seemed to stem from the internal migration/cross-border components.
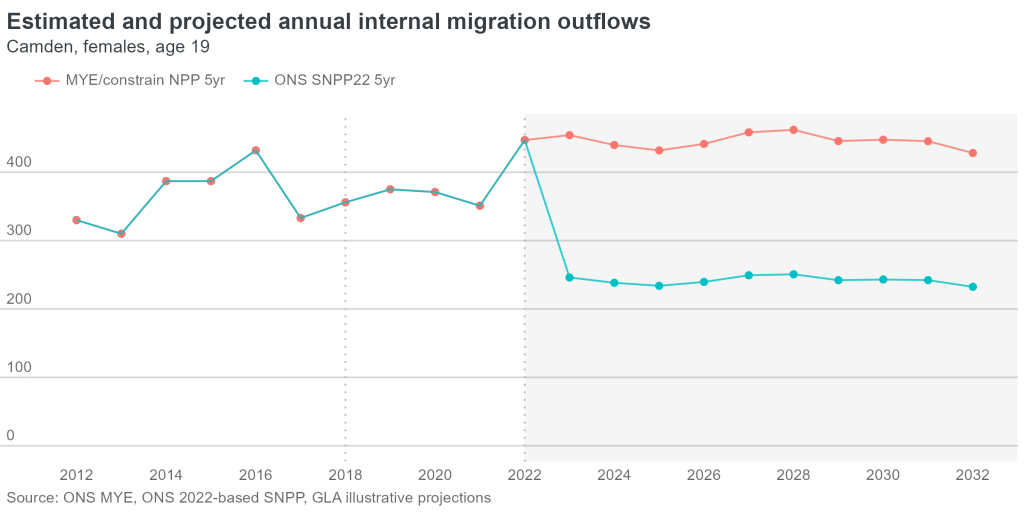
On closer examination, there appeared to be step changes in outflows at ages where cohorts saw large changes in size (e.g. for 19 year olds in areas with universities). This could be explained by a mismatch between the methods used to calculate internal migration rates and those used to apply them within the projection.
Internal migration rates are typically calculated by dividing the observed flow for a period by the ‘population at risk’. The rate for 19-year-olds can be calculated as the flow of persons who will be 19 at the end of the period, divided by the population aged 18 at the end of the previous period.
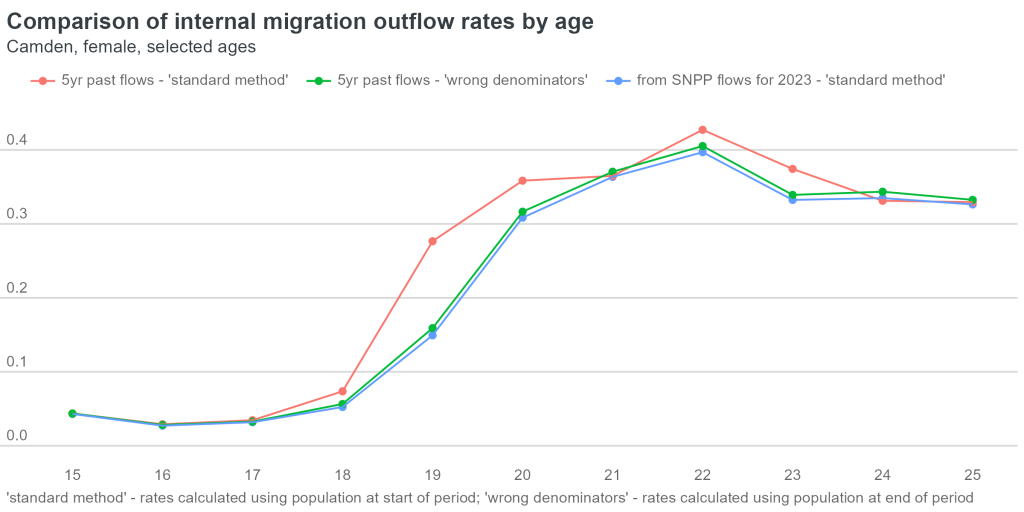
A brief investigation suggests that while this is how rates are being applied in the projection process, they may have been created incorrectly. If we create a set of rates by using the ‘wrong’ at-risk population – persons aged 19 at the end of the period rather than 18 at the start of it – we get results that are very similar to those that appear to be applied within the SNPP model. This appears to be a reocurring issue present in the SNPP for many years and potentially have occurred when internal migration estimates changed definitions from age at time of move to age at end of period.
Conclusions
In the production of the 2022-based SNPP, the ONS have persisted with the use of methods that have repeatedly created distorted results in past rounds of projections. Areas where estimates and projections have previously been significantly inflated, have to contend with official projections that appear unrealistic when compared with past trends. This impression has been reinforced this week with the release of the 2024 Mid-Year Population Estimates*.
* e.g. Camden – where the new estimate for mid-2024 was 216,943 as compared to a projected figure of 237,184
This is not just a problem for users in areas where the projections are unreliable. The distribution of future population growth across local authorities creates a problem for anyone who uses the projections to help allocate finite funding and resources between areas, to plan major infrastructure projects, or to prioritise policy interventions.
In this blog we have highlighted some of the issues the ONS’s methods can cause in the results of the projections. However, it should be noted that the methods used in the SNPP model itself will not always produce unreliable results. Rather, these methods create increased sensitivities in terms of: the estimates series used as inputs and the relationships between the NPP and SNPP.
Recommendations
Problems highlighted here could potentially be addressed by simple measures such as:
- reassigning UPC to other components (if not using the approach we have presented, then using methods that the ONS are now developing themselves), or
- creating alternative variants of the NPP with international migration assumptions more closely aligned to recent trends for use in constraining
While the ONS has taken positive steps in embracing the increased use of variant projections, the selected variants do not provide users with an adequate understanding of the sensitivities of the model to the methodological choices that have been made. We would encourage the ONS to expand the range of variants produced in future and to put an increased focus on sensitivity testing of their models.