
London’s Mortgage Lending Hotspots
A number of extremely useful new housing datasets have been opened up in recent years, including those on mortgage lending and house prices. So, at the risk of saturating the market in blog posts on housing in London, in this short piece I examine London’s mortgage lending hotspots by looking at changes in mortgage lending from quarter 2 2013 (the first release) to quarter 4 2014 (the most recent data). Although we can make limited inferences from this data, the results give us a good idea of which areas are heating up.
In the map below I’ve shown the percentage change in the value of outstanding mortgages across London’s postcode sectors, with Borough names overlaid to help with orientation. The biggest percentage increase is in W1U 1, at 81%, though by London standards the total increase of just over £4 million is rather low (the total amount for mortgages here is only £9.5m). This postcode sector is just to the north of Bond Street Station, between Oxford Street and Wigmore Street. According to HM Land Registry’s price paid dataset, this new lending coincides with 28 sales in the area, at an average transaction value of £1.4 million.
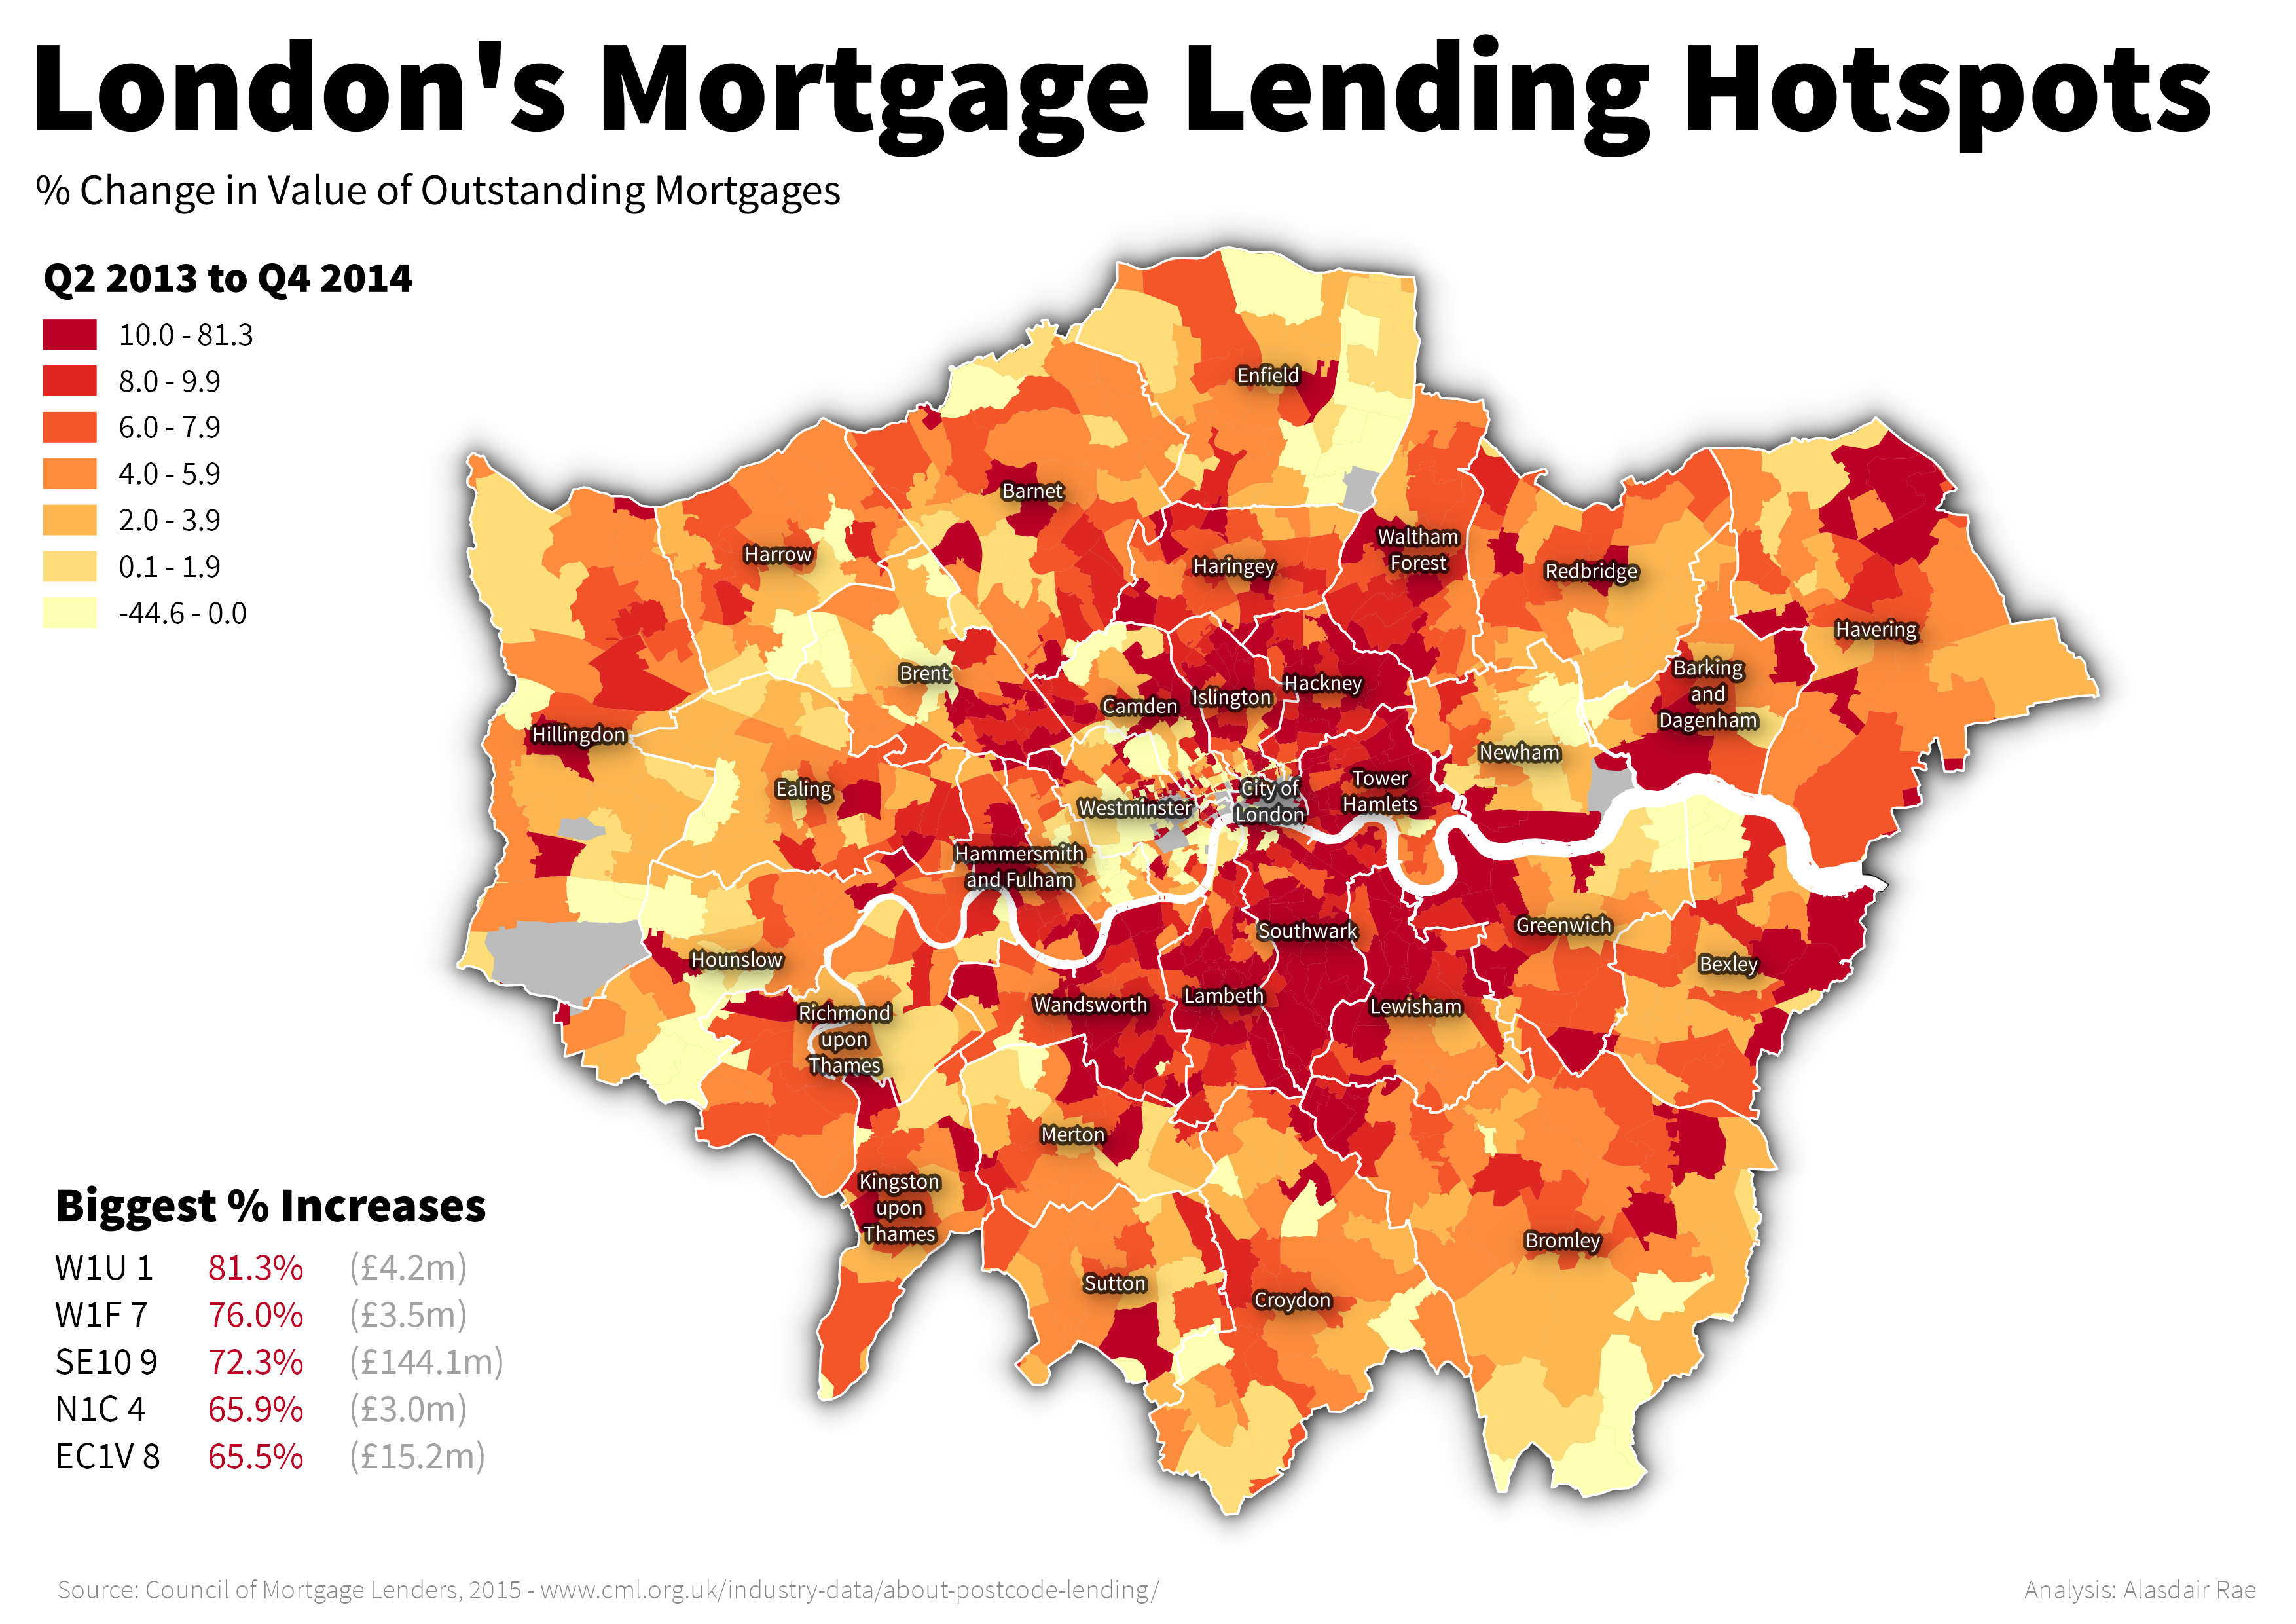
More interesting, perhaps, is SE10 9 in Greenwich. This area centres on the National Maritime Museum and experienced a 72.3% increase in the value of outstanding mortgages. This represents £144 million of new lending, out of a total of £430 million in the postcode sector as a whole. According to HM Land Registry, there were 903 transactions during the timeframe covered by the mortgage data, at an average of £476,000.
In order to provide a little more detail on the areas with the largest increases, in the tables below I have provided a summary of the top 10 postcode sectors by percentage and absolute increases in mortgage lending between the second quarter of 2013 and the final quarter of 2014. Most of the postcode sectors in Table 1 show big percentage increase but quite small total increases in the London housing market context. Table 2, by contrast shows that over seven quarters these areas all saw more than £50 million of new lending.
Table 1 – Top ten postcode sectors by % increase in mortgage lending
| Postcode Area | Sector | New Lending | % Increase | Total Value of Sales | Total Sales | Average Price |
|---|---|---|---|---|---|---|
| West London | W1U 1 | 4,264,884 | 81.3 | 40,010,492 | 28 | 1,428,946 |
| West London | W1F 7 | 3,529,976 | 76.0 | 7,456,000 | 7 | 1,065,143 |
| South East London | SE10 9 | 144,076,431 | 72.3 | 429,594,416 | 903 | 475,741 |
| North London | N1C 4 | 2,995,068 | 65.9 | 71,371,175 | 79 | 903,433 |
| East Central London | EC1V 8 | 15,224,606 | 65.5 | 68,211,975 | 117 | 583,008 |
| West London | W1F 0 | 6,495,233 | 61.1 | 17,193,799 | 13 | 1,322,600 |
| North London | N7 7 | 45,777,831 | 55.9 | 130,107,989 | 303 | 429,399 |
| Western Central London | WC2H 0 | 2,749,637 | 50.1 | 15,557,000 | 7 | 2,222,429 |
| East Central London | EC1V 1 | 5,484,756 | 45.7 | 4,638,000 | 7 | 662,571 |
| Western Central London | WC2E 7 | 3,581,853 | 41.8 | 13,563,874 | 6 | 2,260,646 |
Table 2 – Top ten postcode sectors by total increase in mortgage lending
| Postcode Area | Sector | New Lending | % Increase | Total Value of Sales | Total Sales | Average Price |
|---|---|---|---|---|---|---|
| South East London | SE10 9 | 144,076,431 | 72.3 | 429,594,416 | 903 | 475,741 |
| South West London | SW18 3 | 79,858,124 | 12.7 | 406,409,410 | 528 | 769,715 |
| North London | N5 1 | 73,558,729 | 16.8 | 367,007,180 | 528 | 695,089 |
| South West London | SW12 8 | 69,750,333 | 11.4 | 365,680,743 | 459 | 796,690 |
| South West London | SW18 1 | 69,541,271 | 11.3 | 541,478,717 | 860 | 629,626 |
| South West London | SW17 8 | 66,241,205 | 11.7 | 315,230,297 | 524 | 601,585 |
| South West London | SW11 6 | 59,508,618 | 9.2 | 410,415,418 | 369 | 1,112,237 |
| South West London | SW16 6 | 58,680,073 | 16.5 | 212,656,502 | 570 | 373,082 |
| Kingston upon Thames | KT2 5 | 58,411,816 | 12.7 | 343,858,833 | 646 | 532,289 |
| South West London | SW19 8 | 58,155,791 | 10.5 | 325,823,524 | 513 | 635,134 |
As more and more lending data are released, we’ll be able to build up a better picture of emerging mortgage lending hotspots across London. When we combine this with HM Land Registry data on properties sold, it provides some additional useful context. However, this being the London housing market, with off-plan sales, a high number of cash buyers and commercial investors, a proportion of activity is not picked up by the price paid data. Furthermore, the mortgage lending data at present covers seven banks and three quarters of the market rather than all lending. Nonetheless, by examining patterns of lending and sales we can begin to track local peaks and troughs of activity in new ways. Such an approach could be a valuable addition to the housing data toolkit and, simultaneously, helps underline the value of open data in helping increase our understanding of the market.
Data Sources: HM Land Registry, Price Paid Data (Contains public sector information licensed under the Open Government Licence v3.0); Council of Mortgage Lenders Postcode Lending Data – https://www.cml.org.uk/industry-data/about-postcode-lending/ also on the Datastore http://data.london.gov.uk/dataset/lending-by-postcode-sector; boundaries by GeoLytix, Postal Boundaries Open – http://geolytix.co.uk/geodata/
Sales not included in HM Land Registry Price Paid dataset: http://landregistry.data.gov.uk/ppd-documentation.html
Dr Alasdair Rae is a Senior Lecturer at University of Sheffield. Alasdair’s personal blog is ‘Under the Raedar’.