
London's Economy Today editorial - April 2026
The economic fallout from the disruption in the Strait of Hormuz continues
Since the opening of hostilities between the US and Israel and Iran on 28 February the economic effects of this conflict have become more evident. Despite the announcement of a ceasefire on 7 April the Strait of Hormuz has remained severely restricted to shipping. Iran has maintained that the Strait is closed while the US announced a separate blockade of Iranian ports from 13 April. Peace negotiations between the US and Iran have been mediated by Pakistan but have so far not led to any permanent end to the conflict.
This blockade of the Strait has seen “global observed oil inventories [fall] by 85 mb in March, with stocks outside of the Middle East Gulf drawn down by a significant 205 mb (-6.6 mb/d) as flows through the Strait of Hormuz were choked off” according to the International Energy Agency (IEA). This is affecting industry and consumers in many ways with the IEA observing that “households and businesses using LPG [Liquefied Petroleum Gas] have also been impacted, while flight cancellations across the Middle East, parts of Asia and Europe have led to a sharp drop in jet fuel consumption. A growing number of countries have implemented policies to reduce demand, while others have put in place measures to shield consumers from the full impact of rising fuel prices”. In particular IEA Director Fatih Birol said in mid-April that Europe has “maybe six weeks” of remaining jet fuel supplies.
While energy prices have moved swiftly, the impact on food prices is still evolving. The International Food Policy Research Institute states that “up to 30% of global fertilizer trade passed through the Strait of Hormuz from the Persian Gulf to export markets around the world, as well as an estimated 20% of liquified natural gas (LNG), a key fertilizer feedstock”. This has led to concerns for rising food costs with analysis by the World Food Programme last month suggesting that nearly 45 million more people could face acute food shortages if the disruption continues into the year.
UK inflation picks up in March
According to the latest Consumer Price Inflation (CPI) bulletin from the Office for National Statistics (ONS), CPI inflation increased to 3.3% in the 12 months to March 2026, after holding at 3% in both January and February (Figure 1). CPIH inflation (a broader measure that includes owner occupiers’ housing costs and Council Tax) also climbed, reaching 3.4% year‑on‑year, up from 3.2%. The ONS reports that transport costs (especially motor fuels) were the largest contributor to the increase in the annual CPI rate between February and March – reflecting higher global energy prices. Core CPI fell slightly (from 3.2% to 3.1%), but services inflation rose again and remains notably stronger than goods inflation.
Despite having fallen back substantially from its 2022 peak, inflation remains clearly above the Bank of England’s 2% target and has moved outside the Bank’s ±1 percentage point tolerance band. With fuel and energy‑driven pressures picking up, and further upside risks from the conflict in the Middle East still to fully feed through, the Bank’s Monetary Policy Committee voted 8-1 to maintain interest rates at their current level at their meeting on 30 April but noted that they would continue to monitor the situation and act accordingly to make sure inflation met its target in the medium term.
Figure 1: CPI, goods, services and core annual inflation rates, UK, March 2021 to March 2026
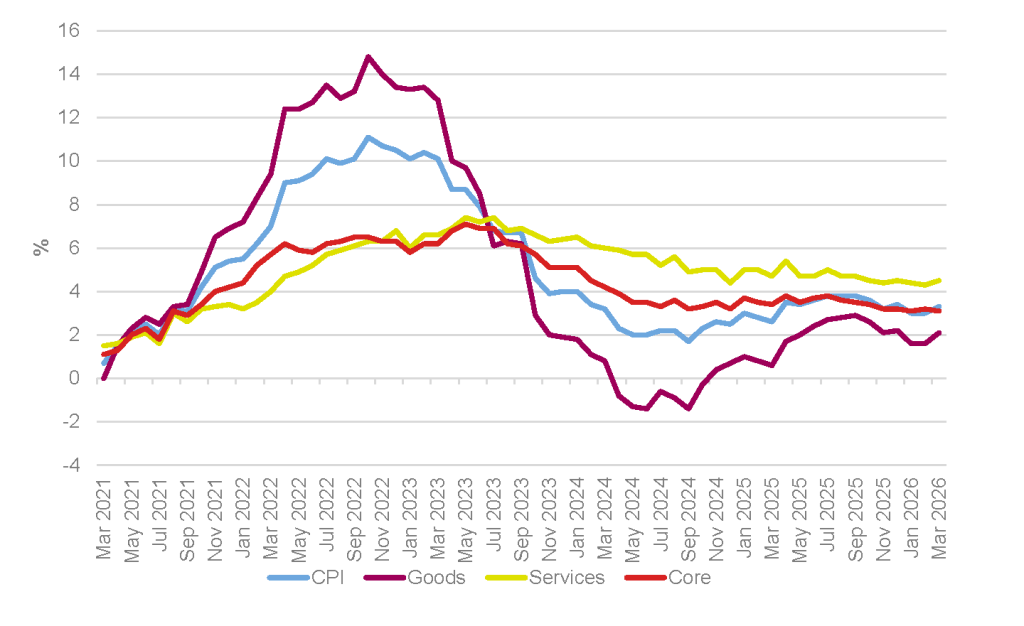
Source: ONS
UK economy picks up pace, but Iran‑driven energy squeeze lies ahead
The latest monthly UK GDP data from the ONS show that the economy grew by 0.5% in February 2026, following monthly growth of 0.1% in both January and December 2025. Looking at the three‑month picture, real GDP increased by 0.5% in the three months to February, up from 0.3% in the three months to January and no growth in the three months to December (Figure 2). February’s monthly rise was broad‑based: the services and production sectors both expanded by 0.5%, while construction output grew by 1.0%.
Over the three months to February, services output rose by 0.5% and remained the main driver of GDP growth, supported by growth in wholesale and retail trade, information and communication, and transport and storage. Production output increased by 1.2%, marking a third consecutive three‑month rise, while construction output fell by 2%, reflecting continued weakness in new work, particularly private housing. Compared with a year earlier, GDP in the three months to February was 0.8% higher, with services up 1.1% and construction down 1.8%. For London, this mix of solid service‑sector growth and weak construction-sector growth points to an economy increasingly reliant on the capital’s services base, with housing‑related construction still weighing on overall output.
The data release pre‑dates the start of the conflict in Iran at the end of February, so any impact of higher energy costs or weaker external demand will only begin to show in subsequent releases, raising questions over how long the recent momentum can be sustained.
Figure 2: UK real three-month GDP growth, February 2025 to February 2026
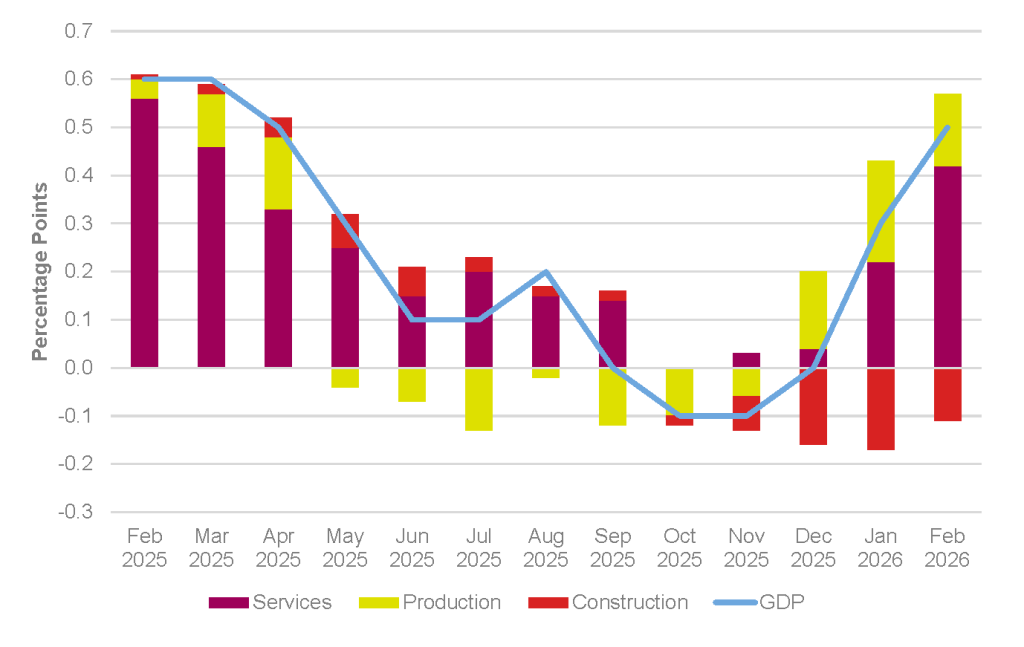
Source: ONS
IMF forecasts modest UK growth, while OECD downgrades UK outlook
The IMF’s April 2026 World Economic Outlook projects that UK real GDP will grow by 0.8% in 2026, 1.3% in 2027 and 1.4% in 2028. This leaves the UK expanding at a similar pace to the Eurozone on average and in the middle of the G7 distribution – but slower than the US and Canada. On inflation, the IMF expects UK consumer prices to remain above target in the near term, with CPI inflation averaging 3.2% in 2026 and easing to 2.4% in 2027 and 2.1% in 2028. Globally, it forecasts world output rising by 3.1% in 2026, 3.2% in 2027 and 3.1% in 2028. Advanced economies as a group are projected to grow by 1.8%, 1.7%, and 1.7% during the same period. The US economy is forecast to expand by 2.3%, 2.1% and 1.9%, and the Eurozone by 1.1%, 1.2% and 1.2%.
By contrast, the OECD’s March 2026 Economic Outlook adopts a more cautious view for the UK. It now forecasts UK GDP growth of around 0.7% in 2026, down from the 1.2% it projected previously, with a modest pick‑up expected in 2027 and 2028. The OECD state that the downward revisions to forecast growth reflect its exposure to higher energy import costs following the conflict in the Middle East and warns that a prolonged period of elevated oil and gas prices would further depress UK growth while keeping inflation elevated. The report also revises the UK inflation forecast upwards, now expecting annual CPI inflation to rise to around 4% on average in 2026 (the highest rate in the G7), before easing in 2027 and 2028. The OECD again points to concerns about the UK’s “thin fiscal buffers”, and resulting limited room for substantial fiscal loosening (without undermining fiscal rules).
Beyond economic forecasts, concern have also been expressed about the level of global stock markets with the Bank of England stating that they expect them to decline as they believe they do not currently reflect the risks to the global economy. Thus the Bank’s Deputy Governor Sarah Breeden told the BBC in April that “there’s a lot of risk out there and yet asset prices are at all-time highs. We expect there will be an adjustment at some point”. With her adding that “the thing that really keeps me awake at night is the likelihood of a number of risks crystallising at the same time – a major macroeconomic shock, confidence in private credit goes, AI and other risky valuations readjust – what happens in that environment and are we prepared for it?”
London’s labour market retains weak underlying momentum
Despite some labour market indicators moving in a positive direction there are also some signs of it softening in the capital. So, the number of payrolled employees living in London continued to decline in March 2026. By age, the largest falls continue to be among those aged 16–24 and 25–34.
At the same time, London’s unemployment rate is still very high but economic inactivity continued to edge down in London, standing just above the record low reached in October 2024. As a result, the employment rate is now above its level a year earlier.
In more detail, the data shows that the most timely estimate of payrolled employees (subject to revision) showed a decrease of 5,250 (-0.1 percentage points (pp)) in the number of payrolled employees in London between February 2025 and March 2026, and a decrease of 0.6% on the year. London’s unemployment rate was estimated at 7.4%, an increase on the quarter and an increase of 0.8pp from a year earlier. While London’s inactivity rate (the measure of those not looking and/or not available to work) was estimated at 19.7%. This was a decrease of 1.1pp on the previous year, and a decrease on the quarter. It is lower than the UK-wide estimate of 21.0%. And the employment rate in London was estimated at 74.3% for the three months ending February 2026, an increase of 0.4pp on the same period in the previous year, and an increase on the quarter. London’s employment rate was lower than the UK average (75.0%).
GLA Economics will continue to monitor these (and other) aspects of London’s economy over the coming months in our analysis and publications, which can be found on our publications page and on the London Datastore.