
How can we measure the number of green jobs?
Introduction
Building upon a previous blog on the same topic, this short update examines the Office for National Statistics’ (ONS) latest experimental estimates of green jobs, released in March 2024.
The estimates of green jobs produced by the ONS complement previous analysis undertaken by GLA Economics to identify green skills and jobs by analysing online job postings produced by Lightcast as well as identifying green occupations in London, among others.
On this occasion however, the ONS has not released more granular regional breakdowns of the data, as a result of some methodological changes to the estimation process – particularly for green occupations. Given the adjustment in methodology and the ONS’s continuing refinement of the approaches used, we expect previous regional estimates to be revised in a future data release.
Defining green jobs
Currently, there is no agreed upon definition of “Green” jobs from which official statistics can be produced. For this publication, the ONS used a definition of green jobs which refers to “employment in an activity that contributes to protecting or restoring the environment, including those that mitigate or adapt to climate change”.
The ONS uses three approaches to estimate green jobs, namely:[1]
- An industry-based approach, which includes all jobs in a “green” industry or sector, with such industries classified according to activities undertaken in them.
- An occupation-based approach, which includes all jobs that are green based on the tasks undertaken by workers or objectives of their work, regardless of the industry those jobs are in. (To note: The estimation methodology has been updated in this latest release (see below).
- A firm-based approach, includes all jobs in a green firm which could be classified based on firms’ environmental commitments, such as an emissions target and/or their trajectory of emissions.
As the ONS highlights, there are overlaps in these approaches and thus each should be considered individually and not aggregated. In addition, the definition of green jobs used is based on activities undertaken within jobs and does not consider the environmental impact of any individual job.
This note presents the estimates of green jobs based on the three approaches; industry, occupation and firm based for the latest available data. These are experimental estimates of green jobs however, and are therefore subject to revision as the ONS continues to review its methods and data sources.
Jobs in green industries
The industry approach includes all jobs in green industries or sectors and is the ONS’ headline estimate of employment in green jobs.[2] The ONS has identified a list of 22 green activities which are used in defining green jobs.[3]
The data points to a 24% increase in full-time equivalent green jobs across the UK between 2015 and 2022. The number of full-time equivalent (FTEs) green jobs in the UK increased from 515,300 FTEs in 2015 to 639,400 in 2022, an increase of over 124,000 jobs.[4] Looking at the most recent changes, there has been a particularly strong increase following the pandemic, with the latest job estimates up over 8% between 2021 and 2022 (Figure 1).
Figure 1:
Two activities accounted for nearly 40% of green FTE jobs in 2022. These were waste management (21.7% of green jobs) and energy efficient products (18.2%). In 2022, waste management accounted for 138,900 jobs and energy efficient products 116,100 jobs (Figure 2).
Figure 2:
Between 2015 and 2022, there was an increase in the number of jobs in 16 out of the 22 activities, the largest of which were in:
- Waste Management (37,900 jobs or 38%)
- Low carbon transport (21,100 jobs or 154%)[5]
- Renewable energy (19,900 jobs or 71%)
- Water quality (15,500 jobs or 52%)
- Nuclear power (11,000 jobs or 91%)
In contrast, job declines were largest in:
- Recycling (-10,000 jobs or -36%)
- Managerial activities of government bodies (-4,300 jobs or -20%)
- In-house environmental activities (-2,600 jobs or -51%)
No reasons were given for these changes, and speculation on this is difficult given the broad spectrum of activities affected.
Green occupations
The green occupations approach measures all green jobs (based on the activities and objectives of work) regardless of the industry. Data for these estimates were collected from just over 2,500 respondents via the Opinions and Lifestyle Survey (OPN) during the period 4th to 14th January and 17th to 28th January 2024.[6]
In the OPN survey, respondents are asked if they felt that any part of their job was green, where a green job refers to employment in an activity that contributes to protecting or restoring the environment, including those that mitigate or adapt to climate change.
Different from previous releases of this data however, the ONS undertook an additional validation stage to test whether respondents’ views on their jobs matched the ONS definition on the occupation approach. To enable this, they added a question to the survey asking respondents to identify which of a list of areas (that the ONS considers green) their job involves. The ONS subsequently used these answers, with information about respondents’ occupation and industry, to validate whether a respondent’s job is likely to be green.
This additional validation step represents a significant methodological change to the estimation approach and as such the ONS do not recommend a direct comparison with the previously published results. Prior to this validation, 19% of respondents believed their job to be green but this this fell to 12% after validation (Figure 3).
Figure 3:
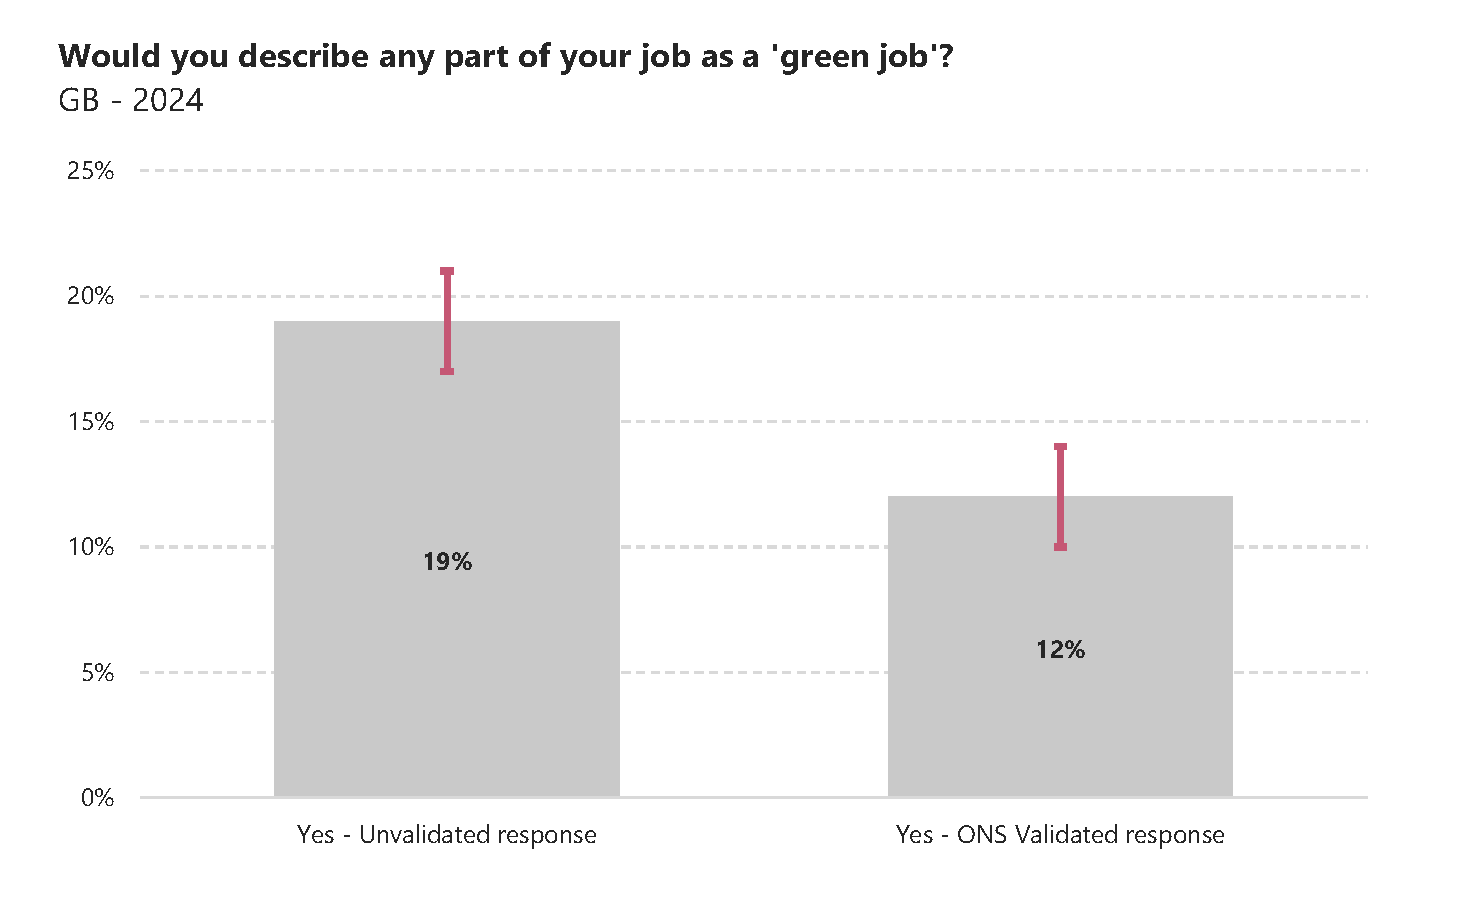
Source: ONS
Red bars indicate the confidence intervals associated with the estimates produced.
Jobs in green firms (employee-emission intensity)
The firm-based approach to estimating green jobs measures all jobs in firms that are classified as green. The ONS uses data on greenhouse gas (GHG) emissions by industry and considers those industries that emit less than 1% of the UK’s total GHG emissions (and the firms in these industries) as “green”.
Across the UK, a small number of industries contribute significantly to total GHG emissions. Three industries, electricity, gas, steam and air conditioning; manufacturing; and transportation and storage, accounted for over 62% of total GHG emissions in 2022. These industries employed almost 3.9 million people, or 14% of total UK employees (Figure 4).[7]
Figure 4:
The analysis also finds that in 2022, 10 industries had GHG emissions of less than 1%. These 10 industries collectively accounted for 3.7% of total GHG emissions but employed 48% of total UK employees (or 12.8 million out of nearly 26.8 million employees across the UK).[8]
In 2022, the highest GHG emissions per employee at industry level was in electricity, gas and steam (736 mass of air emissions every annum per employee), mining, (388), agriculture (256), water supply and sewerage (121), transport and storage (53) and manufacturing (35) (Figure 5).
Figure 5:
Conclusion
While the challenge of defining a green job is well documented,[9] the continued trialling and refinement of different methodological approaches that seek to estimate their number is of both national and regional importance, given the UK’s – and London’s – net zero ambitions. The GLA look forward to the publication of updated regional estimates on green jobs from the ONS in the future and will continue to conduct its own experimental analysis, which will be published on the London datastore.
Further reading and analysis:
- Identifying Green Occupations in London, GLA Economics, 2022
- Measuring green jobs and skills, Nesta, 2023
- Green jobs: rapid evidence review, Nesta, 2023
[1] The three approaches used by the ONS are defined in the publication “Developing estimates of green jobs in the UK methodology”
[2] Data from the Environmental Goods and Services Sector estimates, the Low Carbon and Renewable Energy Economy Survey and the Business Register Employment Survey. As such, the estimates are subject to the same quality features as those. The Environmental Goods and Services Sector Estimates are themselves experimental.
[3] These include activities such as alternative fuel, bioenergy, carbon capture and storage, grid infrastructure, low carbon transport, renewable energy. For a full list see ONS Jobs in green industries, (3. Jobs in green industries)
[4] Employment is measured in full-time equivalents (FTEs) employees. An FTE employee is one person working full time – typically between 35-40 hours per week – for one year.
[5] Low carbon transport is currently a partial estimate and relates to low emission vehicles and infrastructure.
[6] The Opinions and Lifestyle Survey is a survey collected fortnightly of approximately 2,000 to 2,500 individuals, covering Great Britain. Respondents were asked a series of green job questions. The questions were on people’s opinions, so are only indicative of the number of those working in green jobs under the occupation approach.
[7] At London level electricity, gas, steam and air conditioning; manufacturing; and transportation and storage accounted for 6.7% of employees and employed 372,000 people in the capital. (Source BRES 2022)
[8] The 10 industries (Figure 4) were Accommodation and food services, Administrative and support, Education, Professional scientific and technical, Arts entertainment and recreation, Other service activities, Real estate, Information and communication, Finance and insurance, and Households as employers.
[9] The challenges of defining a “green job”. (ONS, 2021)