
Green jobs and skills in London
Nearly half of all Londoners (46%) would be interested in training in order to take up a ‘green’ job, according to a recent Office for National Statistics (ONS) survey.
The same survey showed that around 12% of working adults in London described any part of their main job as ‘green’, with around one-in-three of those workers ‘always’ or ‘often’ undertaking green activities. The data also provides insights into who wants a ‘green job’ in the future, with 51% of Londoners being very or somewhat interested. [1]
At the same time, ONS published updates to two other datasets covering the green economy –jobs in green industries, and jobs in low- and high-emission sectors.
The industry data show that growth in the number of jobs in core green industries – such as clean energy, transport and products, as well as environmental activities including consulting and charity work – stalled in 2024 across the UK.
Meanwhile, the emissions-based data indicate that UK greenhouse gas (GHG) emissions are continuing to fall across almost all industries – led by the energy sector. Transport and storage became the UK’s highest emitting industry, overtaking energy, in 2024, accounting for 22% of emissions. In London, transport and storage accounts for around 61% of all employment in the ‘Big Five’ high-emitting industries (Agriculture, Energy, Water, Manufacturing and Transportation & Storage).
Taken together, the data show a mixed picture: although few Londoners work in primarily green industries and occupations – which still make up a small share of the national economy – there is strong demand for jobs and training in the sector, while overall emissions are falling.
See the London Datastore for a separate analysis tracking trends in online green job postings and specific green skills most in demand. That shows that green jobs demand in London remains strong, despite broader labour market challenges.[2]
Jobs in green industries
The industry approach to measuring the green economy includes all jobs in green industries or sectors. Industries are classified according to the activities they carry out and is the ONS headline estimate of employment in green jobs.[3] Table 1 shows these sectors and the small fall in UK jobs over the year from 2023 to 2024.
Table 1: Green job employment figures, by activity, UK, 2023 and 2024
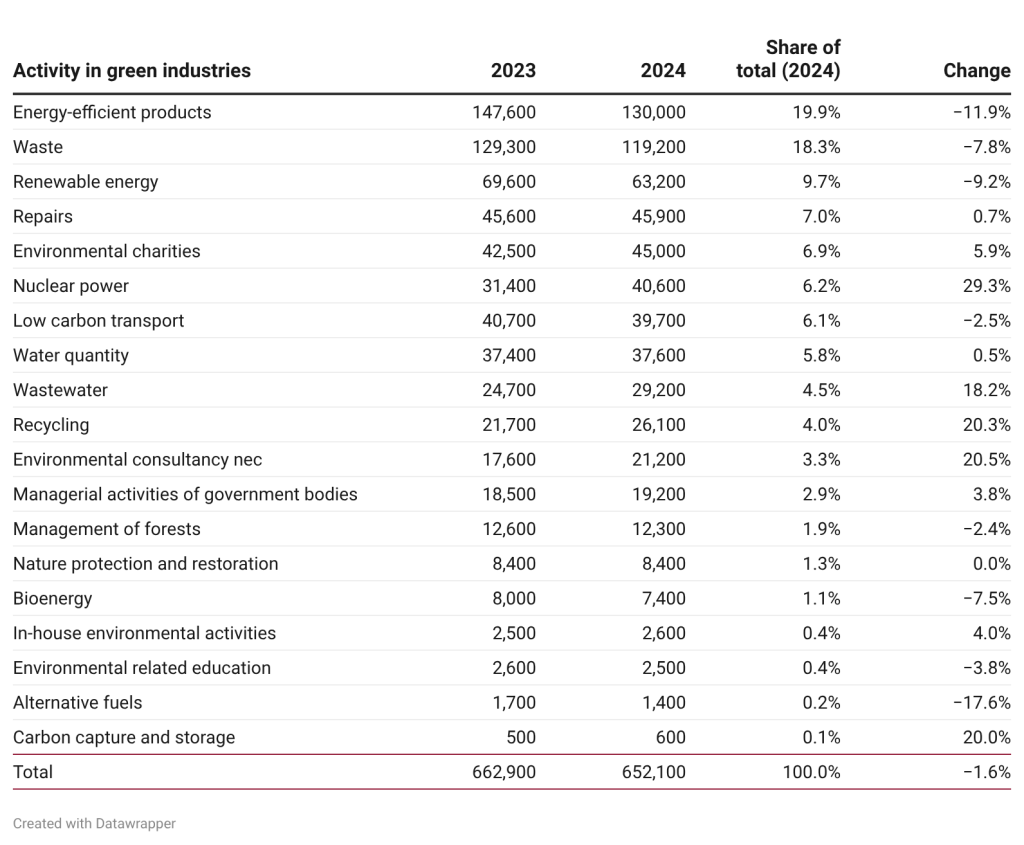
Source: ONS estimates green jobs in the UK.
Figure 1 shows a 28% increase in full time equivalent (FTE) green jobs across the UK between 2015 and 2024. There were 652,100 FTE employed in green jobs in the UK in 2024, up from 510,100 in 2015, driven by large infrastructure projects mainly outside London. However, over the last two years (2023 and 2024) FTE jobs were broadly stagnant.
Figure 1: Full-time equivalent (FTE) employment in green jobs, UK, 2015-2024
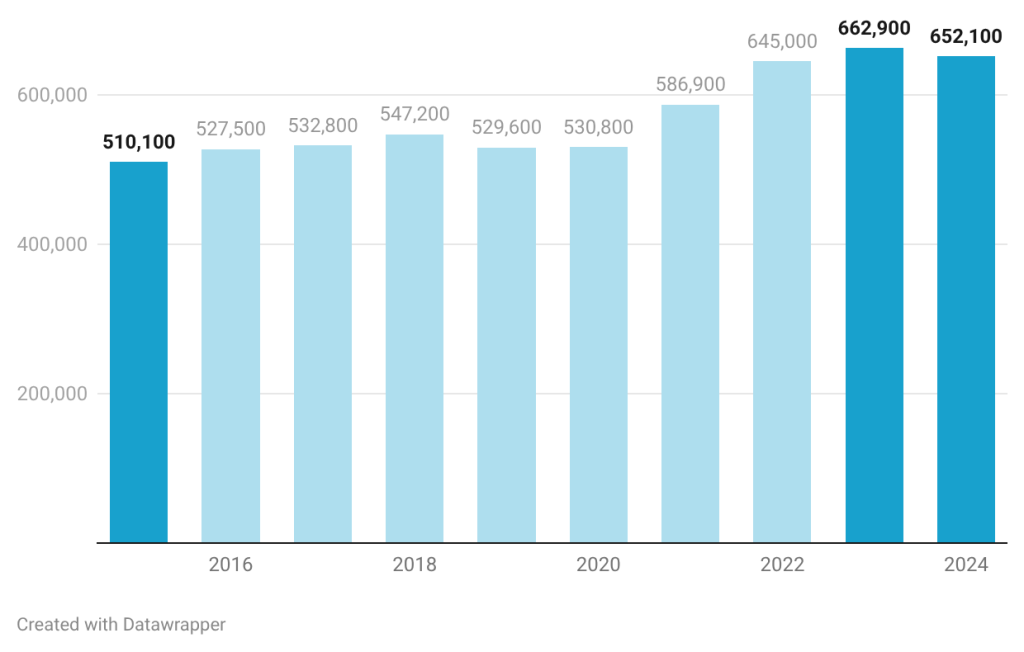
Source: ONS estimates green jobs in the UK
In 2024, five activities – energy efficient products, waste, renewable energy, repairs, and environmental charities – accounted for more than 3 out of 5 (62%) FTE employments in green industries in the UK.
Between 2023 and 2024, of the 21 activities identified in the green industries, eight declined (Table 1).[4] The three industries with the largest declines in FTEs were energy efficient products, waste and renewable energy. Job increases were seen in sub-sectors such as nuclear power, environmental consultancy services, recycling and wastewater.
The data also highlights the period between 2020 and 2022, where a step-change in employment growth was observed. These findings align with the growth of energy saving products and green infrastructure over the period. The workforce building the Hinkley Point C nuclear reactor, for instance, reached 25,000 people in 2025, while the UK offshore wind industry has been growing fast and employed around 40,000 people. (EDF and Renewables UK). The new Sizewell C nuclear plant in Suffolk is expected to support 70,000 jobs.
Green Occupations
The green occupation approach measures all green jobs (based on activities and objectives of work) regardless of the industry. Data for these estimates were collected via the Opinions and Lifestyle Survey in June and July 2025.
In London, 12% of working adults surveyed as part of the Opinions and Lifestyle survey described any part of their main job as a ‘green job’ in line with the Great Britain share of 13% (Figure 2).
Figure 2: Share of working adults who described any part of their job as “green”, by region, June – July 2025
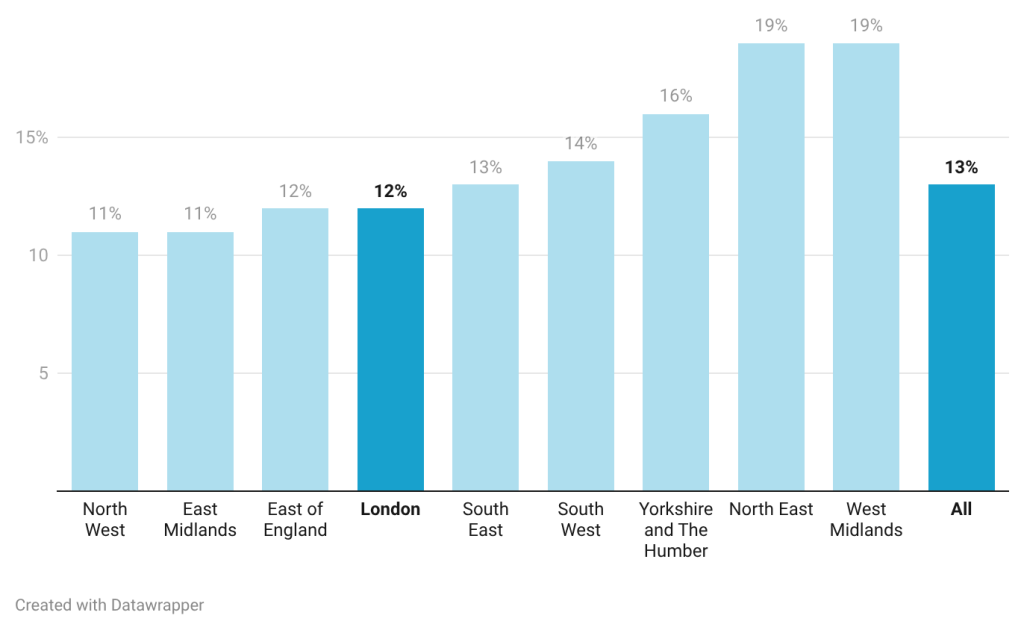
Source: ONS estimates of green jobs in the UK. Note: Estimates based on ONS validated results. London results based on a sample size of 400.
The data shows that certain groups in Great Britain are more likely to work in a green occupation as their main job (Figure 3).[5] These were working people between the ages of 30-49 years, men, those with a degree or equivalent and working adults from Black, African, Caribbean or Black British, mixed and other ethnicities.
Figure 3: Share of working adults who described any part of their job as a ‘green job’, by selected indicators, Great Britain, June-July 2025
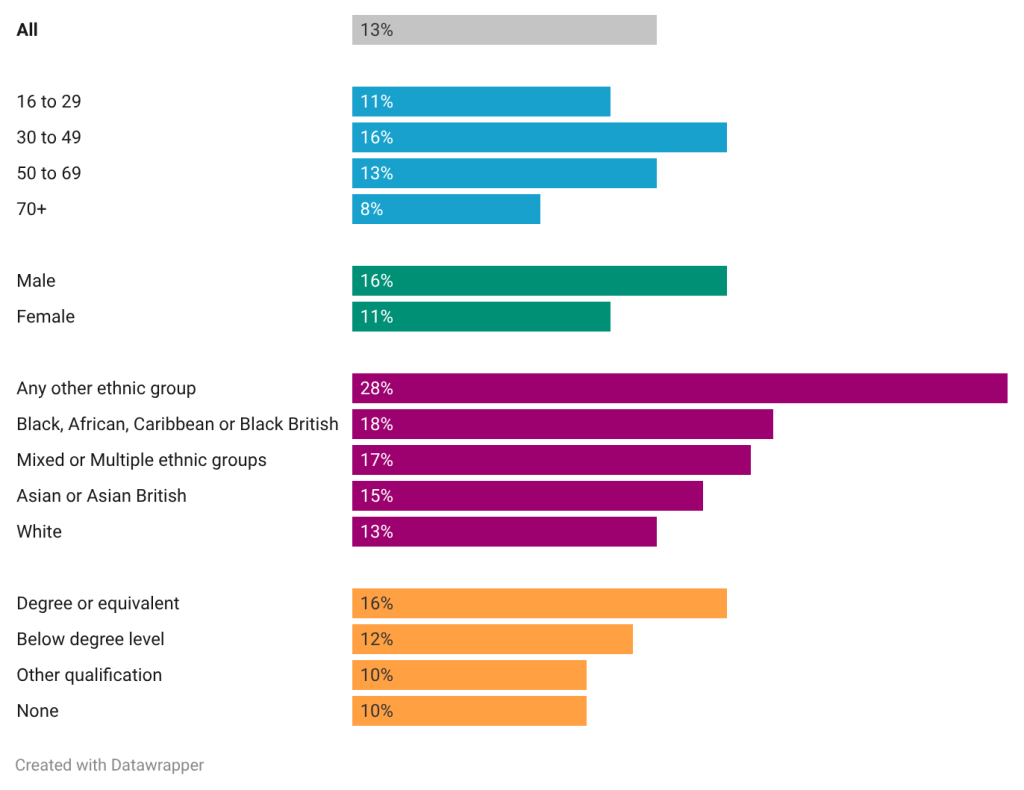
Source: ONS estimates green jobs in the UK. Note Based on ONS validated results. Estimates for any other ethnic group based on small sample (30).
A higher share of green jobs in London is in business impact roles compared to the rest of the country (Figure 4). For example, in London, 47% of respondents who indicated their main job was green, selected that the green part of their main job was related to activities that improve the environmental impact of a business, compared to 36% in Great Britain. This finding reflects the structure of London’s economy, which is based on professional services, such as consulting.
Figure 4: Share of green jobs by activity, GB and London, June to July 2025
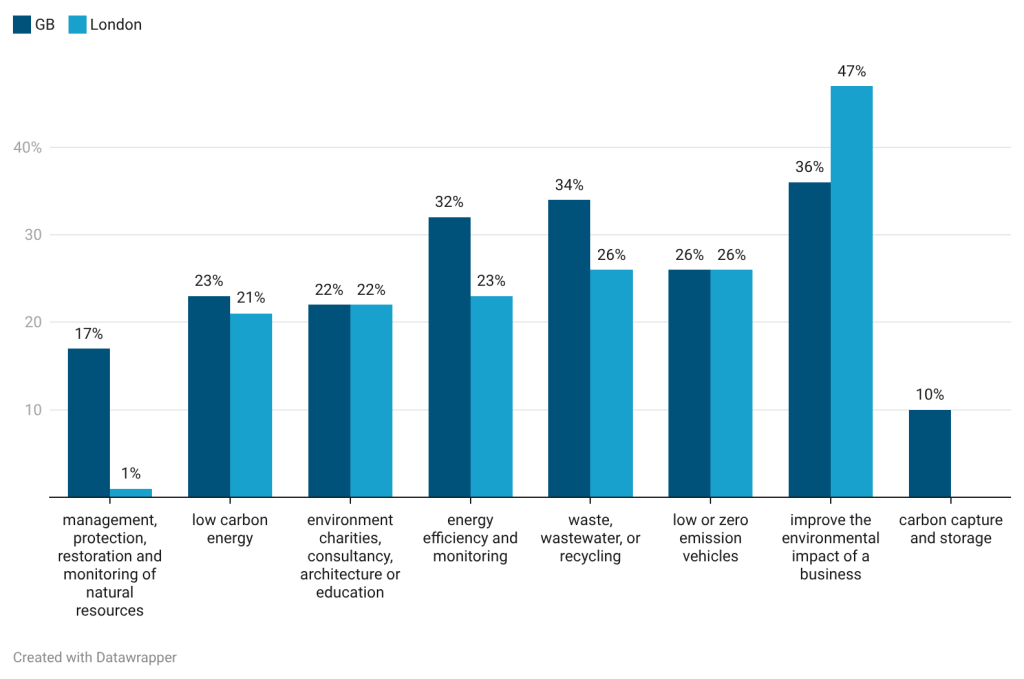
Source: ONS estimates green jobs in the UK.
Londoners are more interested in having a green job in the future (Figure 5). Based on the question “how interested a respondent is in having a ‘green job’ in the future” among those validated as not currently having a green job, 51% of respondents in London reported they were very or somewhat interested in having a green job in the future compared to 40% in Great Britain.
Similarly, respondents in London were also more likely to indicate an interest in undertaking training to be able to work in a ‘green job’, 46% vs 39% for Great Britain.
Figure 5: Interest in green jobs in the future and training among working adults who stated they carried out no green activities in their main job (validated)
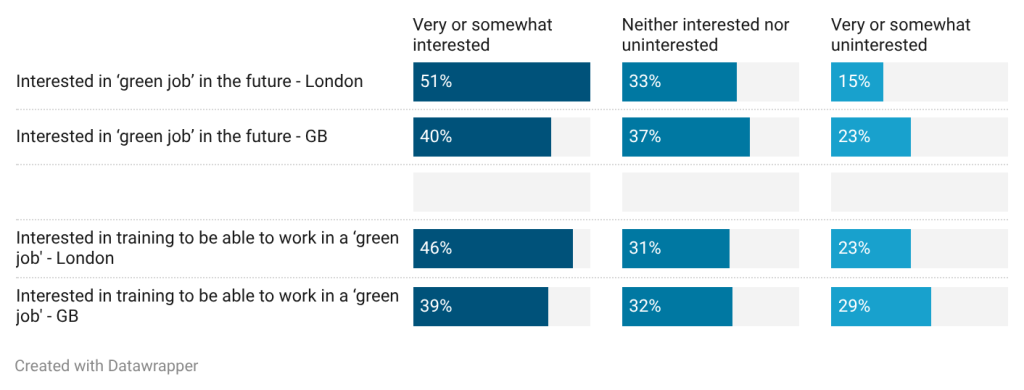
Source: ONS estimates green jobs in the UK. Note Based on ONS validated results. Estimates for London based on a sample size of 310.
People from Black and Asian ethnic minority groups, young people aged 16-29 years, men and those with a degree or equivalent are more likely to want a green job in the future (Figure 6), This analysis can help identify the potential groups where for example career guidance on green careers could be beneficial to support uptake of green related courses.
The data also finds for Great Britain interest in green-related training is the highest for Black and ethnic minority groups (Figure 6).
Figure 6: Share of working adults in Great Britain interest in a green job in the future or training to be able to work in a green job, June-July 2025
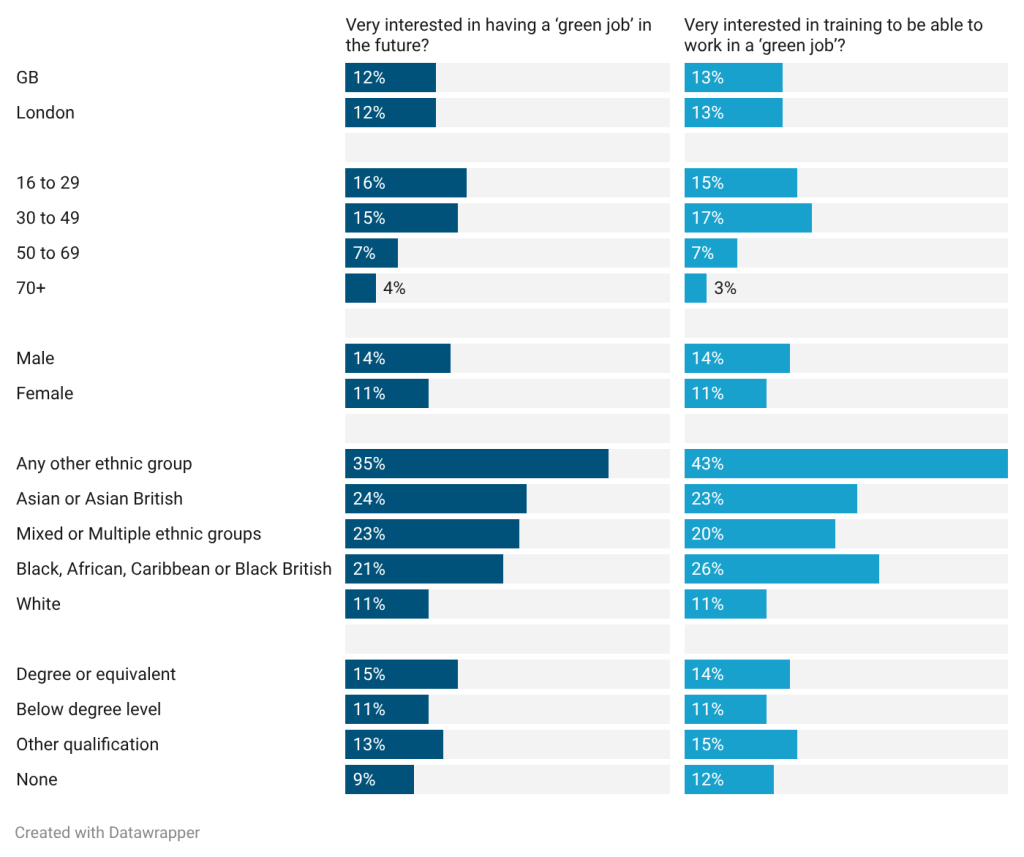
Source: ONS estimates green jobs in the UK. Note Based on ONS validated results. Green jobs in future: Estimates for any other ethnic group and mixed or multiple ethnic groups are based on small sample sizes (20 and 50 respectively). Interested in training: Estimates for any other ethnic group based on small sample (20), as with mixed and black or black British (sample size of 50 respectively).
The survey showed that people in green occupations rated their job benefits higher than their non-green occupation counterparts (Figure 7). The biggest difference was in ‘strong jobs security, with a contract that suits me’ and ‘my job gives me a sense of satisfaction’.
Figure 7: The benefits main job ‘green’ vs non-green job, London, June-July 2025
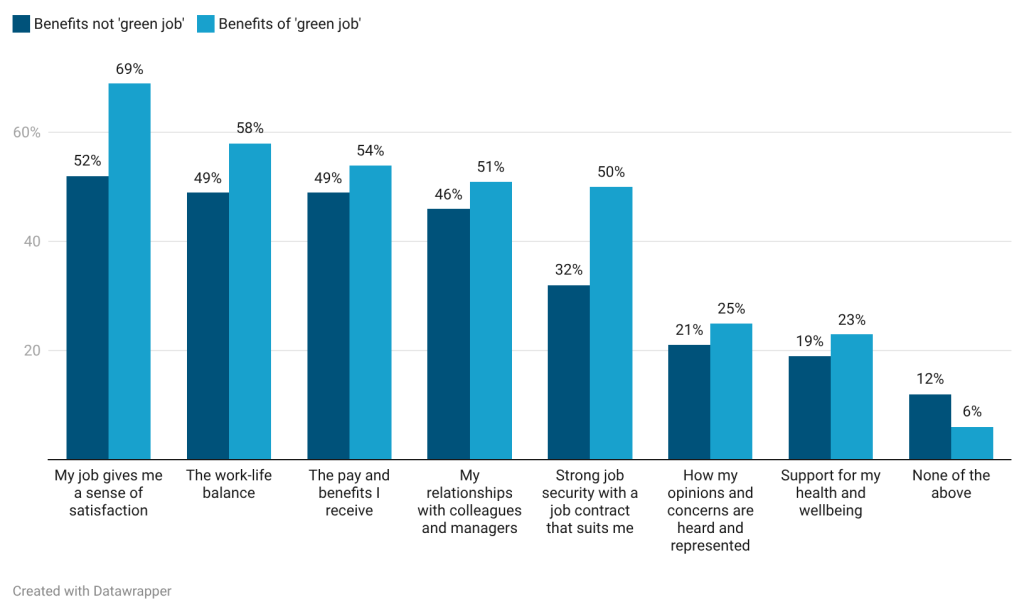
Source: ONS estimates green jobs in the UK. Note Based on ONS validated results. Finds for green jobs in London is based on a sample of 50, while non-green jobs a sample of 350.
Jobs in green firms
The firm-based approach to estimating green jobs measures all jobs in firms that are classified as green. The ONS uses data on greenhouse gas (GHG) emissions by industry and considers those industries that emit less than 1% of the UK’s total GHG emissions (and the firms in these industries) as “green”.
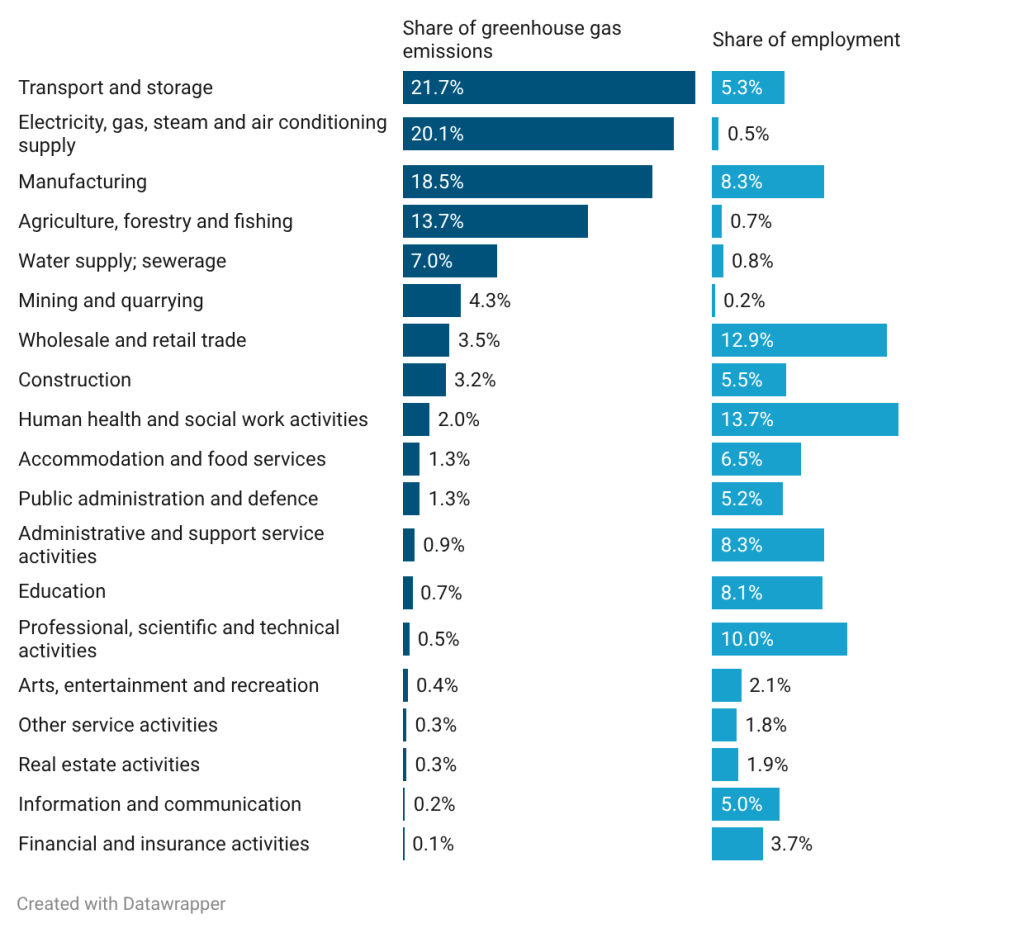
In 2024, industries which contributed less than 1% in GHG emissions, collectively accounted for 3.4% of total GHG emissions but employed 41% of total UK employees (or 11.1 million out of 27.3 million employees across the UK) (Figure 8).
Figure 8: Share of GHG emissions and employees, UK, 2024
Source: ONS estimates green jobs in the UK
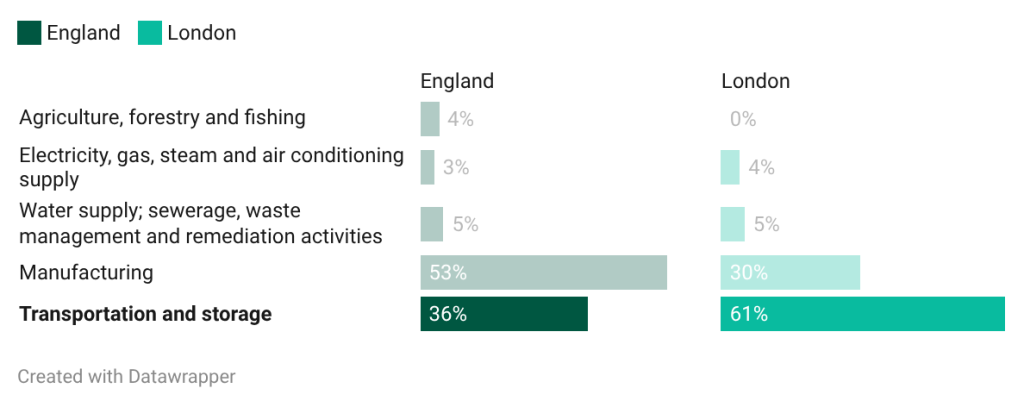
In London, employment in low-emission industries accounted for a higher share of employment compared to England. But transport and storage — responsible for 22% of emissions at the UK level — accounted for close to two-in-three (61%) of London’s high-emission jobs (Figure 9).
Figure 9: Share of jobs within high-emission industries in England and London, 2024
Source: ONS estimates green jobs in the UK
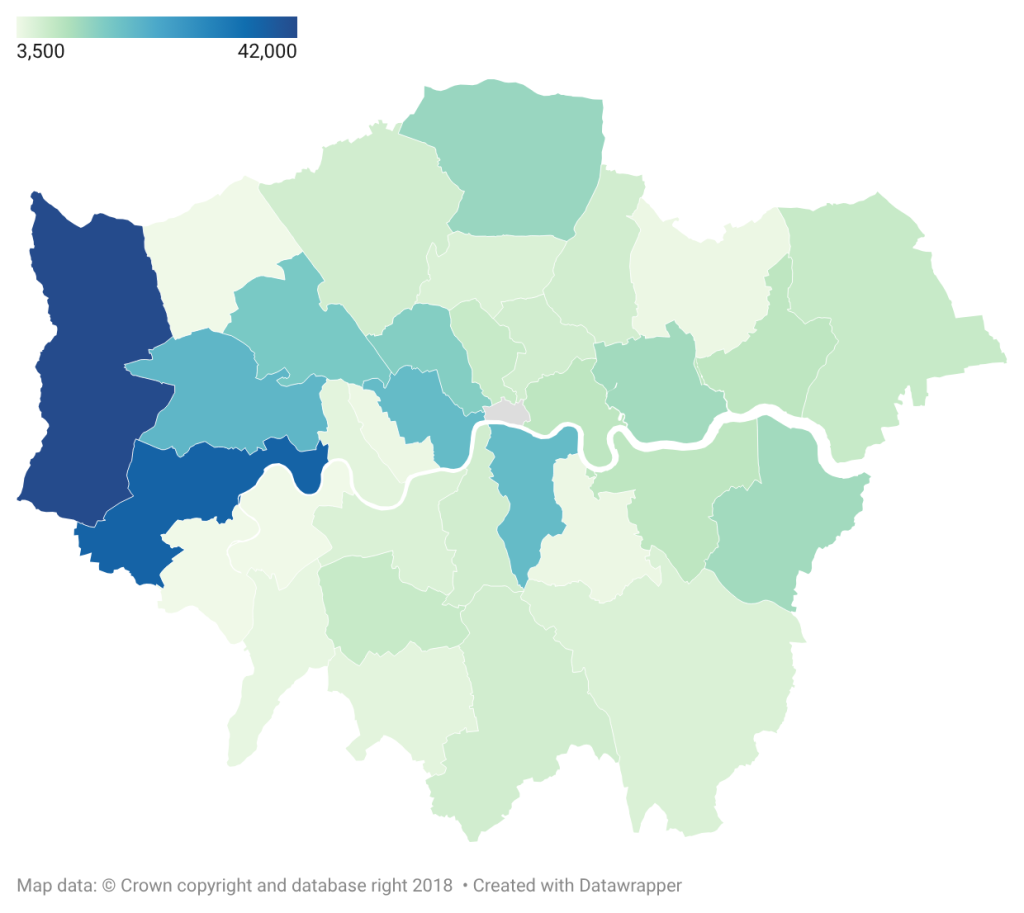
Low emission industries such as financial and insurance, informational and communication and professional activities are concentrated in central London. In contrast, high emission industries in London are located mainly in west London, particularly around Heathrow airport.
Figure 10: Employment in high-emission industries in London, by Local Authority, 2024
Source: ONS estimates green jobs in the UK
Further reading and analysis:
- Online postings for green jobs in London, GLA Economics, updated biannually
- Identifying Green Occupations in London, GLA Economics, 2022
- London Low Carbon Market Snapshot (LCEGS), kMatrix for the GLA, 2025
- The Future is Green, The economic opportunities brough by the UK’s net zero economy, CBI economics
- Green Jobs Barometer, PWC
- Measuring green jobs and skills, Nesta, 2023
- Green jobs: rapid evidence review, Nesta, 2023
- Clean Power 2030 Action Plan: Assessment of the clean energy skills challenge, DESNZ, 2024
- Are ‘Green’ Jobs Good Jobs?, Valero et al (LSE), 2022
[1] In March 2026, the ONS published estimates of Green jobs in the UK in 2024, defined as official statistics in development. This is an update on the experimental estimates of green jobs published in 2024 and contains revision of the data and refinement of the methodology.
[2] In the 12 months between April 2025 and March 2026, green roles accounted for 6.5% of all job adverts in the capital, an increase from 4.2% in 2019, and 6.1% for the same period in 2024/25.
[3] UK Environmental Accounts data for 2024 are not yet published. For this work, the ONS used sources such as LCREE (the Low Carbon and Renewable Energy Economy Survey) and EGSS (Environmental Goods and Services Sector estimate) as well as the Business Register and Employment Survey (BRES). These data should be considered as provisional estimates until the next UK Environmental Accounts publication in summer 2026.
[4] No data available for energy storage and grid infrastructure.
[5] Demographic breakdowns are based on smaller sample sizes. See for more information Green jobs estimates from the Opinions and Lifestyle Survey, Great Britain – Office for National Statistics