
Unemployment in key charts: Young Londoners hit hardest by labour market slowdown
Background
London’s unemployment rate rose to 7.5% in the last quarter of 2025 (non-seasonally adjusted). While London has historically seen higher unemployment than other parts of the United Kingdom, the gap was larger than usual (2.1 percentage points then in Q4 2025 compared to 0.5 percentage points in Q4 2019). That is despite the UK unemployment rate at the same time reaching its second-highest level in the past decade (5.4%, non-seasonally adjusted, in Q4 2025).
The rise in unemployment comes amid a slowdown in London’s labour market that has seen jobs growth fall from the high rates that became common during the 2010s and during the recovery from the pandemic. London has seen reduced job growth and fewer people in payrolled employment from the start of 2025.
There are many reasons why unemployment might have risen nationally – from policy-related increases in employer national insurance contribution (NIC) and the minimum wage, including a 17% rise for people aged 18-20 years-old, announced in Autumn 2024; to the rise of AI or the macroeconomic cycle of high interest rates designed to lower inflation.
There is also no single factor explaining the widening unemployment gap between London and the UK. Importantly, the UK macroeconomic climate has worsened, with UK GDP growth slowing to 0.1% in Q3 and in Q4 2025. GLA Economics nowcasts of gross value added (GVA) for London point to similarly sluggish growth (although indicators outside the labour market suggest that London’s economy has been more resilient than the UK average).
In general, London’s labour market showed during and after the pandemic that it is more sensitive to economic cycles. In the Covid-19 period, employment fell faster and deeper than the UK average, but also recovered sooner, and steeper. Even several years later, employment in London is further above its pre-Covid level than the UK average.
Moreover, the current slowdown has also hit several sectors that are particularly important in London, including professional and administrative services, information and communication, and retail.
However, broader measures of the unemployment rate such as the “U-5” rate – which includes those who are not actively searching but say they would like a job as well as the unemployed – suggests that the current gap between London and the UK is similar to its Q4 2019 levels (under 5%).
There are also widespread concerns across the UK about the national rise in the number of young people who are Not in Education, Employment or Training (NEET), which is the subject of the forthcoming Milburn Review (Young People and Work Report).
The data available does not allow firm conclusions to be drawn on the “why” of rising unemployment but this note brings together several different data sources on labour market participation to explore the changes in London over the recent period.
Unemployment and inactivity trends since 2019
Having declined to below pre-pandemic norms by early 2022, unemployment in London has since reversed course.
Figure 1, drawing from the ONS Labour Force Survey, shows that the number of unemployed individuals soared during 2024, before the announcement of changes in NICs and minimum wage rates, from around 200,000 to over 300,000 (dark solid line).
The four-quarter moving average (light dashed line) smooths out short-term volatility by averaging the latest four quarters of data. This also indicates a rise in unemployment similar to that seen during the pandemic in 2020. The unemployment rate – the share of people unemployed among those in work or actively looking for work – stood at 7.5% in the raw data and 6.6% using a four-quarter moving average in December 2025.
Figure 1: After a pause in early 2025, unemployment in London has begun to rise again – but data quality is challenging
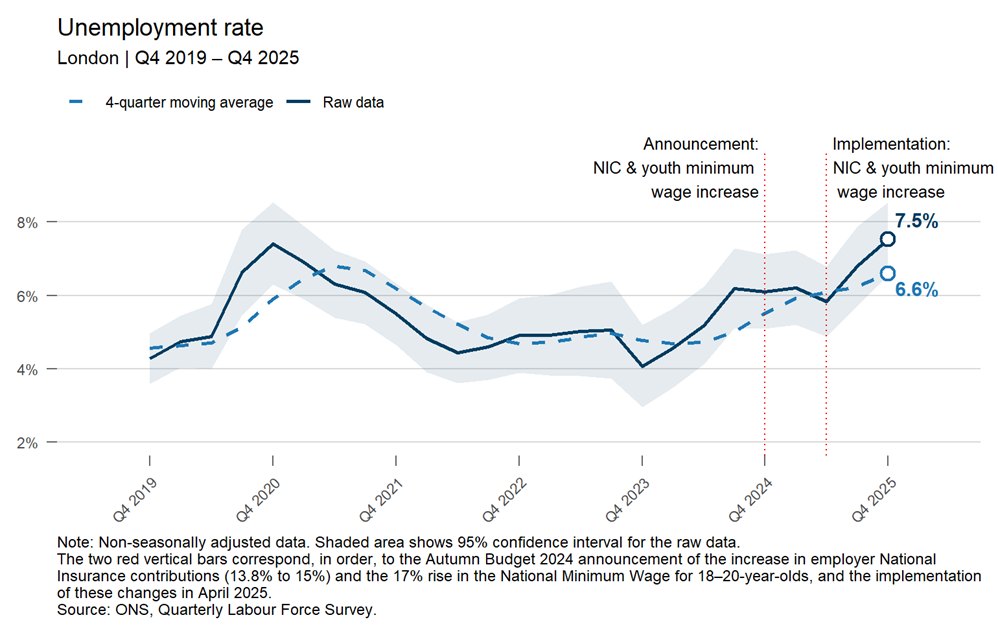
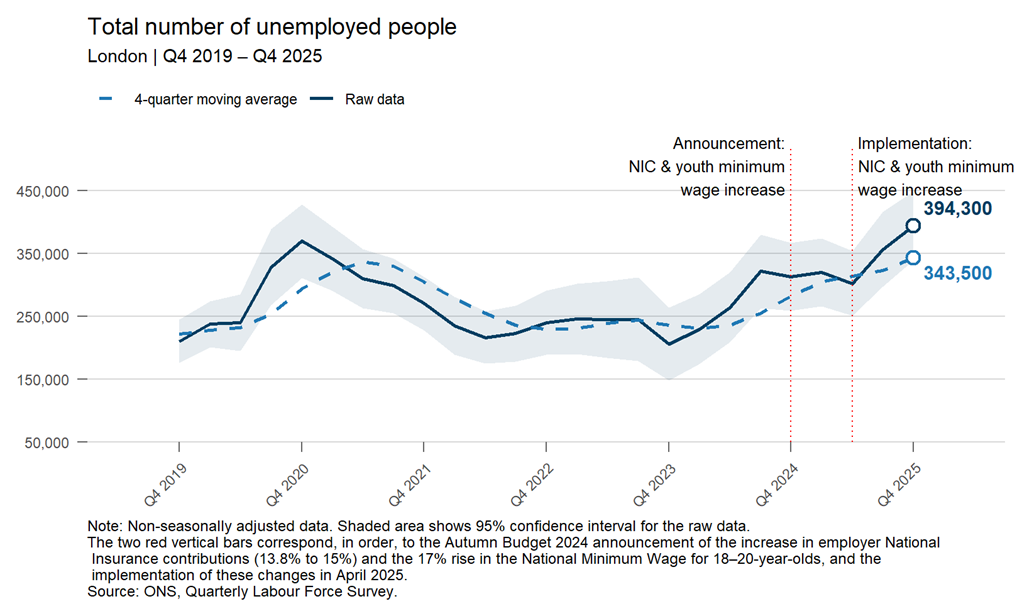
Figure 1 also shows the confidence interval (the lighter shaded area) for the estimate. The much wider bands depicted in the more recent data compared to pre-pandemic indicate that the data has become less reliable. This is a result of several problems in the ONS Labour Force Survey, where following the pandemic, fewer people responded to the survey, reducing sample sizes.
Despite some improvement, data challenges continue to undermine survey data reliability (especially at the regional level) adding uncertainty to what constitutes an underlying change in labour market trends versus methodological inaccuracies.
Economic inactivity, meanwhile, increased after the pandemic and remained above its pre-pandemic level for several years. Since late 2023, however, the rate has fallen and broadly stabilised. At around 20% of the working-age (16–64) population, inactivity is relatively low by historical standards, though there remains some uncertainty around the precise level.
Unemployment by age
To better understand what is driving higher unemployment in the capital we first break down the overall numbers into age groups. As the data are not seasonally adjusted and sample sizes by age are relatively small, we use a four-quarter moving average to smooth short-term fluctuations and better assess underlying trends (this means that our data is not directly comparable with that used in ONS publications.)
During the immediate post-pandemic period (roughly from mid-2021 to mid-2022) the economy emerged from lockdowns and the labour market tightened. This period saw unusually low unemployment at all age groups. Then, beginning in mid-2023, the labour market went into reverse and there was a pronounced rise in unemployment across all age groups – with the youngest age cohort in particular suffering the sharpest increase.
Figure 2: Unemployment among young people has risen since early 2024, although over the past year, increases have been large for older age groups
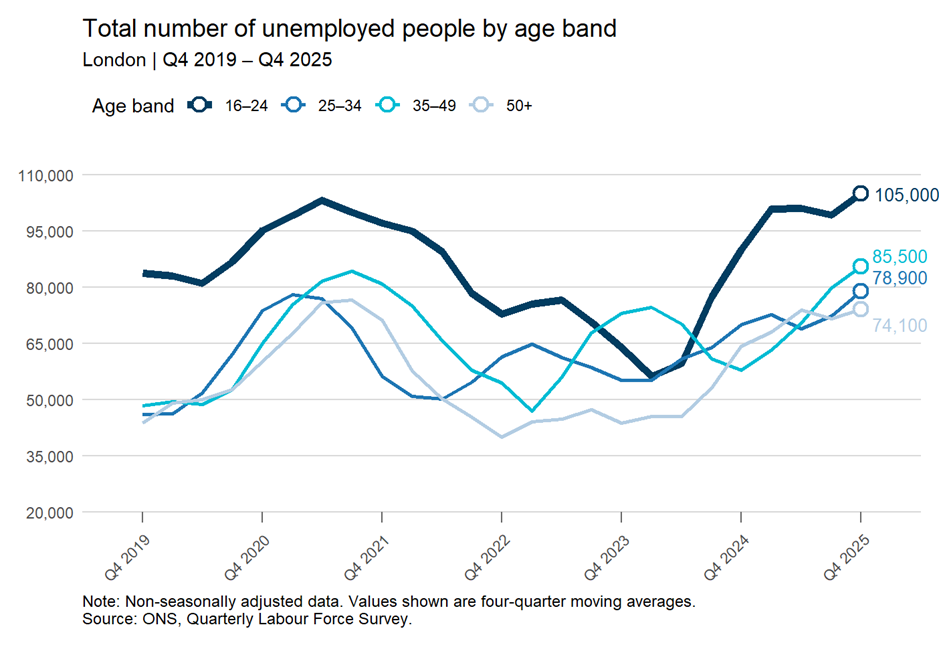
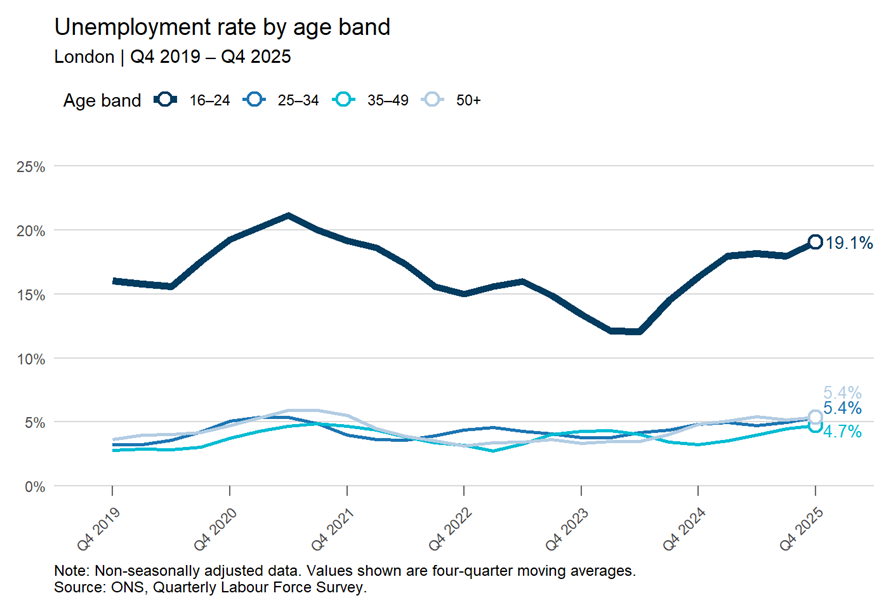
Figure 2 shows that unemployment in the 16-24 age reached around 100,000 people during 2025, putting the unemployment rate for that group at a four-quarter average of 19.1% in Q4 2025. It rose fastest during 2024 and early 2025 before reaching a plateau.
By contrast, unemployment among older age groups shows bigger absolute increases – both across the period 2019 to 2025, and during 2025 alone. While unemployment rates are much lower, that of the 35-49 age group rose by 47% between Q4 2024 and Q4 2025; and by 13% for those aged 25-34 and 50+.
Inactivity by age
While rising unemployment points to growing difficulty in finding work, it does not capture the full picture of the labour market. Trends in economic inactivity provide additional insight.
Figure 3: Changes in economic inactivity have tended to move in the opposite direction to unemployment
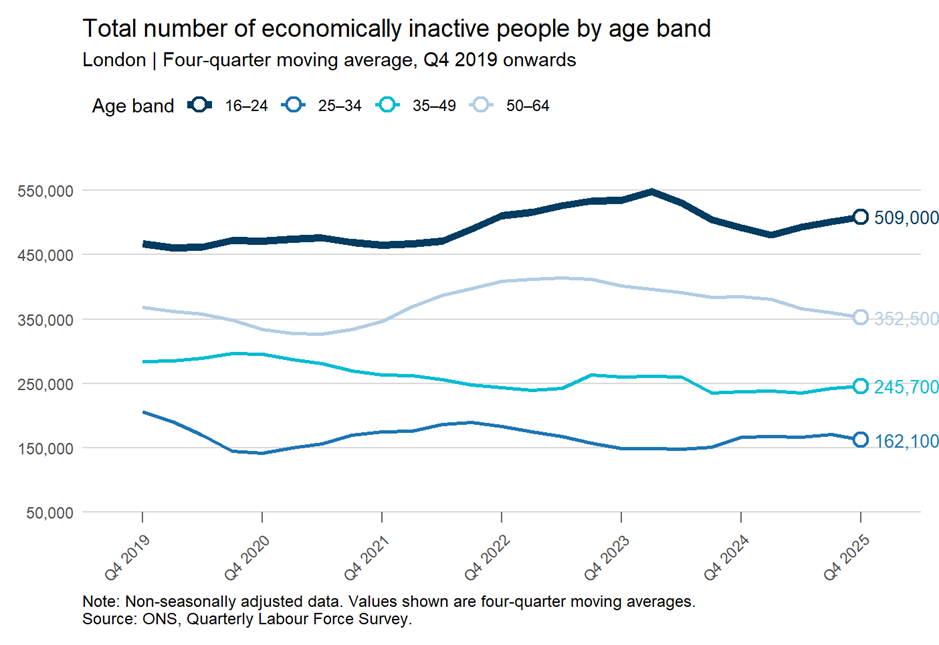
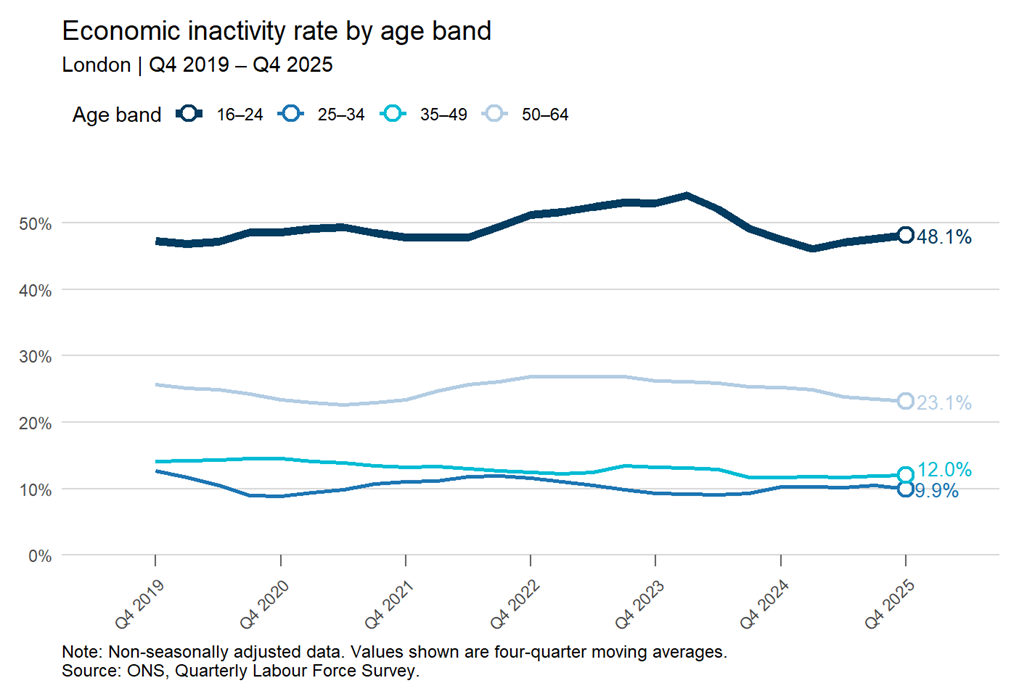
Figure 3 shows that the higher levels of inactivity compared to the fourth quarter of 2019 have been concentrated among those aged 16–24, reaching 48.1% by Q4 2025. Over the past year, inactivity has risen only for young people, while inactivity among those aged 25–34 and 35–49 has declined and among those aged 50-64 it remained broadly flat. Although inactivity among 16–24-year-olds has continued to increase, the magnitude and pace of the rise is smaller than during the post-pandemic 2022–2023 period, which was when it peaked.
Some of the recent rise in youth unemployment potentially reflects young people moving back into the labour market, or new entrants searching for but unable to find work. Bringing unemployment and inactivity together, the decline in inactivity among 16–24-year-olds from late 2023 to late 2024 coincided with the increase in unemployment over the same period. This suggests that some previously inactive young people have started to actively search for jobs. However, this relationship appears to have weakened slightly in more recent quarters with both unemployment and inactivity rising simultaneously. That suggests weak job creation and general labour market conditions slowdown.
Figure 4: Rising student inactivity accounts for the majority of the increase in youth inactivity since 2019
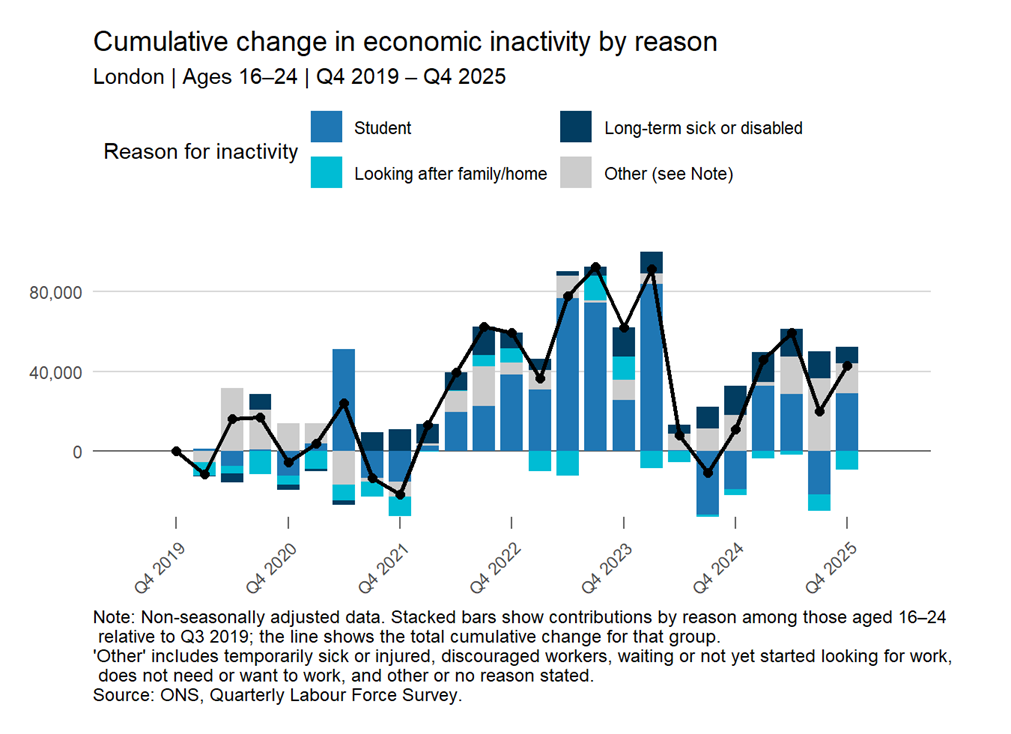
Disentangling the underlying trends from the data quality issues remain as challenge. That is particularly true of the situation for young people, where the distinction between economic inactivity and unemployment is blurry. Figure 4, shows, for example, that whether those that are studying are looking for work or not explains almost all of the changes in the 16-24 inactivity rate over the last six years.
Evidence from other data sources
Importantly, changes in unemployment and inactivity are affected by several data collection challenges, which complicate their interpretation. These include how respondents to the Labour Force Survey self-describe their economic circumstances, small sample sizes (response rates for young people are particularly low) that make the series highly uncertain, and the possibility that the survey does not capture a fully representative sample of the population.
When analysing the labour market, we therefore complement the ONS Labour Force Survey with additional data sources, including HMRC Pay As You Earn (PAYE) Real Time Information on payrolled employees, the ONS Workforce Jobs series and the ONS claimant count, to provide further insights.
Figure 5: Employment levels in 2025 are lower than in 2019 only among young people
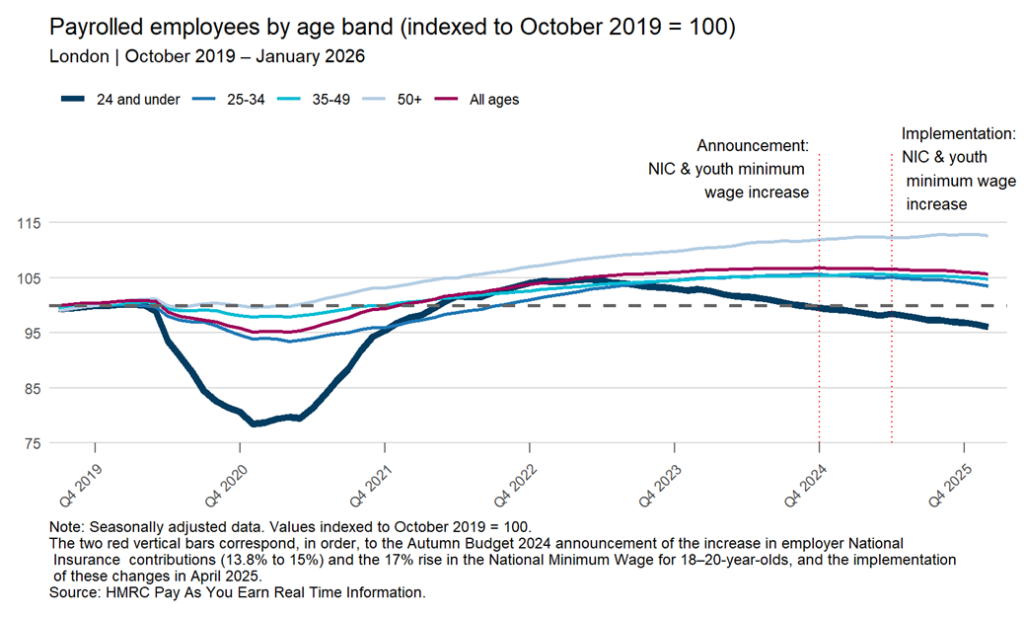
Monthly administrative data on the number of Londoners on Pay-As-You-Earn schemes (Figure 5) show that the number of employees recovered quickly after the pandemic across all age groups. The chart indexes levels to October 2019, meaning values above 100 indicate higher numbers on payrolls than pre-pandemic levels and values below 100 indicate numbers below those levels.
While total employee numbers peaked in October 2024 and were 0.9% below that peak in January 2026, most age groups remain above their pre-pandemic levels. The exception is people aged 24 and under. The number of employees in this age group began to decline in mid-2023 and continued to fall through 2025, below its 2019 level.
The evidence from the Labour Force Survey suggested that at that time economic inactivity started rising, with unemployment picking up a few quarters later. This evidence on payrolled employees in consistent with that picture. It also shows that weak hiring of young people began almost two years before the government’s announcements of higher employer National Insurance contributions and a large hike in the youth rate of the National Living Wage.
Two final pieces of evidence add to the picture of more recent labour market weakness.
The ONS Claimant Count measures the number of people claiming unemployment-related benefits – primarily Universal Credit and Jobseeker’s Allowance – who are required to seek work.
Across all ages, it shows little evidence of a sustained increase over the past year and a half, despite the marked rise in survey-based unemployment across most age groups.
However, the age breakdown tells a different story. Between January 2025 and January 2026, claimant numbers increased for 16–24-year-olds in nearly all London boroughs, while numbers for older age groups generally declined. This pattern mirrors the national picture, where only the youngest age group saw a clear increase in claimants over the same period.
Finally, the ONS workforce jobs series peaked in the quarter to December 2024 and fell by 1.8% in the following three quarters showing a clear slowdown in job creation.
Conclusions
Overall, the evidence suggests that London’s labour market has weakened over the past two years, with unemployment rising to levels not seen for more than a decade and jobs growth turning negative. These Labour Force Survey data are affected by ongoing quality challenges. But other data also point to broad-based pressures in the labour market – with those pressures appearing earlier, and becoming more acute, for young people.
These trends reinforce concerns about the labour market prospects of young Londoners but also underline the importance of cyclical labour market weakness.