
Rising unemployment and widening inequalities
Key Points:
- London’s unemployment rate has risen fast since the beginning of 2024, and remains higher than pre-pandemic levels, reflecting a prolonged period of labour market weakness.
- The data in this publication show that rising unemployment is increasingly concentrated in medium- and long-term joblessness, while those in work are finding it harder to move to different jobs.
- Traditionally marginalised groups in the labour market (people with disabilities, from Black and racially minoritised groups, those without a degree and younger Londoners) face both higher unemployment rates and longer periods out of work.
- Job-to-job mobility has weakened sharply since 2024, limiting opportunities for career progression and wage growth, particularly for younger and disabled workers.
- The stronger post-pandemic labour market temporarily reduced some labour market inequalities, but many of these gains have since reversed as economic conditions have weakened.
Background
London’s unemployment rate has been rising for over two years. The headline, seasonally adjusted, Labour Force Survey rate was 7.4% in the three months to March 2026 (or 6.6% on a four-quarter moving average basis). Since early 2024, the rate has consistently remained above its pre-pandemic benchmark of just under 5%, indicating a sustained period of weak labour market conditions.[1]
Figure 1: London’s unemployment rate has stayed elevated since 2024
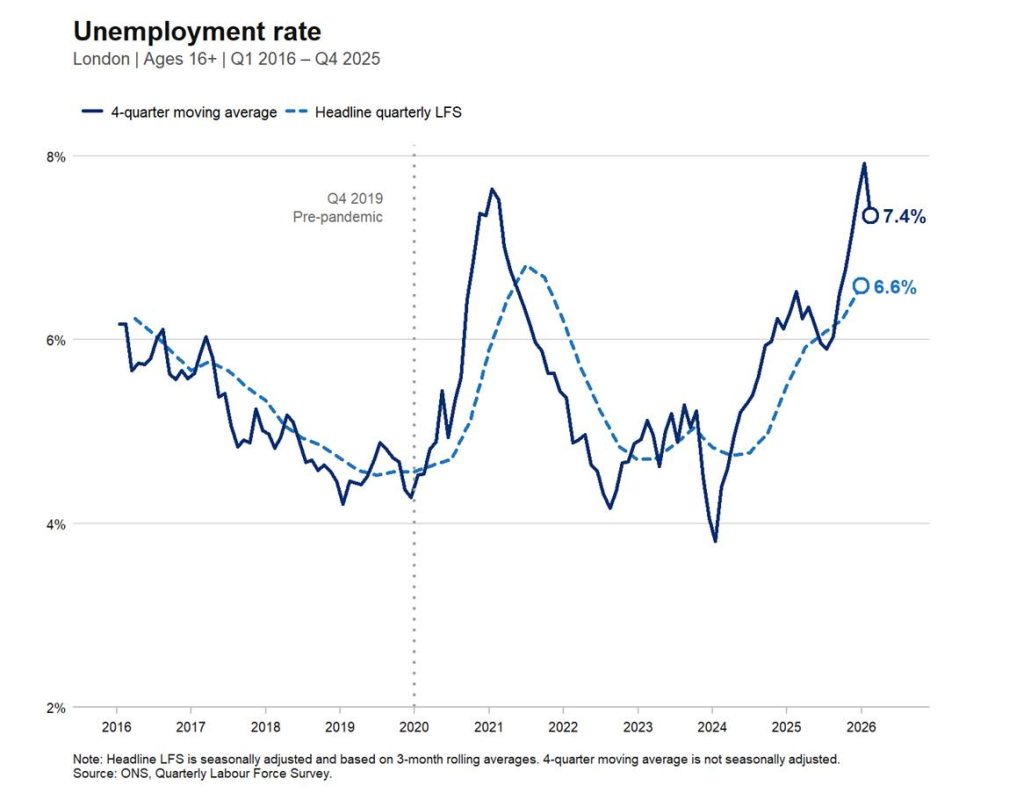
There is no single factor explaining the recent rise in unemployment in London. The broader macroeconomic backdrop remains subdued, despite a modest pickup in early 2026. The flash estimate (often revised) of UK GDP was up by 0.5% in February, following weak growth in late 2025. Since then, the conflict in Iran will have already pushed up input costs and will weigh on output and hiring over the coming months.
Monetary policy to bring down inflation is also weighing on labour market strength. Although the Bank of England has brought Bank Rate (its main policy rate) down to 3.75% from the 5.25% it reached in 2024, it continues to view weak labour demand as the main driver of labour market weakness.
More generally, London’s labour market appears more sensitive to economic cycles: for instance, employment fell faster during the pandemic but recovered more quickly, remaining further above its pre-pandemic level than the UK average.
Analysis of recent unemployment trends by GLA Economics identified that young Londoners were hit hardest by the labour market slowdown. For instance, between January 2025 and January 2026, claimant numbers increased for 16–24-year-olds in nearly all London boroughs, while numbers for older age groups generally declined.
Unemployment and its wider impact
High unemployment does not simply leave people out of work. It also affects the quality and security of work available, reducing opportunities for progression, limiting job mobility, and increasing forms of hidden labour market slack like underemployment.
This note examines how two key consequences of high unemployment, namely rising unemployment duration and falling rates of job-to-job transitions, have affected different groups of Londoners.
Unemployment durations are important because a large body of evidence highlights the scarring effects of unemployment. Longer periods out of work are associated with declines in mental wellbeing, erosion of skills, and reduced likelihood of securing future jobs.[2] The durations of unemployment therefore matter as much as the overall level.
At the same time, a weaker labour market reduces opportunities for job-to-job transitions, which are a key driver of career progression and wage growth. When vacancies are limited and hiring slows, individuals face greater barriers to re-entry and advancement. This is magnified for those already at a disadvantage. Job-to-job mobility also helps improve the matching of workers to firms. It allows individuals to move into roles better suited to their skills, supporting higher wages. Matching efficiency also raises economy-wide productivity, giving firms access to the talent they need to grow.[3]
Prolonged unemployment is more common among disadvantaged groups
Many spells of unemployment are short (less than three months) but people out of work for longer than that typically account for more than half of London’s unemployed. Over the period from 2015 to 2019, on average 43% of people were unemployed for less than three months, 33% for between three months and one year, and 25% were in long-term unemployment (for over one year).
Figure 2 shows that the overall composition of unemployment by duration has shifted, with most of the rise in medium- or long-term unemployment.[4]
Figure 2: Longer-term unemployment is rising fastest
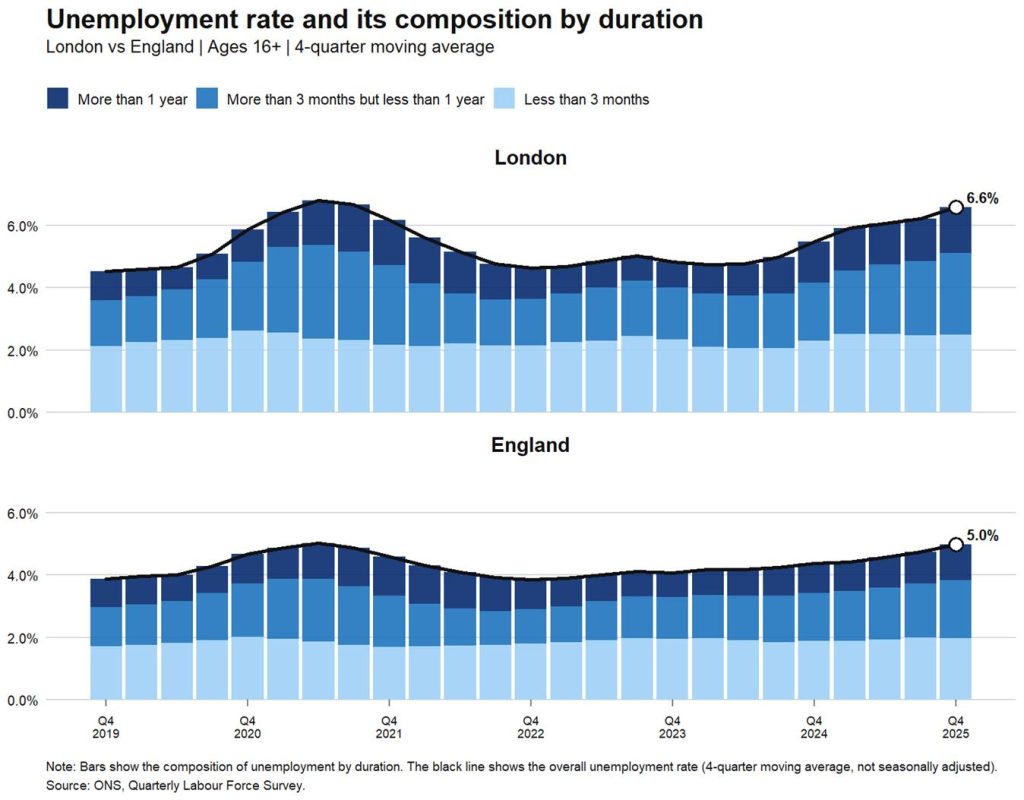
The share of unemployed Londoners in long-term unemployment (over one year) was about the same (23%) at the end of 2025 as it was at the end of 2024 (when it was 24%). But the share unemployed for between three months and one year increased from around 33% to 39% and, correspondingly, the share unemployed for less than three months fell from around 43% to 38%. Although there aren’t more people than usual becoming unemployed, fewer are finding work, and so durations are rising.
And, if the labour market remains weaker for longer, we would expect that medium and long-term unemployment will continue grow.
Figure 3: Unemployment is higher and more persistent for marginalised groups
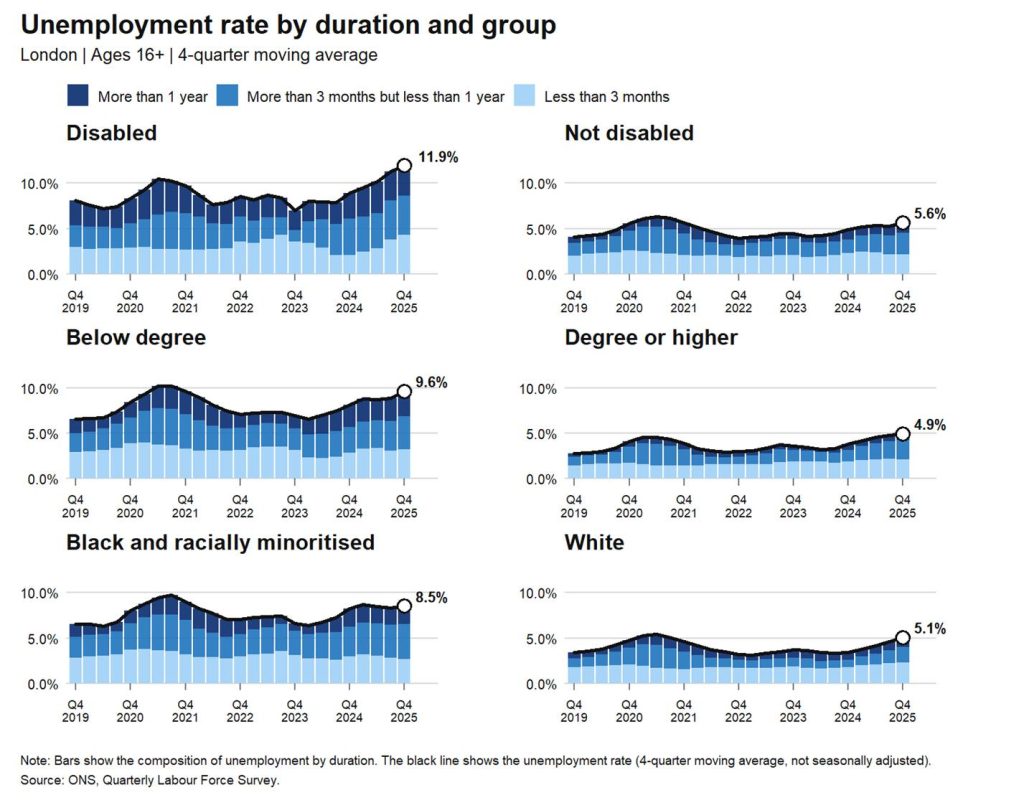
However, the picture differs markedly for some groups. Unemployment rates in London are consistently higher among people with disabilities, Black and racially minoritised people,people with low qualifications and young people. Unemployment rates have also risen more sharply for these groups in recent years.
For example, unemployment among disabled Londoners stands at 11.9%, more than double the rate for those not disabled (5.6%). Similar gaps are evident by qualification and ethnicity: those below degree level have an unemployment rate of 9.6% compared with 4.9% for those with a degree, while rates are 8.5% for Black and racially minoritised Londoners versus 5.1% for White Londoners. Changes in employment for women and men are, however, similar.
There is also evidence of persistence of unemployment in these groups. Among these groups, a larger share of unemployment is accounted for by medium- and longer-term durations. The recent rise in overall unemployment has seen this worsen. This is particularly pronounced for disabled people and those below degree level, where longer-duration unemployment makes up a substantial share of the total. By contrast, short-term unemployment dominates more clearly among non-marginalised groups.
Figure 4: Young Londoners face greater exposure to long-term unemployment
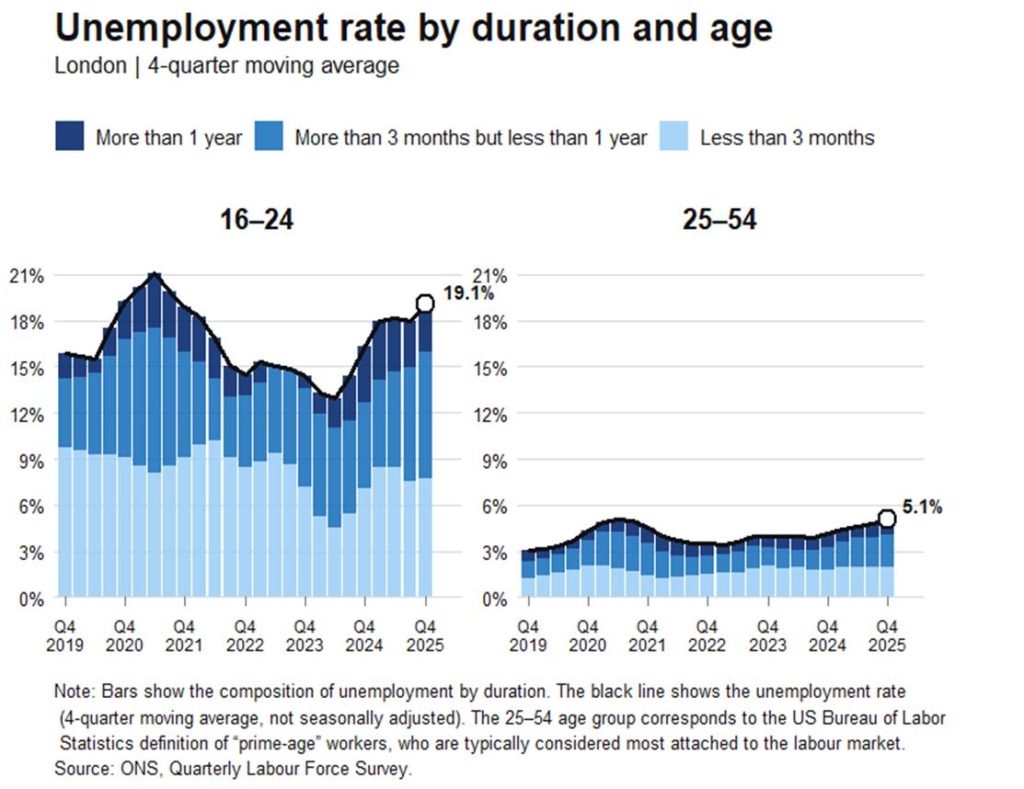
Among Londoners aged 16–24, unemployment has become more concentrated in longer-duration spells. In Q4 2019, around 61% of unemployed young people had been out of work for less than three months. By Q4 2025, the share unemployed for less than three months had fallen to around 42%.
Taken together, this suggests that under-represented and marginalised groups are not only more likely to experience unemployment, but also more likely to remain out of work for longer, creating deeper and more persistent barriers to work.
It also shows that the two-to-three-year period from the end of the pandemic – when the labour market was tight, employers complained of skills shortages, and inflation was high – saw under-represented and marginalised groups achieve much better employment outcomes.
Job-to-job mobility: moving jobs is getting harder
Another key impact of high unemployment is its effect on workers’ bargaining power. When many individuals are searching for jobs, firms face a larger pool of candidates and can replace workers more easily, reducing workers’ leverage. This makes it more difficult not only for the unemployed to find work, but also for those already in employment to find better paid or more suitable work.
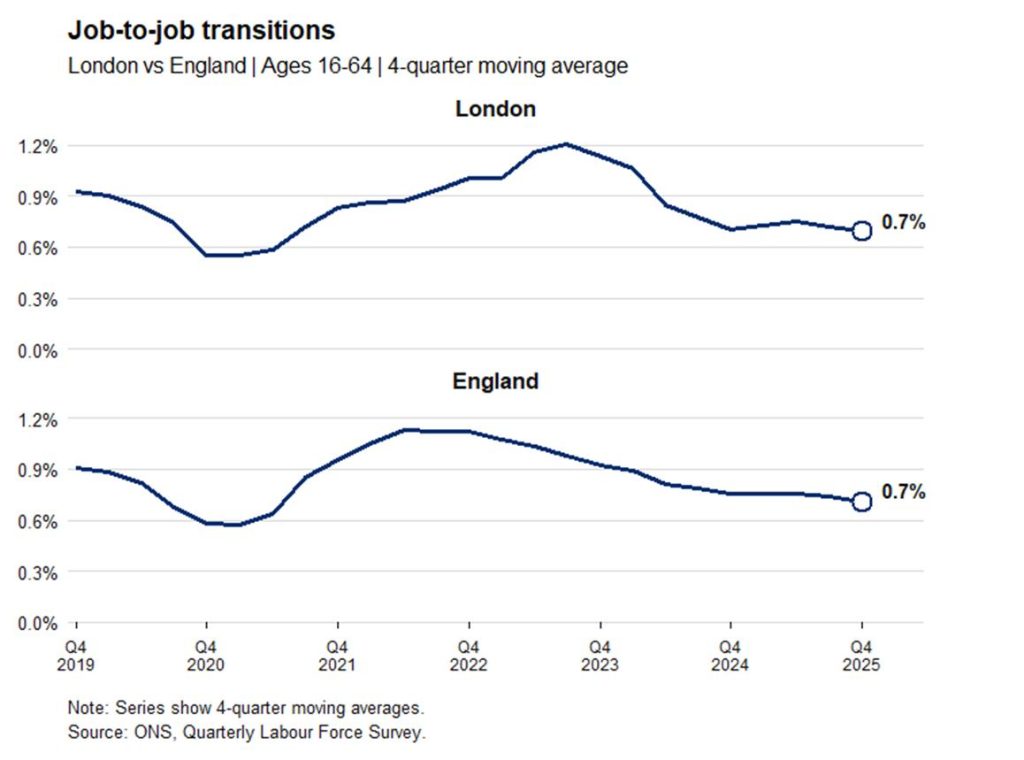
Figure 5 shows the rate of job-to-job transitions, defined as the share of individuals who resigned, i.e. willingly left their job, and entered another job within a three-month period, for London and England. For the average Londoner, job-to-job mobility has declined markedly in recent years. After recovering from the sharp fall during the pandemic, transition rates peaked around 2023–2024 at 1.2% before falling back to around 0.7% (about 0.2 pp below their pre-pandemic baseline). While this broadly mirrors the trend observed across England, London’s decline has come in a year later and is more pronounced.
This indicates that opportunities to move between jobs have weakened more sharply in the capital, limiting progression prospects even for those already in work.
Figure 5: Workers are switching jobs less frequently than before the pandemic
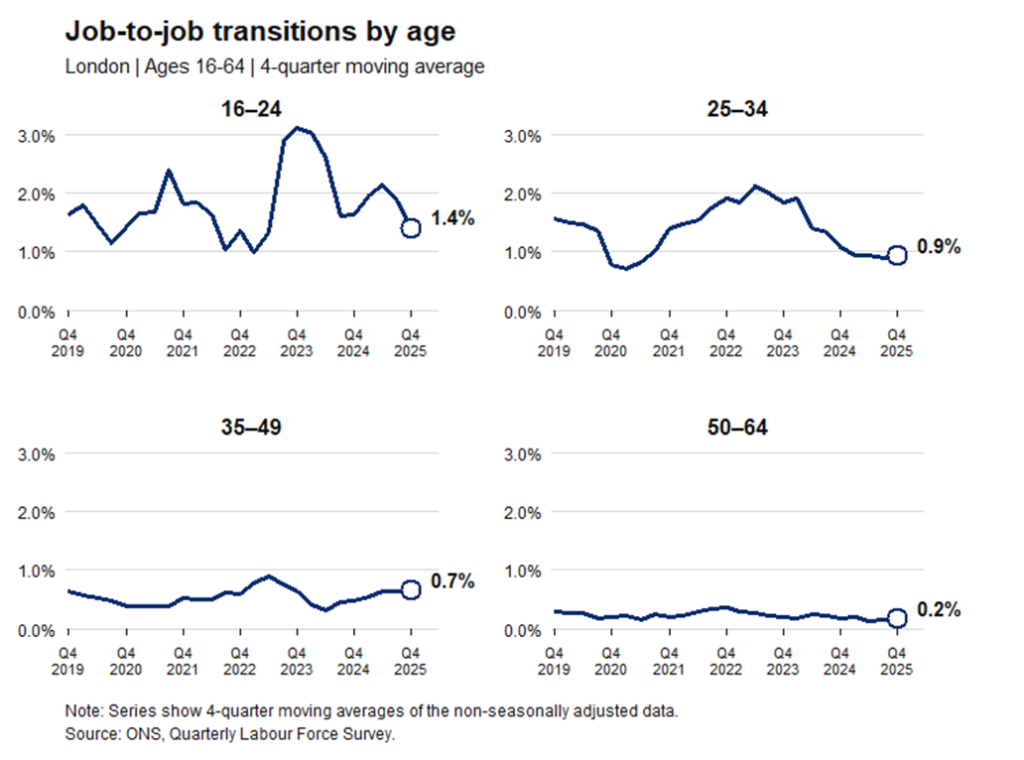
By demographic group, the largest movements in transition rates have been across age groups. Younger Londoners, particularly those aged 16–24 and 25–34, experienced sharp increases in labour market mobility during the post-pandemic labour market boom, with transition rates peaking at just over 3% and around 2.1% respectively in 2023 (Figure 6).
Since 2024, however, transition rates have fallen markedly across all age groups as labour market conditions have cooled. While most groups have broadly returned towards pre-pandemic levels, the decline among 25–34 year olds – early career adults – has been especially pronounced: before the pandemic, this group typically recorded transition rates of around 1.5%, but by Q4 2025 this had fallen to below 1%.
Figure 6: Younger Londoners have seen the sharpest decline in job mobility since 2024
Across most demographic groups, differences in job-to-job transition rates are currently limited, with broadly similar trajectories over time. For both ethnicity and qualification (not shown here), rates have converged to around 0.7% in the latest data (Q4 2025), with little difference between Black and racially minoritised and White individuals, or between those below and above degree level. By gender, women currently record slightly higher transition rates than men (0.8% compared with 0.6%), though trends remain broadly similar.
A clearer divergence has re-emerged by disability status (not shown here). Between 2022 and 2024, disabled individuals experienced higher job-to-job transition rates than non-disabled individuals, with rates peaking at around 1.3% in 2023. However, transition rates then fell sharply across both groups, with a steeper decline among disabled workers. By Q4 2025, the transition rate for disabled individuals had fallen to around 0.5%, compared with roughly 0.7% for non-disabled individuals, reopening a disability gap in labour market mobility.
Conclusion
More broadly, the 2022–2024 period suggests that tighter labour markets may temporarily reduce inequalities in labour market mobility. During this “hot” labour market phase – characterised by strong labour demand, high vacancies, and recruitment difficulties following the pandemic recovery – transition rates among traditionally marginalised groups were at times comparable to, or even above, those of their counterparts.
However, the sharper subsequent decline among, for instance, disabled workers suggests that these gains were relatively fragile and more easily reversed as labour market conditions weakened.
[1] The quarterly non-seasonally adjusted data used to calculate four-quarter moving averages were available only up to Q4 2025 at the time of writing. To smooth short-term volatility, all analysis of recent unemployment trends uses four-quarter moving averages (averaging the previous four quarters of data).
[2] See Nielsen and Reso (2011), Daly and Delaney (2013) or Tomlinson and Tholen (2023).
[3] See Hahn et al. (2017), Lise and Robin (2017) or Haltiwanger et al. (2018)
[4] A similar pattern is observed in England, where unemployment has also risen since mid-2024 and longer-duration unemployment remains elevated.