
Recent migration trends in the UK and London
Last November the Office for National Statistics (ONS) released statistics about net migration into the UK (ONS, 28/11/24) that provoked much media interest (for example BBC). This blog is intended to provide context to these statistics with respect to London. The first four sections present UK data, the fifth examines the available data at London level, and the final section discusses the implications of the findings.
Key points
- Long-term international migration flows to the UK sharply increased since 2021 to record levels.
- Net international migration to London was estimated to be 154,000 for the year ending mid-2023. This figure represents a new high and is nearly double that for the year ending mid-2021.
- Despite the recent increase in flows to London, its share of net migration has decreased from nearly half of the total in 2017 to around a quarter in 2022 and 2023.
Record levels of migration to the UK
There was considerable interest in these ONS statistics, not only because the estimate of UK net migration[1] was high (at 728,000 for the year ending (YE) June 2024), but also because values already released for previous years had been revised upwards. For example, for YE June 2023, the estimate was 906,000 in the recent release, while the estimate had been 672,000 a year earlier (ONS, 23/11/23).
Thus the recent high figures are due both to net migration having truly increased, and also to the ONS more fully estimating the extent of the flows. The ONS explained that their methods to compile migration statistics have changed and are still evolving.[2]
The ONS attributed “unprecedented levels” of long-term international migration since 2021 to factors including the war in Ukraine, the post-Brexit immigration system,[3] and demand for study-related immigration having been “pent-up” due to travel restrictions during the COVID-19 pandemic.
Figure 1 shows that the peak of UK net migration occurred in YE March 23, and how the recently estimated values (solid lines) substantially exceed the previous ones (dashed lines). Figure 1 also shows that while the increase in net migration between YE Jan 2021 and YE March 2023 was mainly due to increased immigration, decreased emigration also contributed.
Please note that all values after the YE June 23 are provisional and subject to revision.
Figure 1: Annual international migration flows, UK, 2012 – 2024 (provisional)
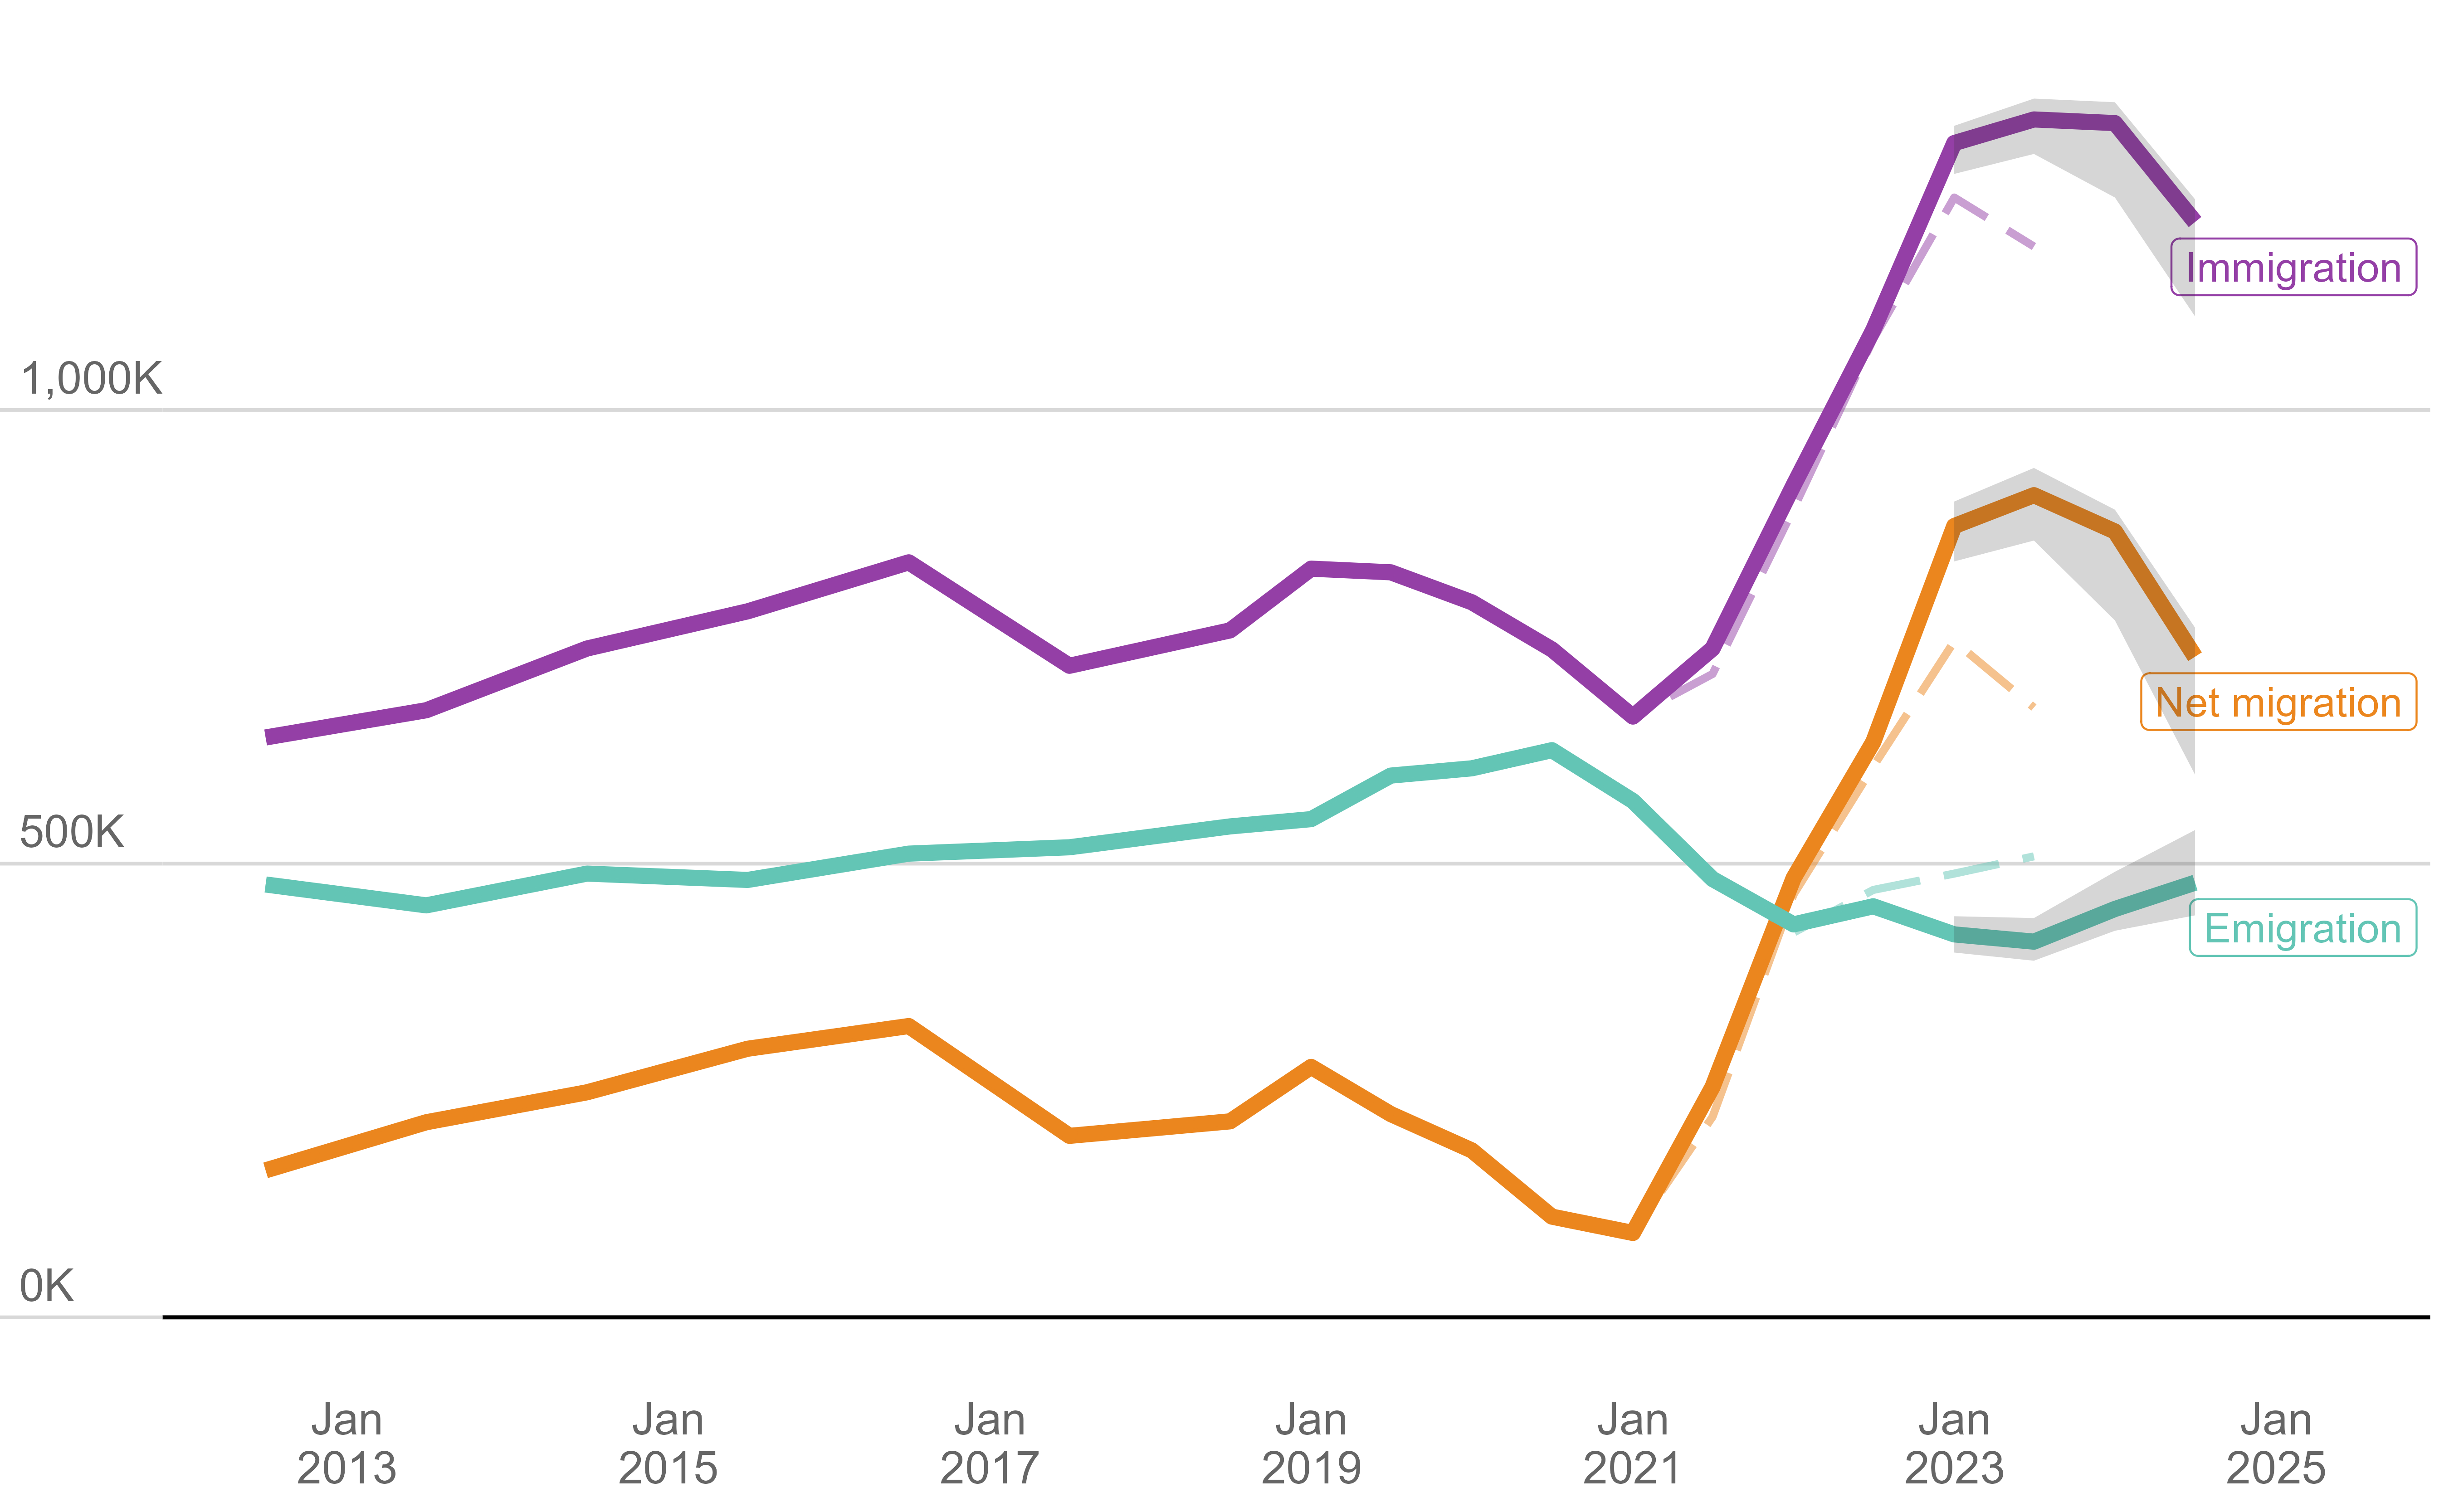
Source: ONS; Chart: GLA Demography; Shading shows 95% confidence intervals; Dashed lines show previous estimates
Change from majority EU to majority non-EU origin
Figures 2 and 3 show migration flows disaggregated by EU and non-EU origin. Figure 2 shows that EU immigration started to fall after the June 2016 referendum, and dropped sharply following the end of the Brexit transition period on 31 December 2020. Annual flows have been below 150,000 since YE June 2022, far below their 2016 peak of over 500,000.
The fact that EU migration is now negative indicates the large values of net migration shown in Figure 1 were due to changes in non-EU migration flows. Figure 3 indeed shows that non-EU immigration steeply increased after the new immigration system was introduced at the start of 2021, rising from around 300,000 to over one million during YE September 2022, and peaking at nearly 1.1 million during YE June 2023.[4]
Figure 2: Annual migration flows of EU nationals, UK, 2012 – 2024 (provisional)
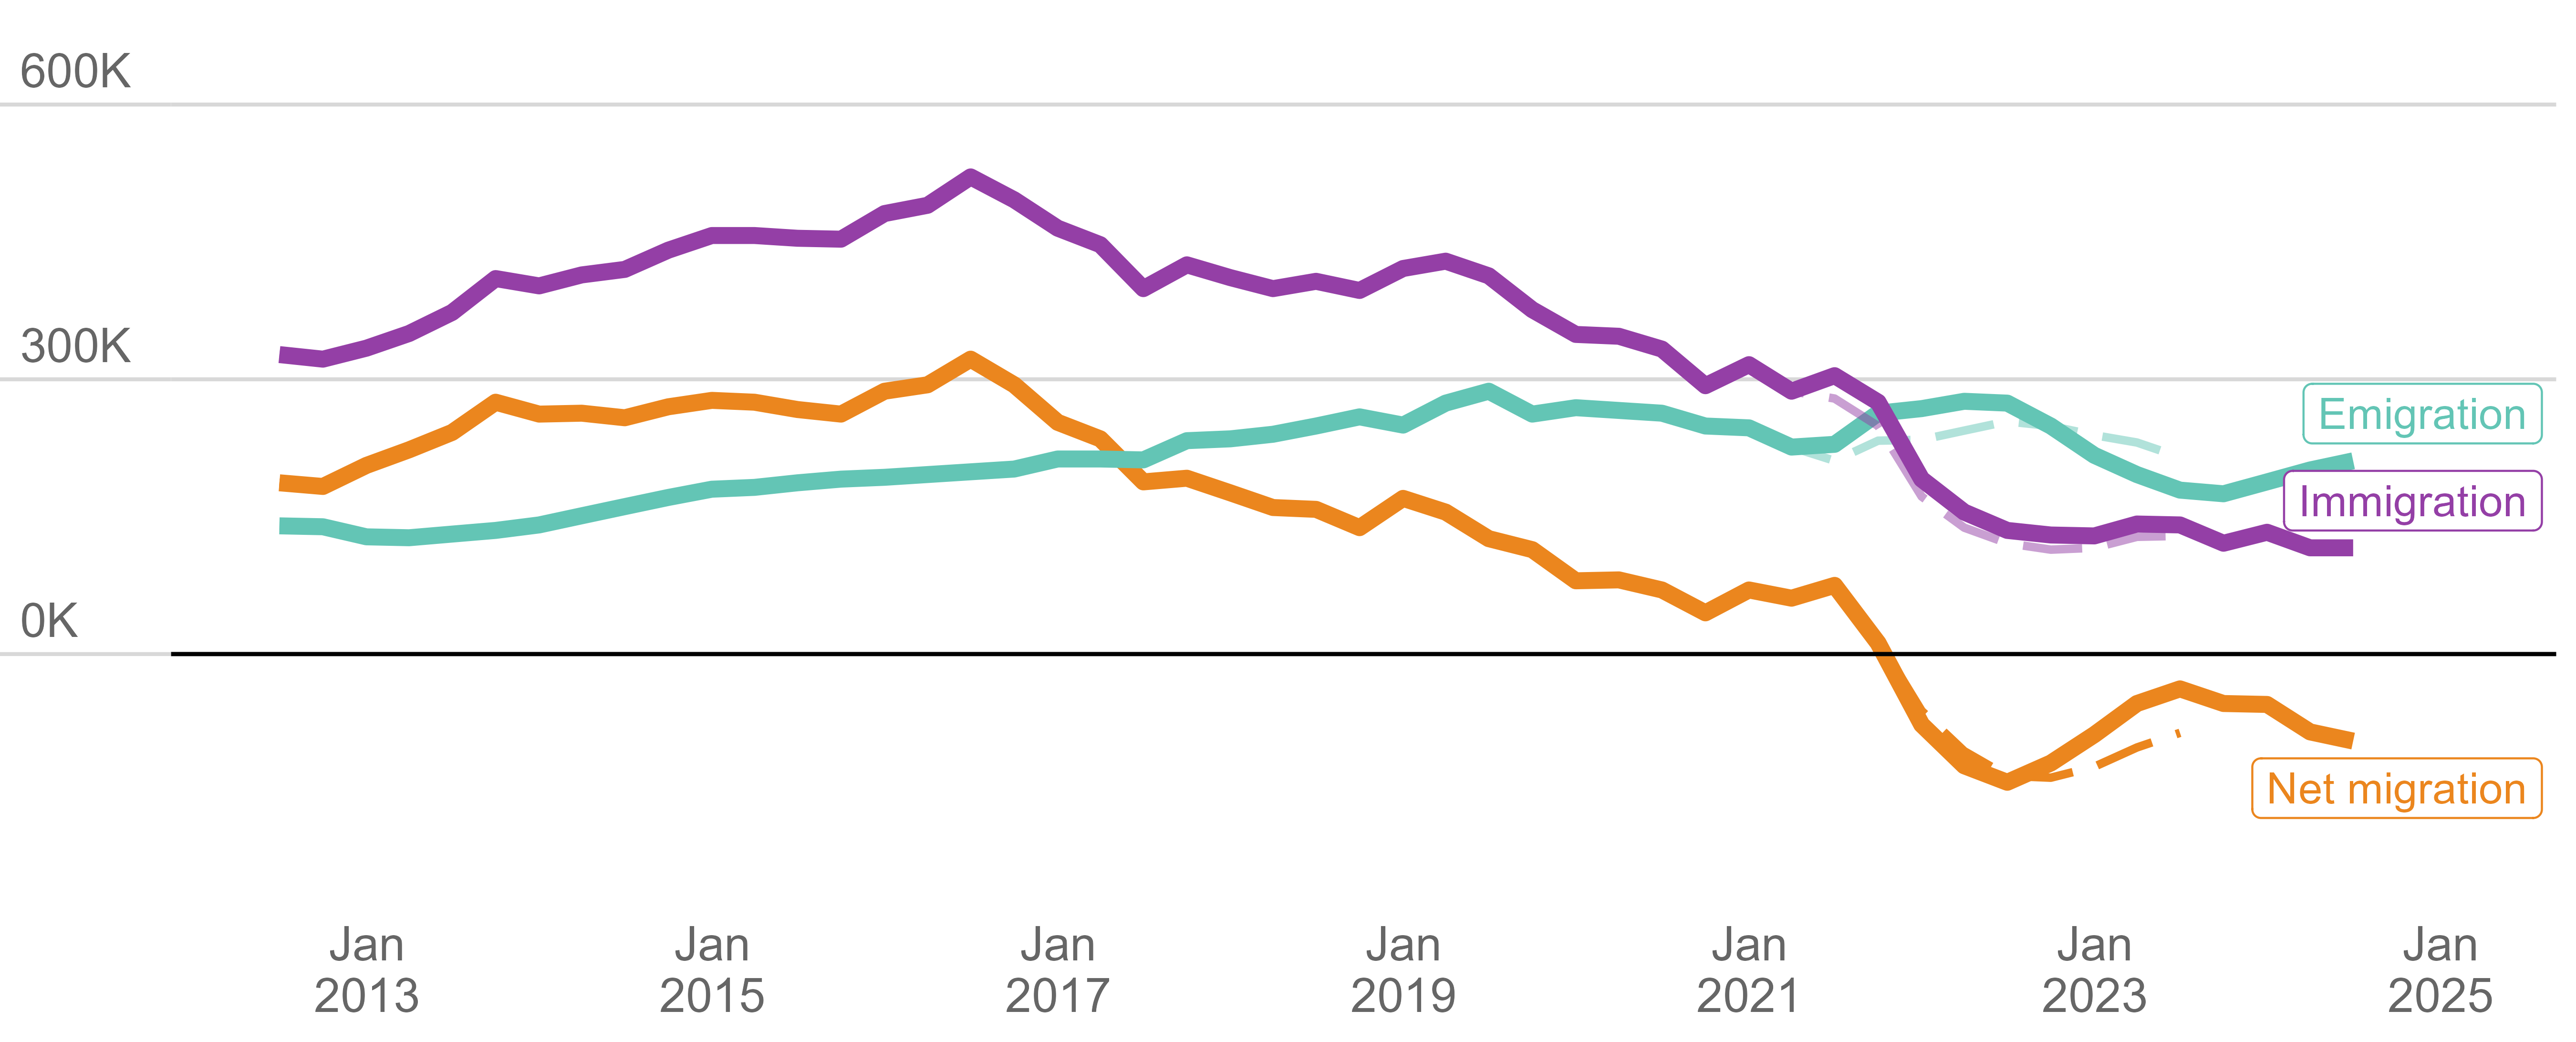
Source: ONS; Chart: GLA Demography; Dashed lines show previous estimates
Figure 3: Annual migration flows of non-EU nationals, UK, 2012 – 2024 (provisional)
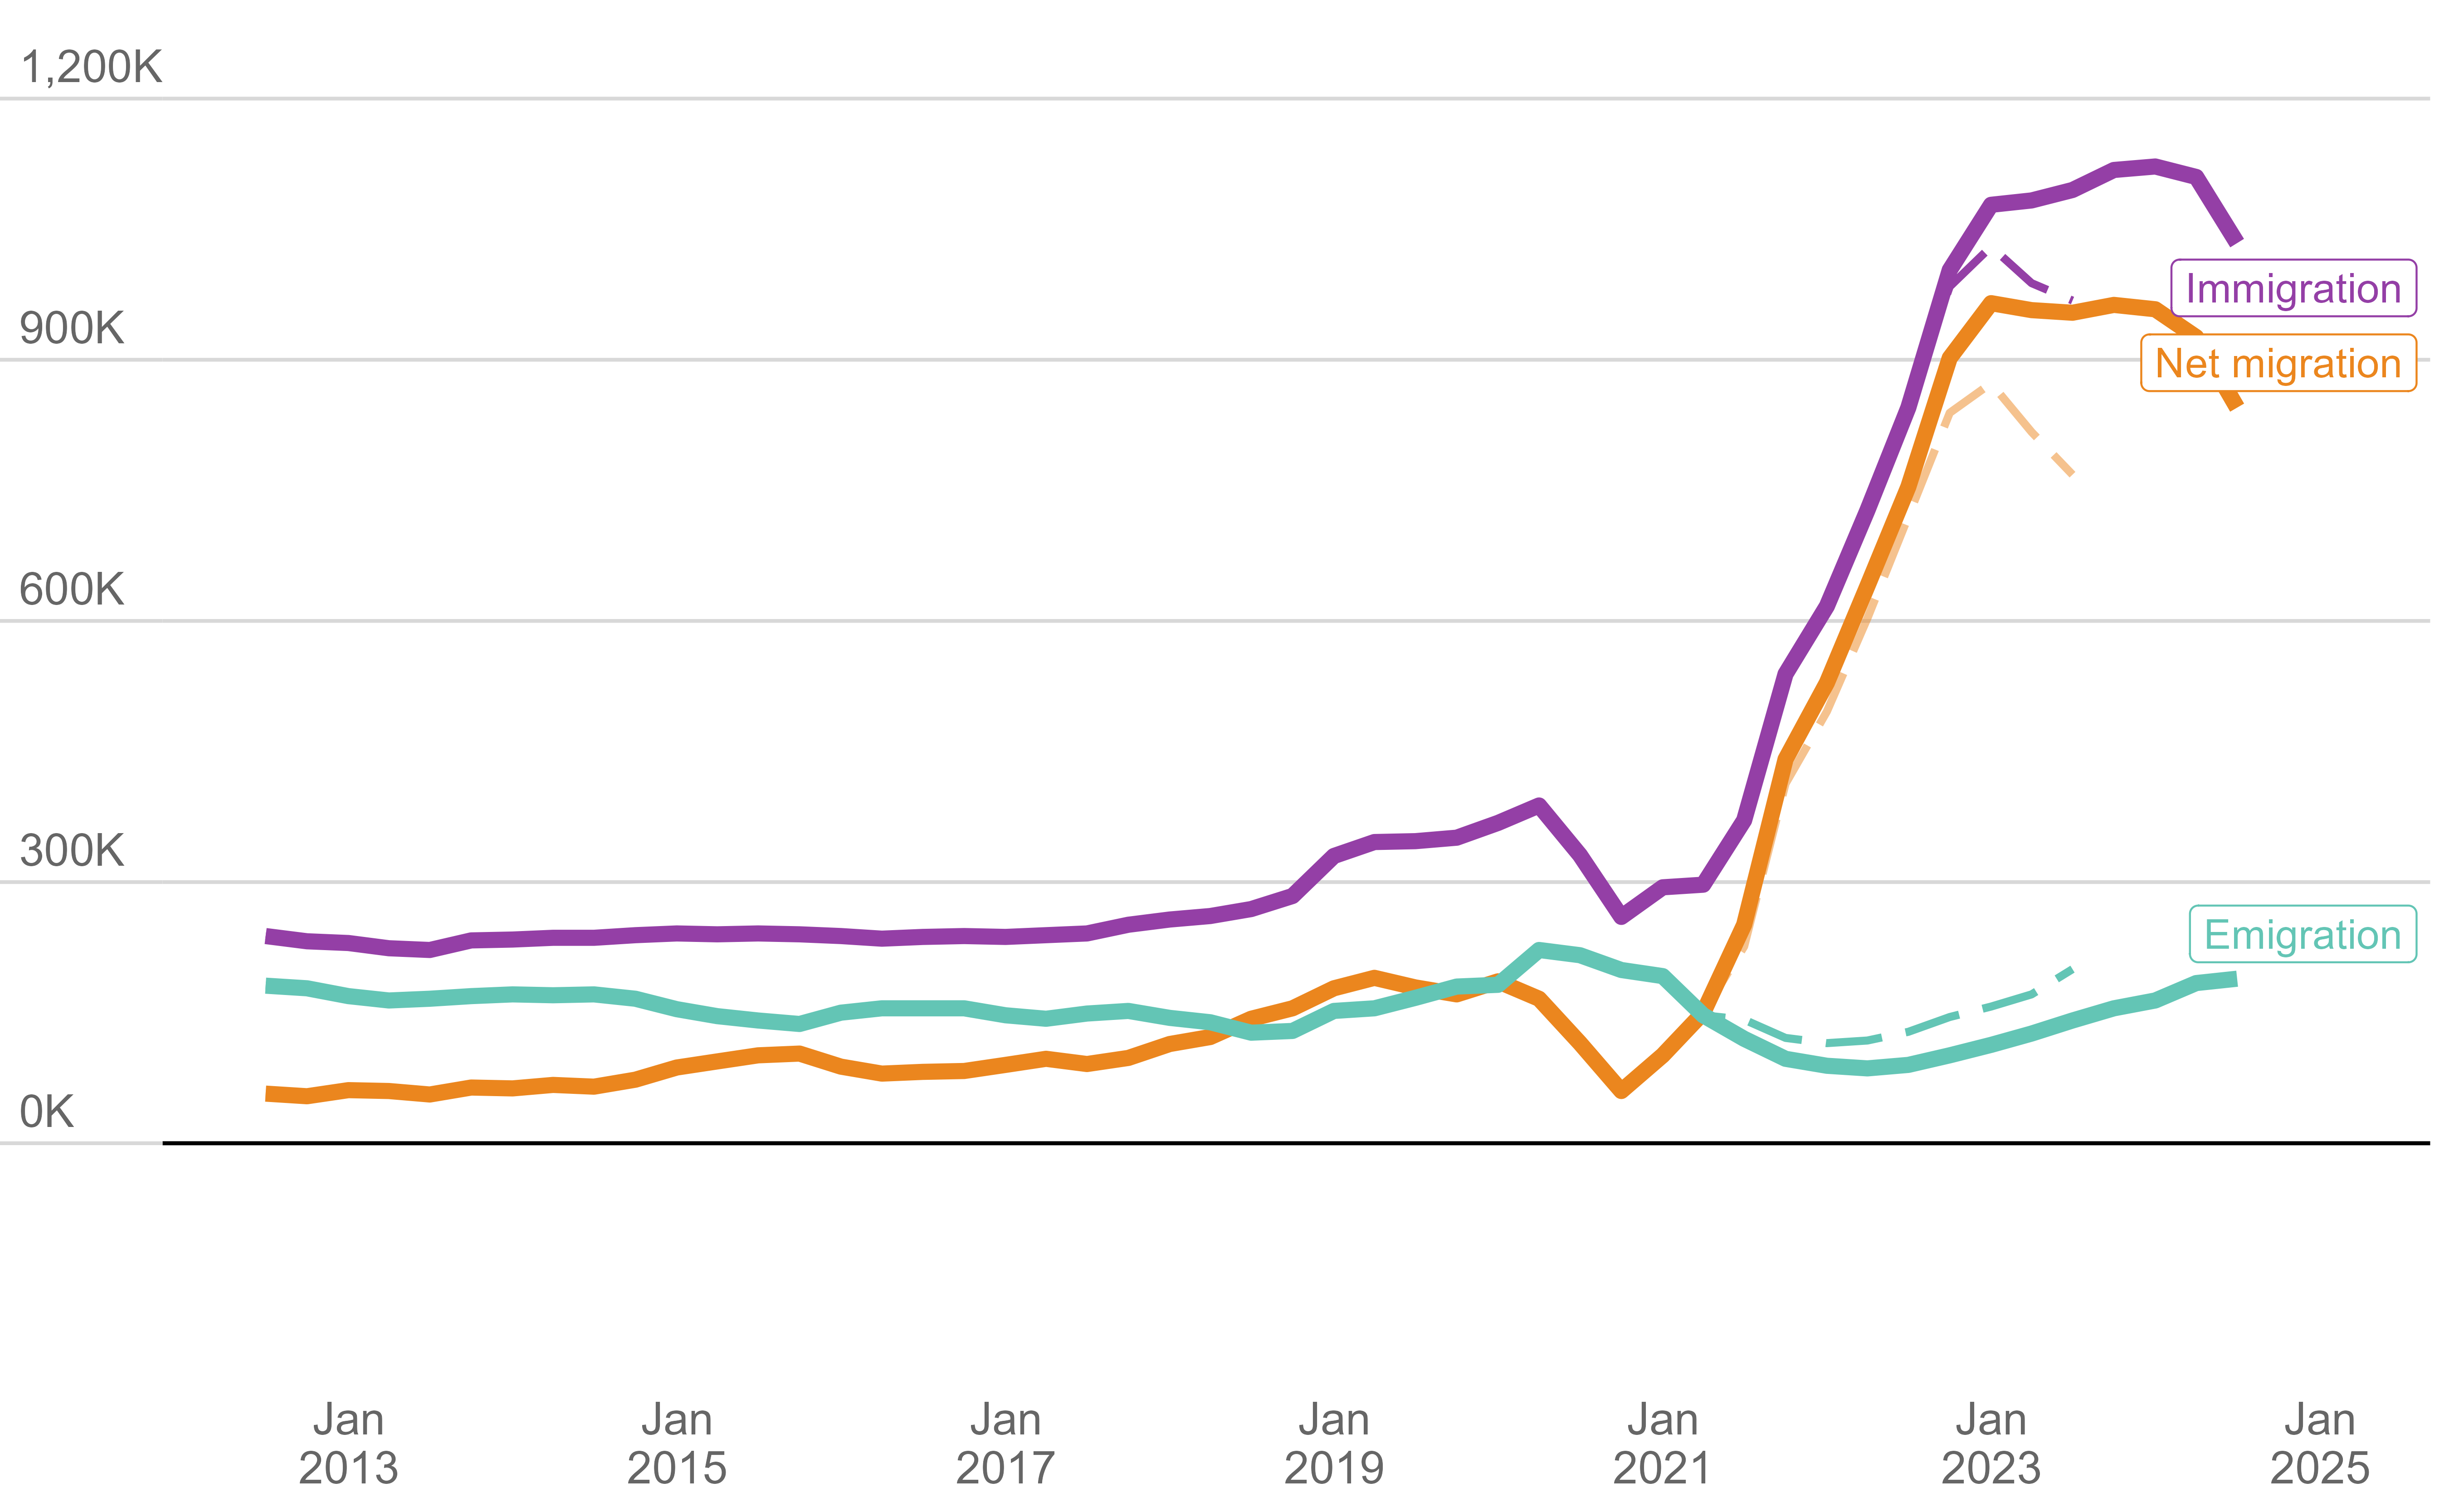
Source: ONS; Chart: GLA Demography; Dashed lines show previous estimates
Reasons for coming to the UK
We’ve seen above that the recent large increase in non-EU immigrants has been the main driver of the increase in net migration, so we will now consider this group in more detail. Figure 4 charts the data on reasons why non-EU nationals came to live in the UK in YE June 2023[5] (ONS, 15/07/24) based on their original type of long-term visa, their asylum application or arrival under a resettlement scheme.
Analysis by the ONS shows the main contributors to the recent increase in net migration are international students; health and care workers and their immediate family members (dependants); humanitarian visa schemes; and people claiming asylum (ONS, 28/11/24). Figure 4 shows that contrary to common public perception, visas related to asylum claims accounted for under 10% of the total (91,000 of out of around 1.1 million). Study-related visas were the largest category, accounting for nearly 40% of immigrants. Nearly half of the work-related visas were for dependents of the main applicant.
Figure 4: Number of visas by type, non-EU immigrants, YE June 2023
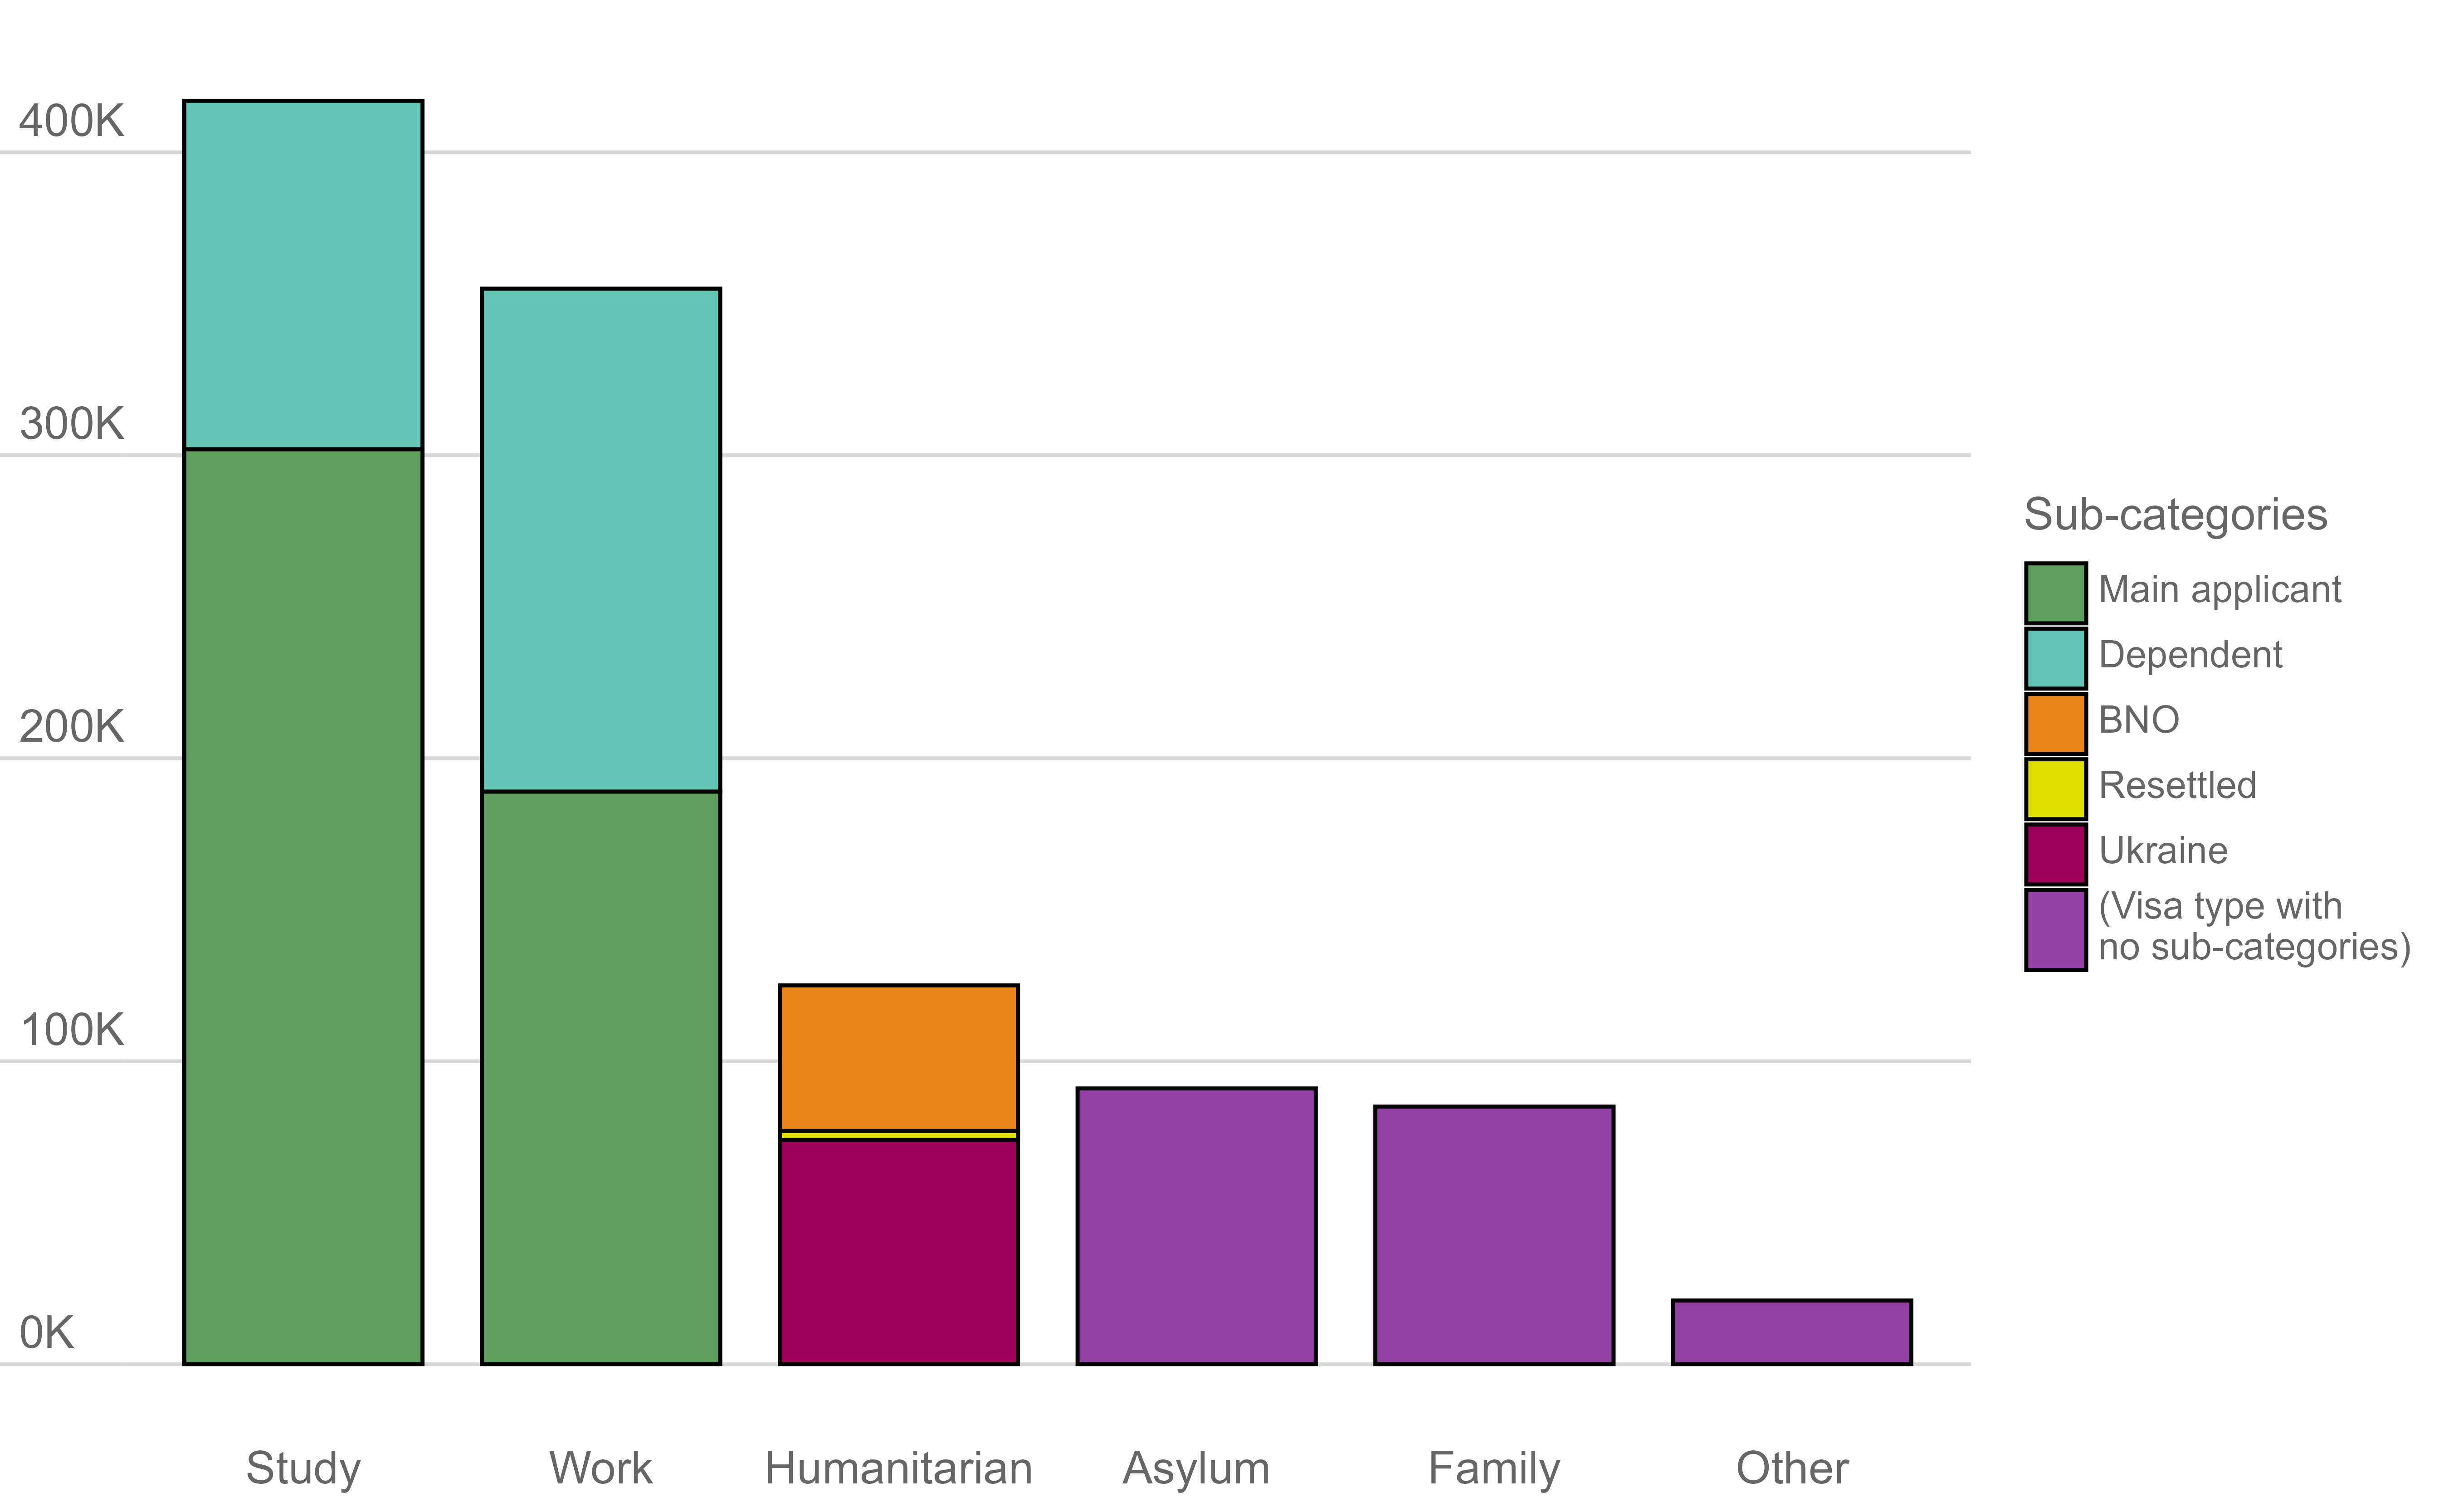
Source: ONS; Chart: GLA Demography; Sub-category BNO = British National Overseas
Countries of origin
Figure 5 shows the proportion of immigrants from the five numerically most important countries of origin in YE June 2023 – India, Nigeria, China, Pakistan and Zimbabwe.
Figure 5: Proportion of non-EU immigrants to UK by nationality, YE June 2023
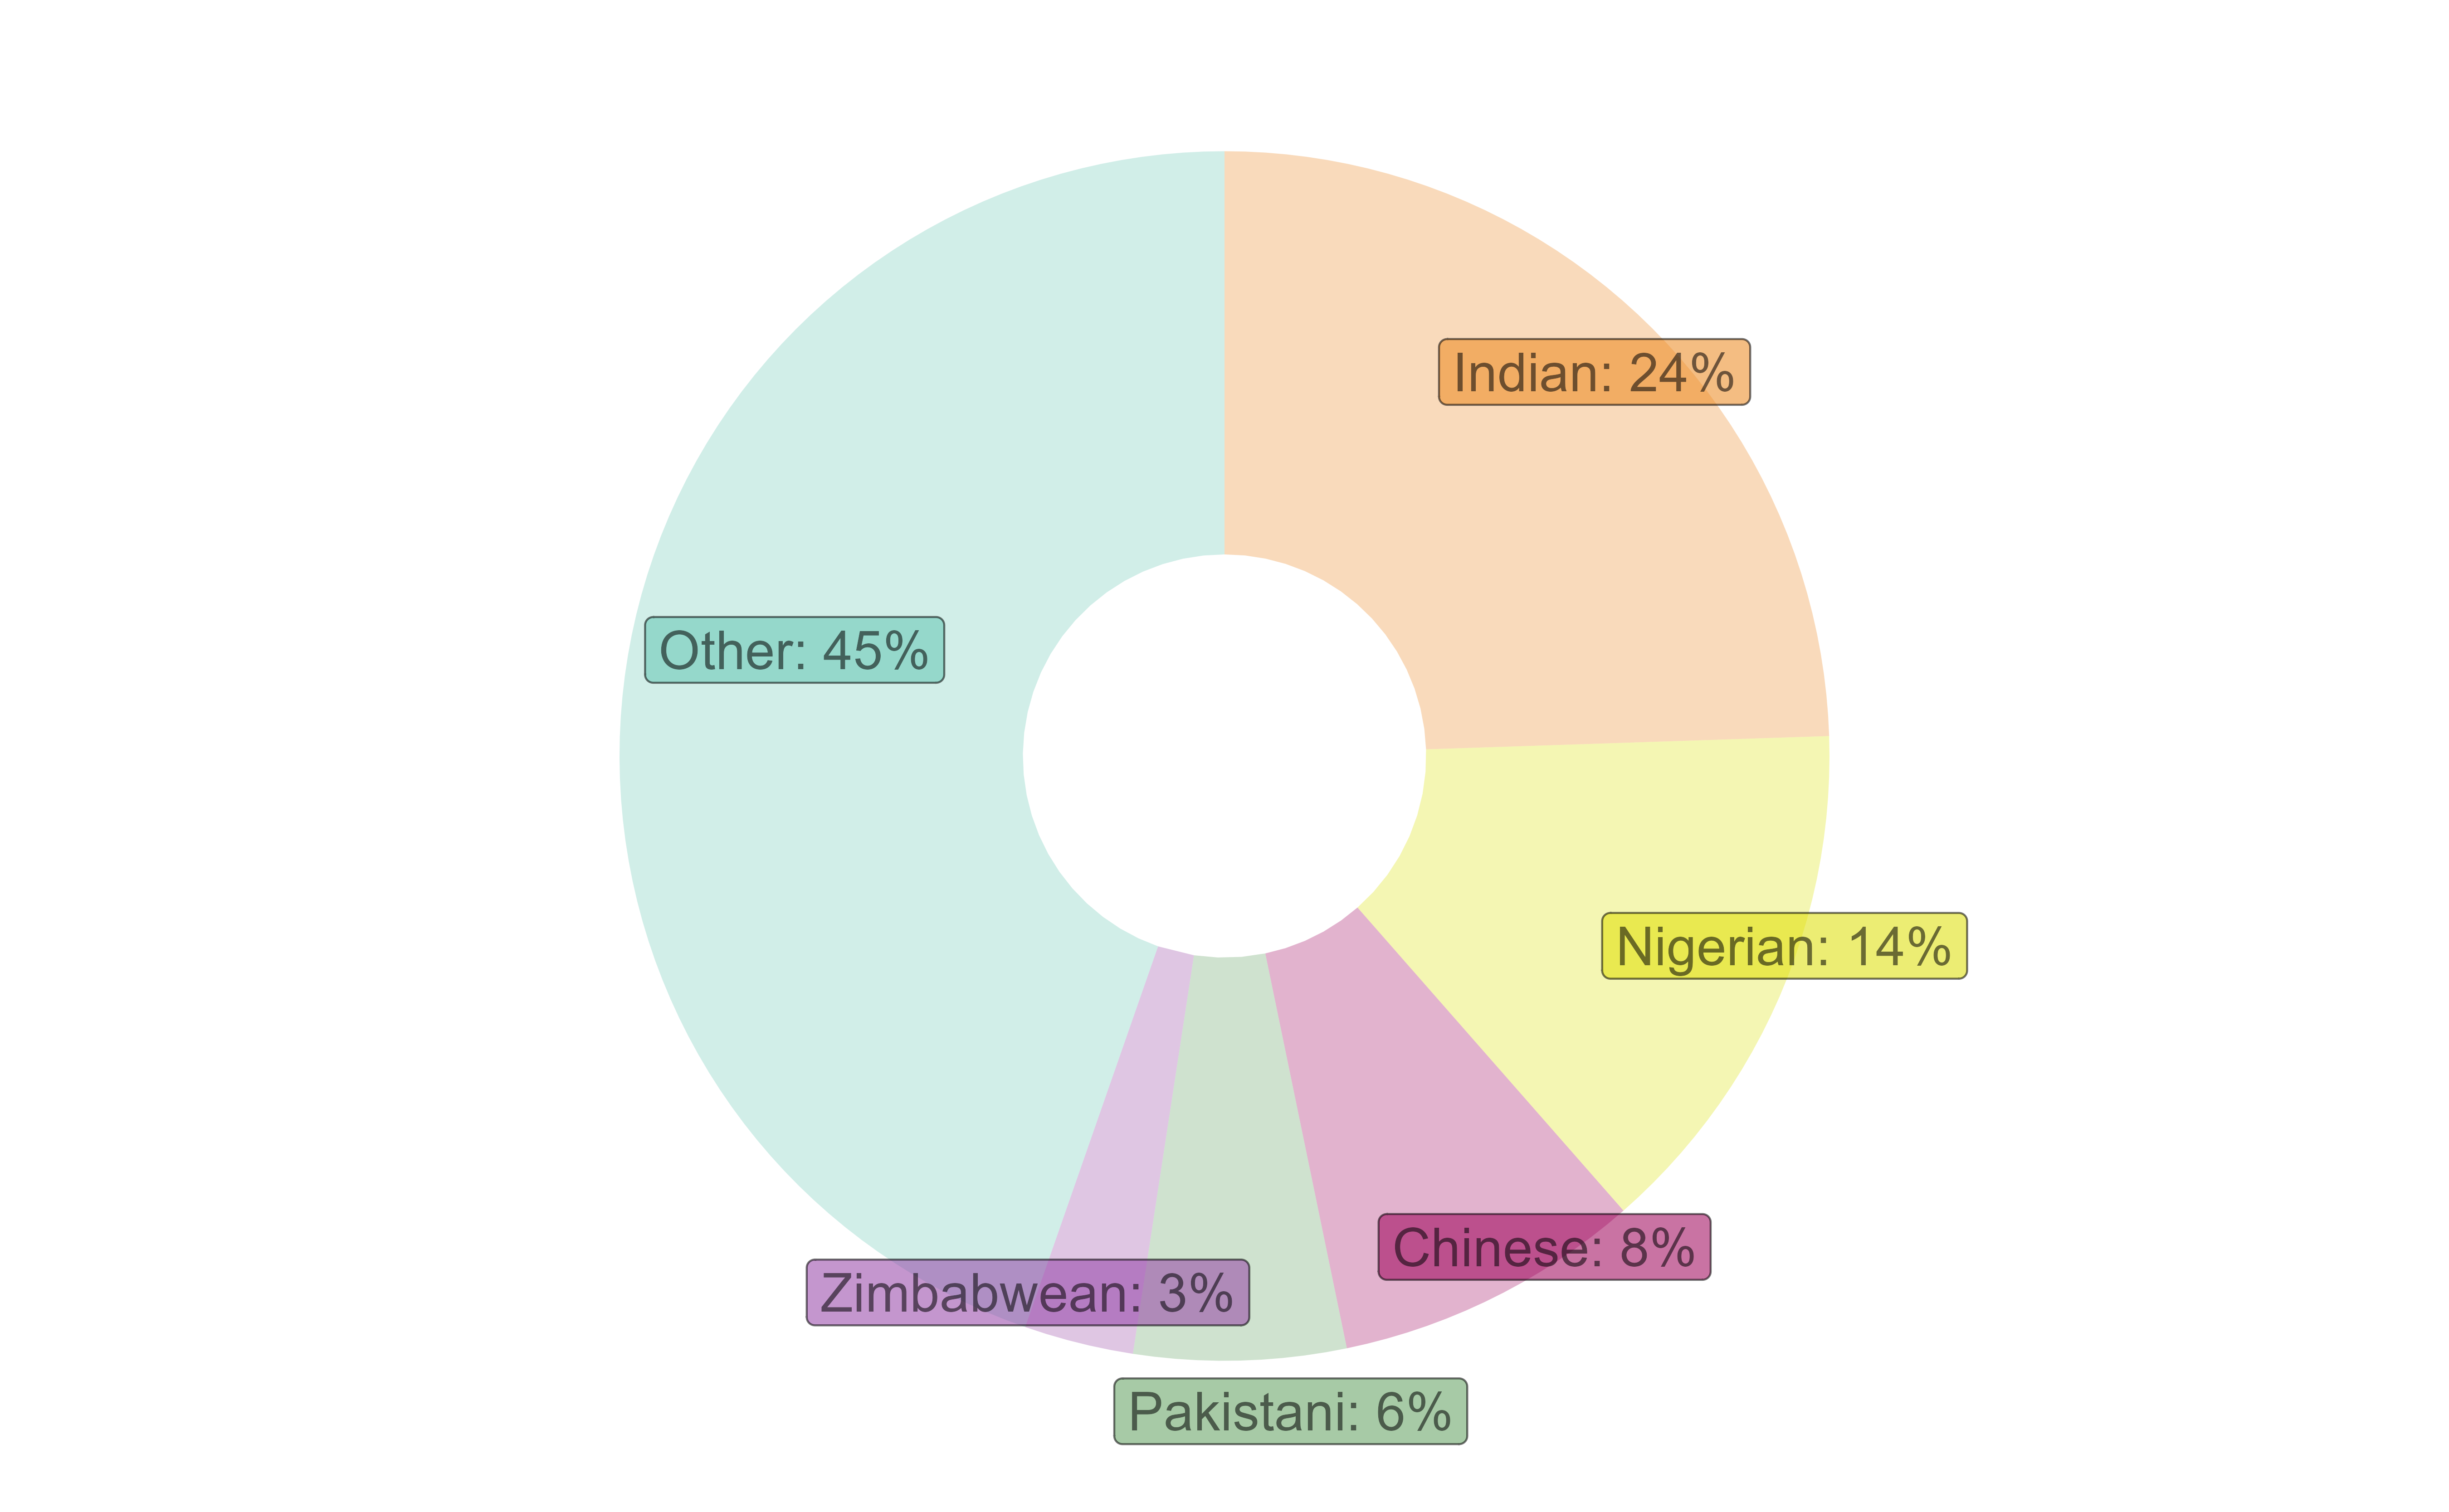
Source: ONS; Chart: GLA Demography
Figure 6 shows the variation in visa types by nationality of immigrants. Each bar shows the proportion of visas of different types granted to immigrants from that country. It illustrates the dominance of study-related visas for Chinese and Nigerian immigrants, while Zimbabweans were almost exclusively granted work-related visas.
Figure 6: Visa types by nationality, non-EU immigrants to UK, YE June 2023
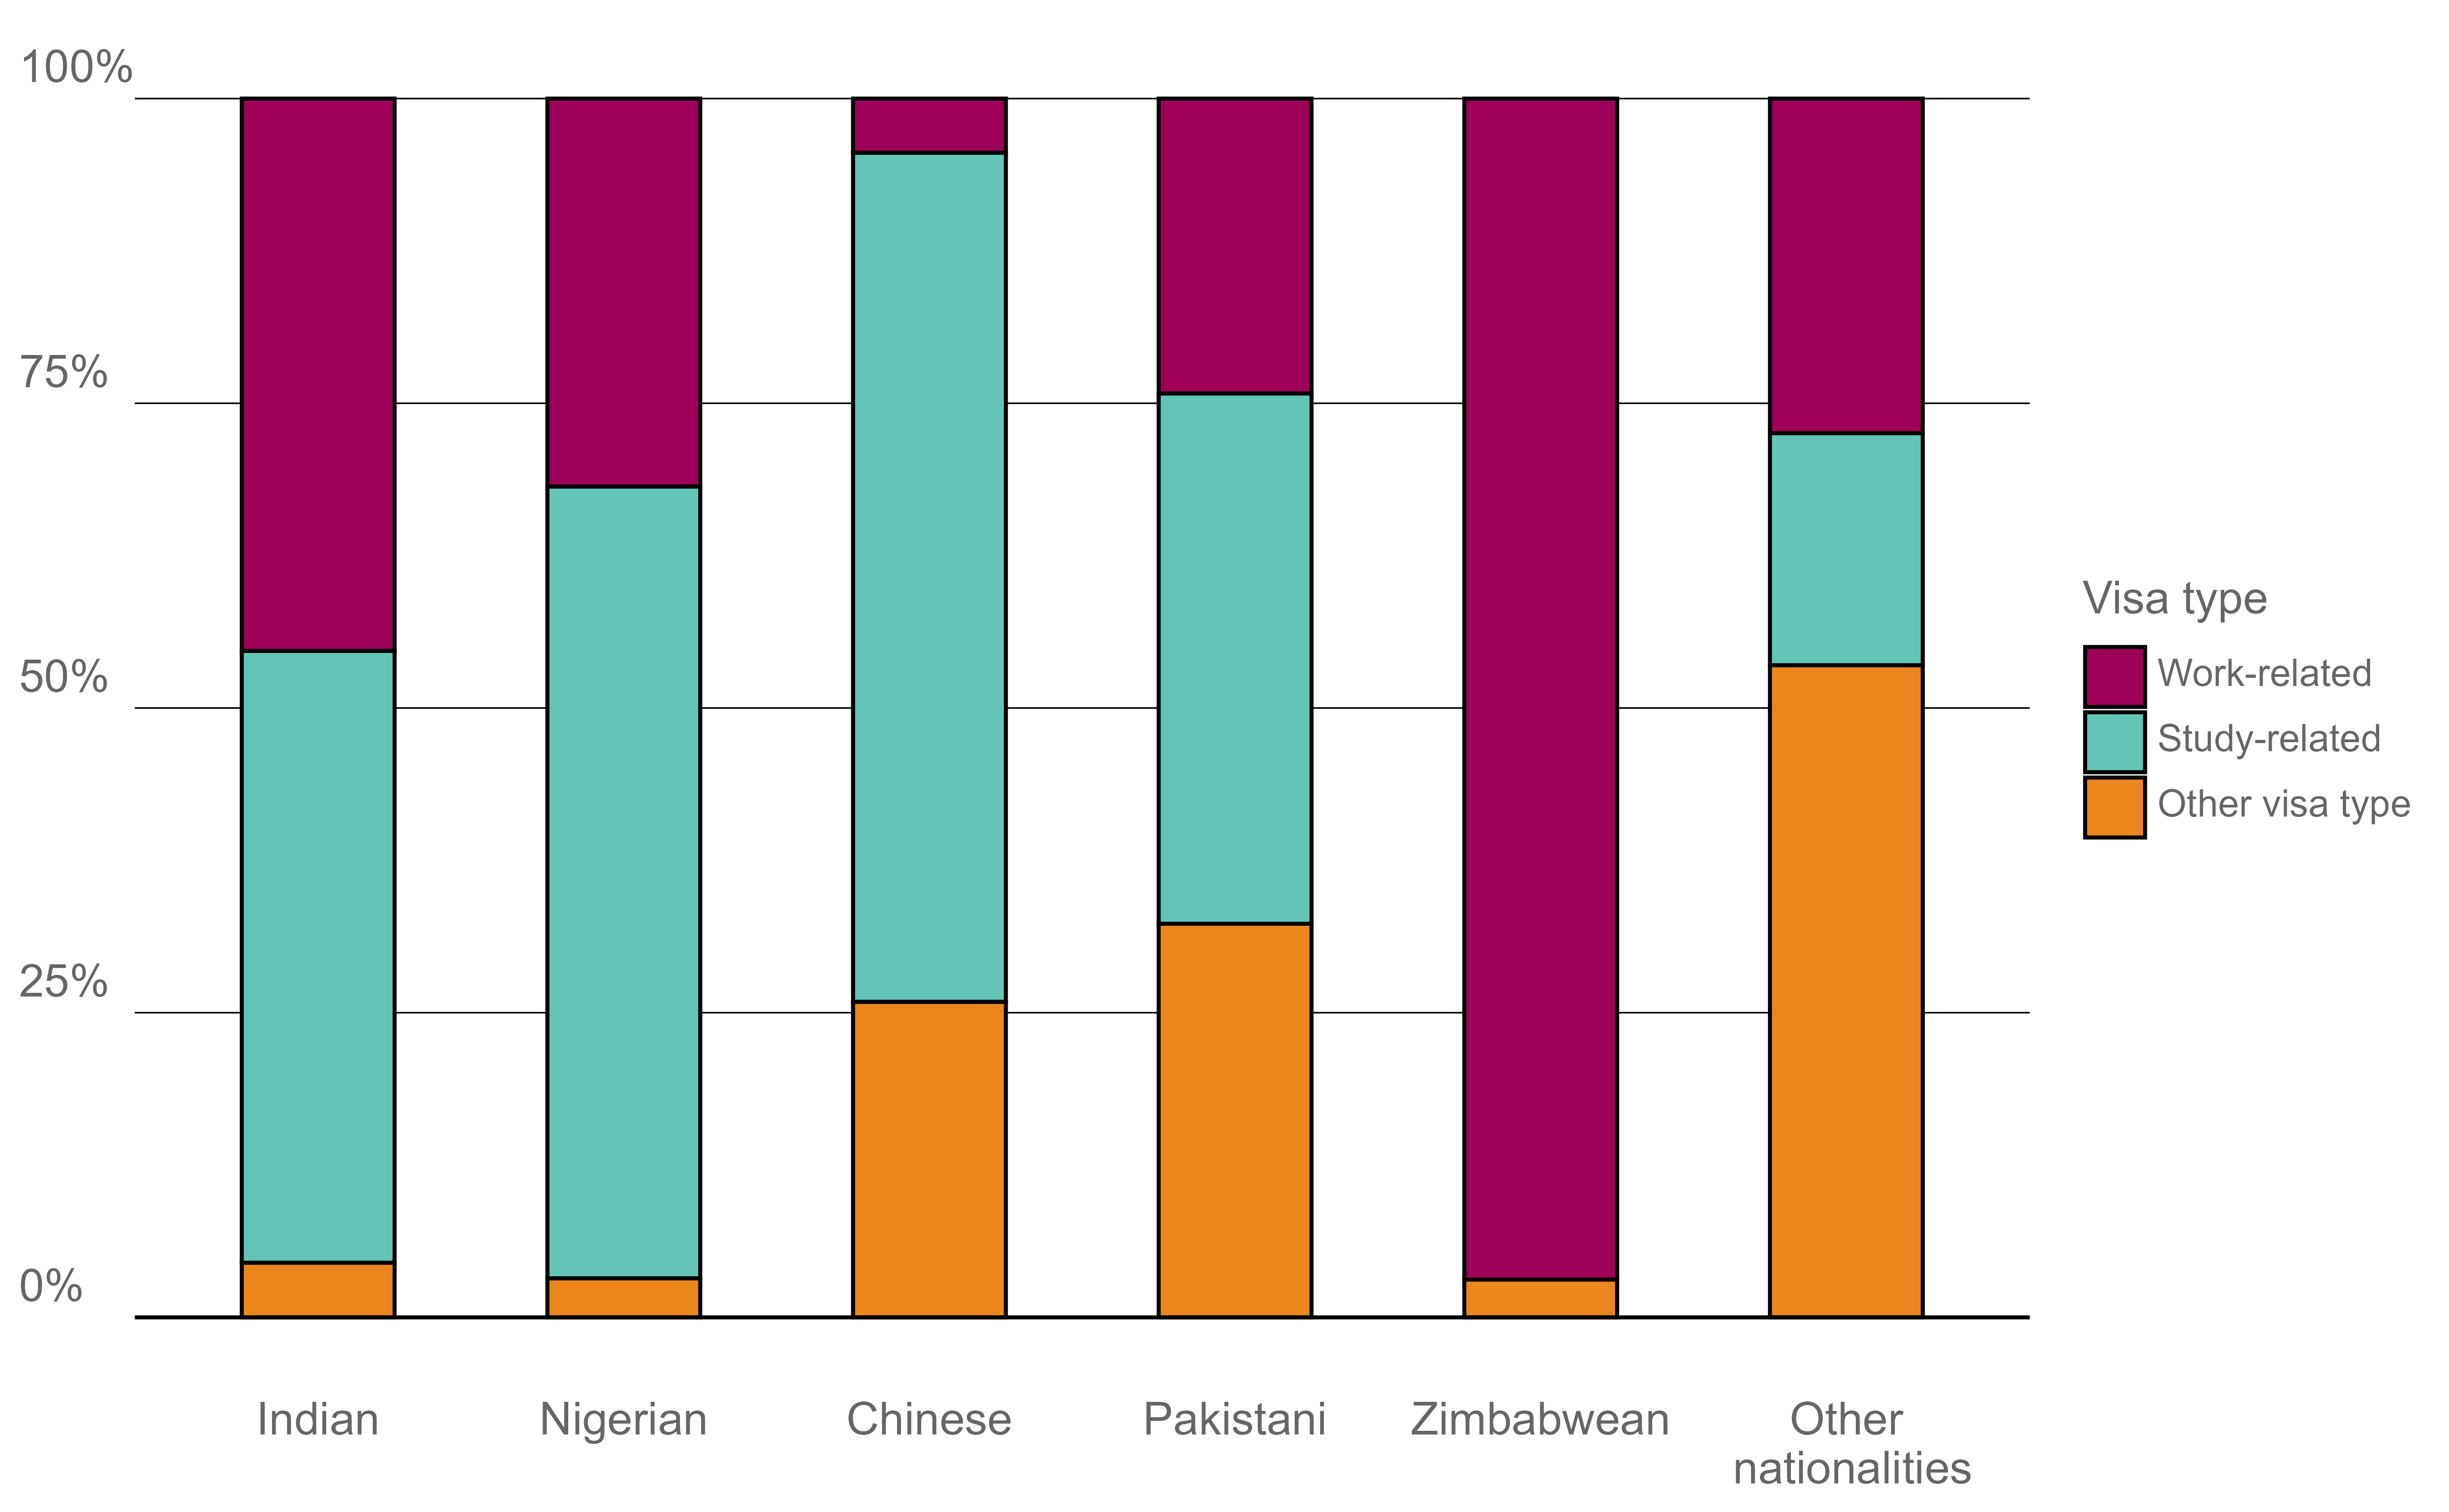
Source: ONS; Chart: GLA Demography
How have London migration trends changed?
The components of change that accompany the annual Mid-Year population Estimates (MYE) for England and Wales provide a regional breakdown of migration estimates. The 2023 MYE (ONS, 15/07/24) gave the total net international migration to England and Wales for YE June 2023 as 622,000 (compared with the provisional estimate of 672,000 for the UK as a whole). ONS are expected to significantly revise the mid-year estimates in summer 2025 to bring them in line with the updated UK estimate of 906,000. At this time, it is unclear to what extent these revisions might affect the relative distribution of migration between regions and local authorities.
Around one-third of the UK’s foreign-born population live in London. International migration trends for London historically have tended to track with those for the whole country and we will now examine if that is still true for the recent increases. The June 2023 mid-year estimate for London’s net international migration did indeed show a considerable increase. Net migration was assessed at 154,000 – nearly double the 2021 value (78,000), and much greater than the previous peak value, in 2015, of 112,000.
Figure 7 charts these values for London as well as those for the rest of England since 2001. It illustrates how London has consistently accounted for a high proportion of total net migration over the past 20 years, at times around 50% (2009 and 2012). It also shows how the recent increase did affect London, but involved the rest of the country to a much greater extent. For YE June 2017, London accounted for 45% of total UK net migration while for the YE June 2022 and 2023, London only accounted for around one-quarter of the total.
Figure 7: International net migration for London and rest of England, 2001 – 2023
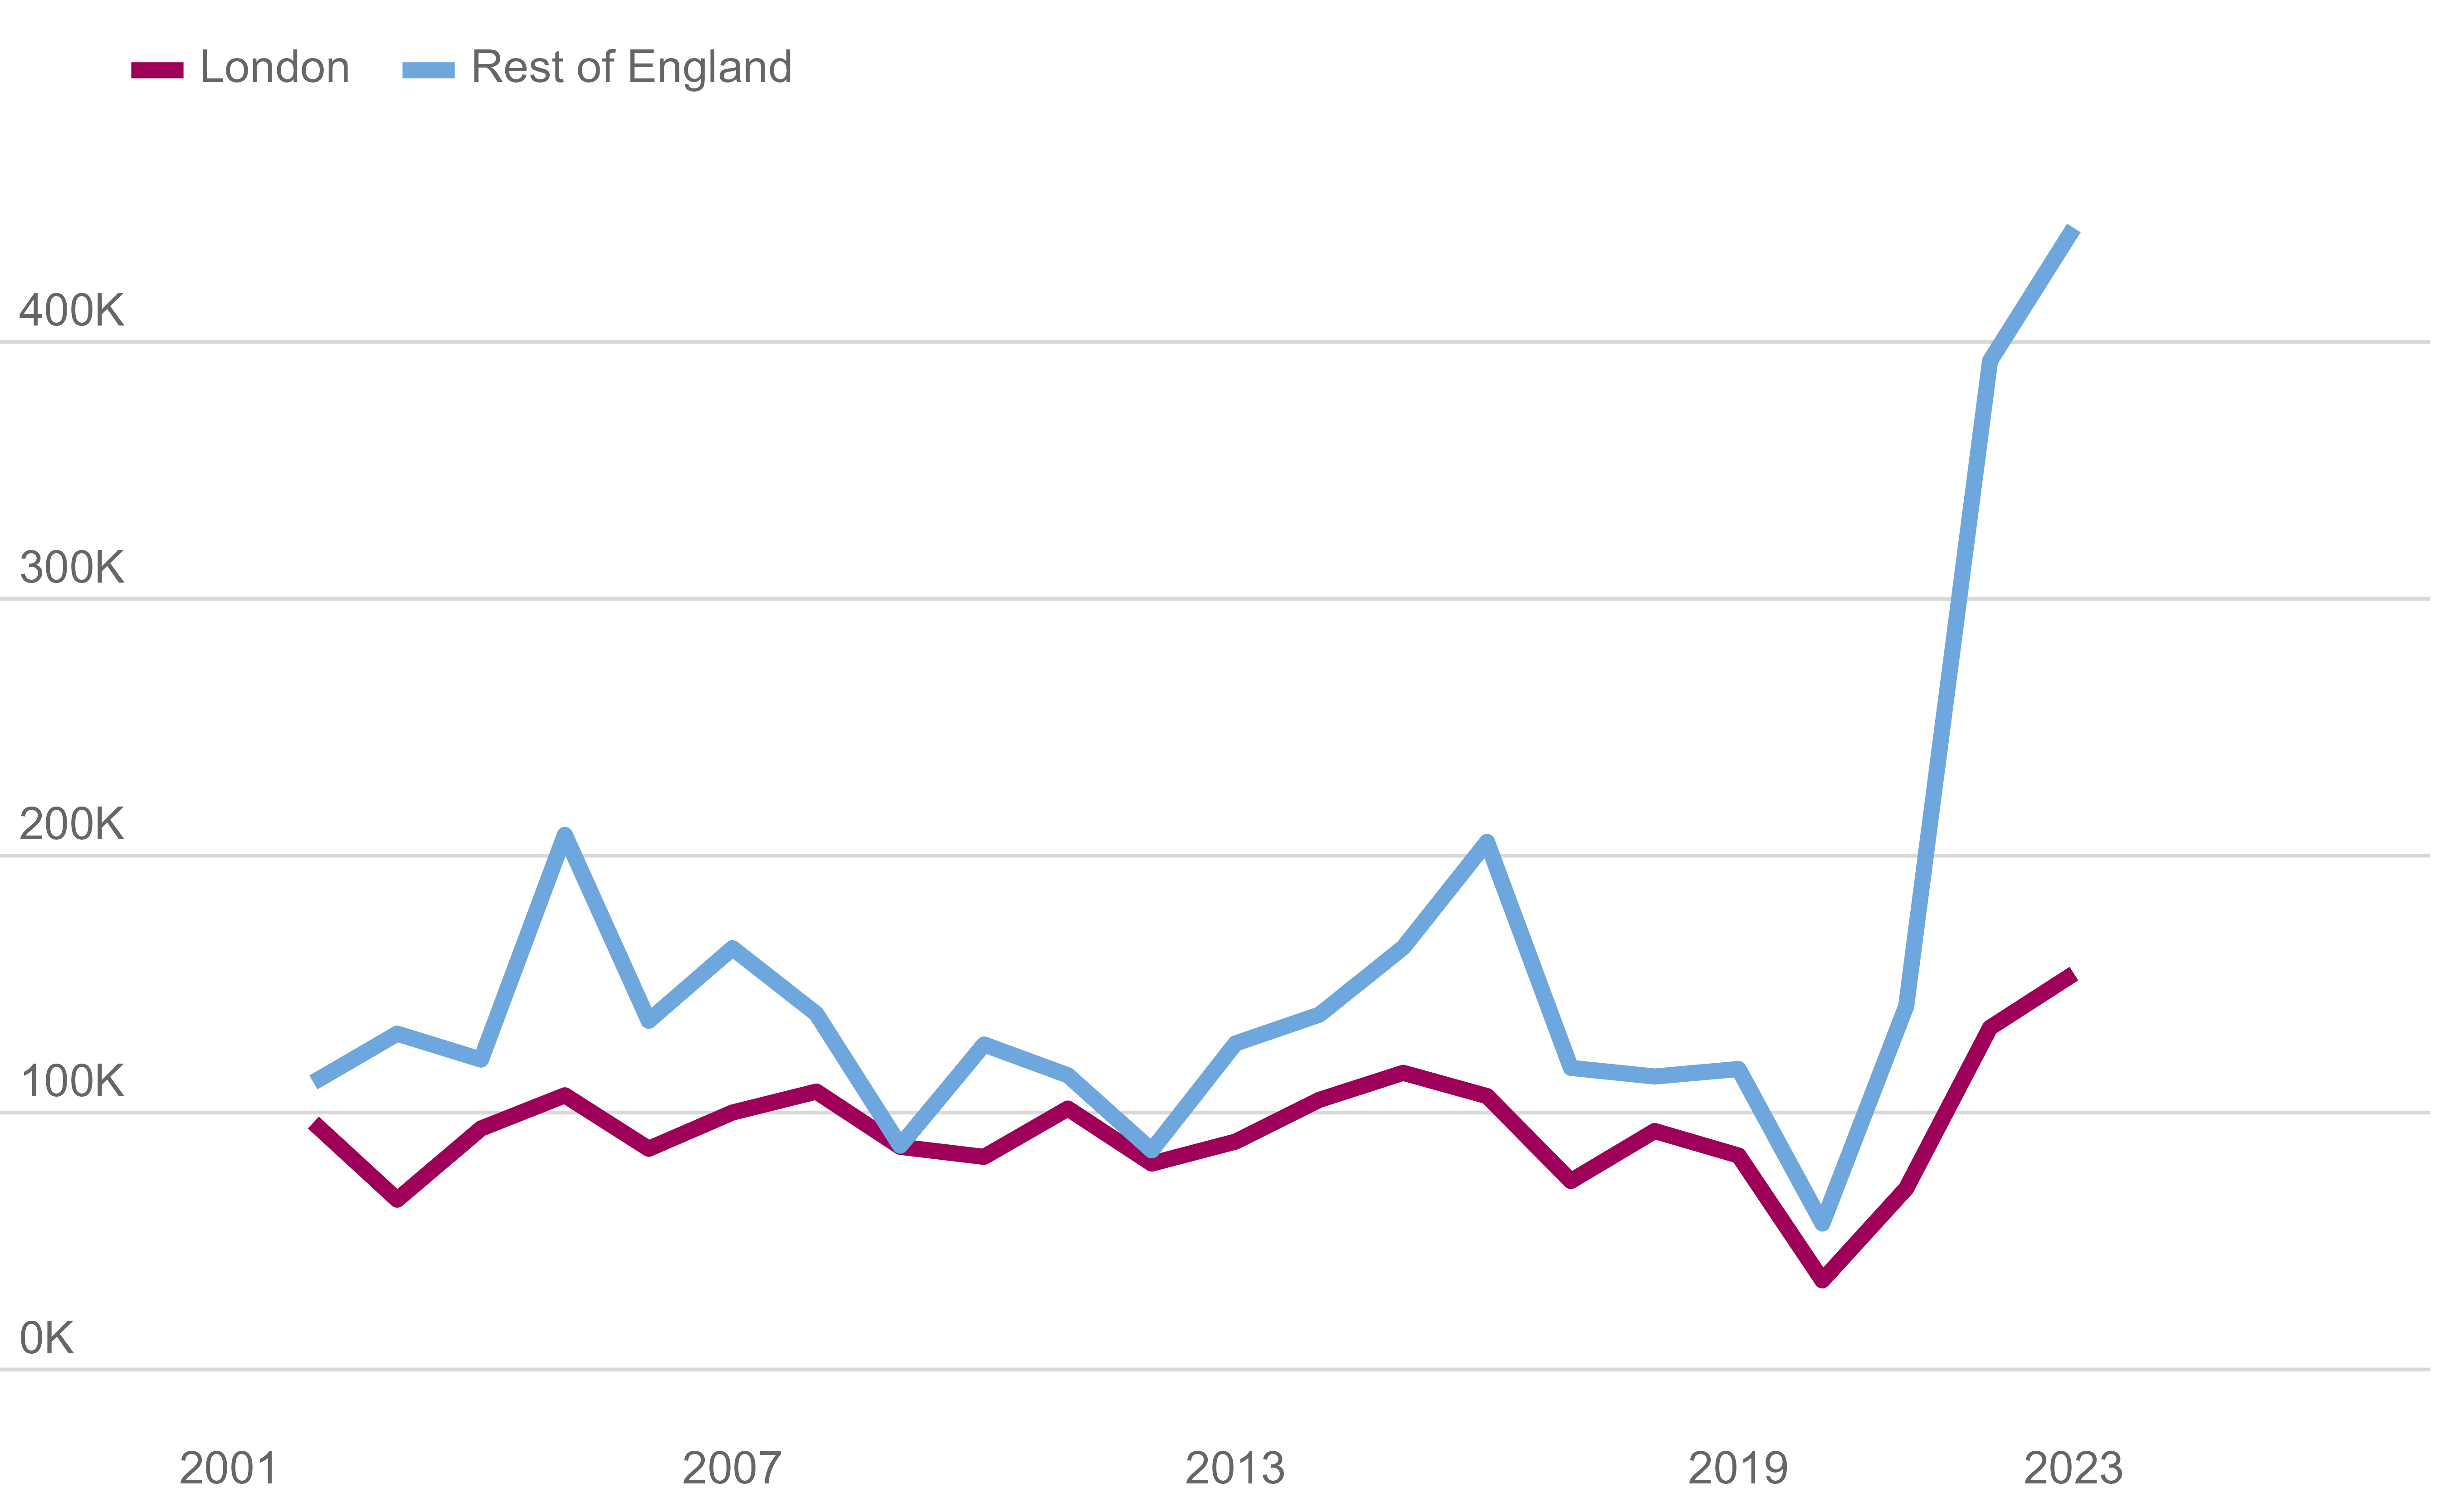
Source: ONS; Chart: GLA Demography
When the net migration values for each region are indexed to their value in 2012, as shown in Figure 8, it becomes clear which regions’ net flows have changed most. The figure shows the growth of net migration was least in London compared to all the other English regions. London’s value in YE June 2023 was just double its value for YE June 2012, while for the North East and North West regions, their 2023 values were around 15 times and eight times as great as their respective 2012 values.
Figure 8: International net migration by English region, change since 2012, 2012 – 2023
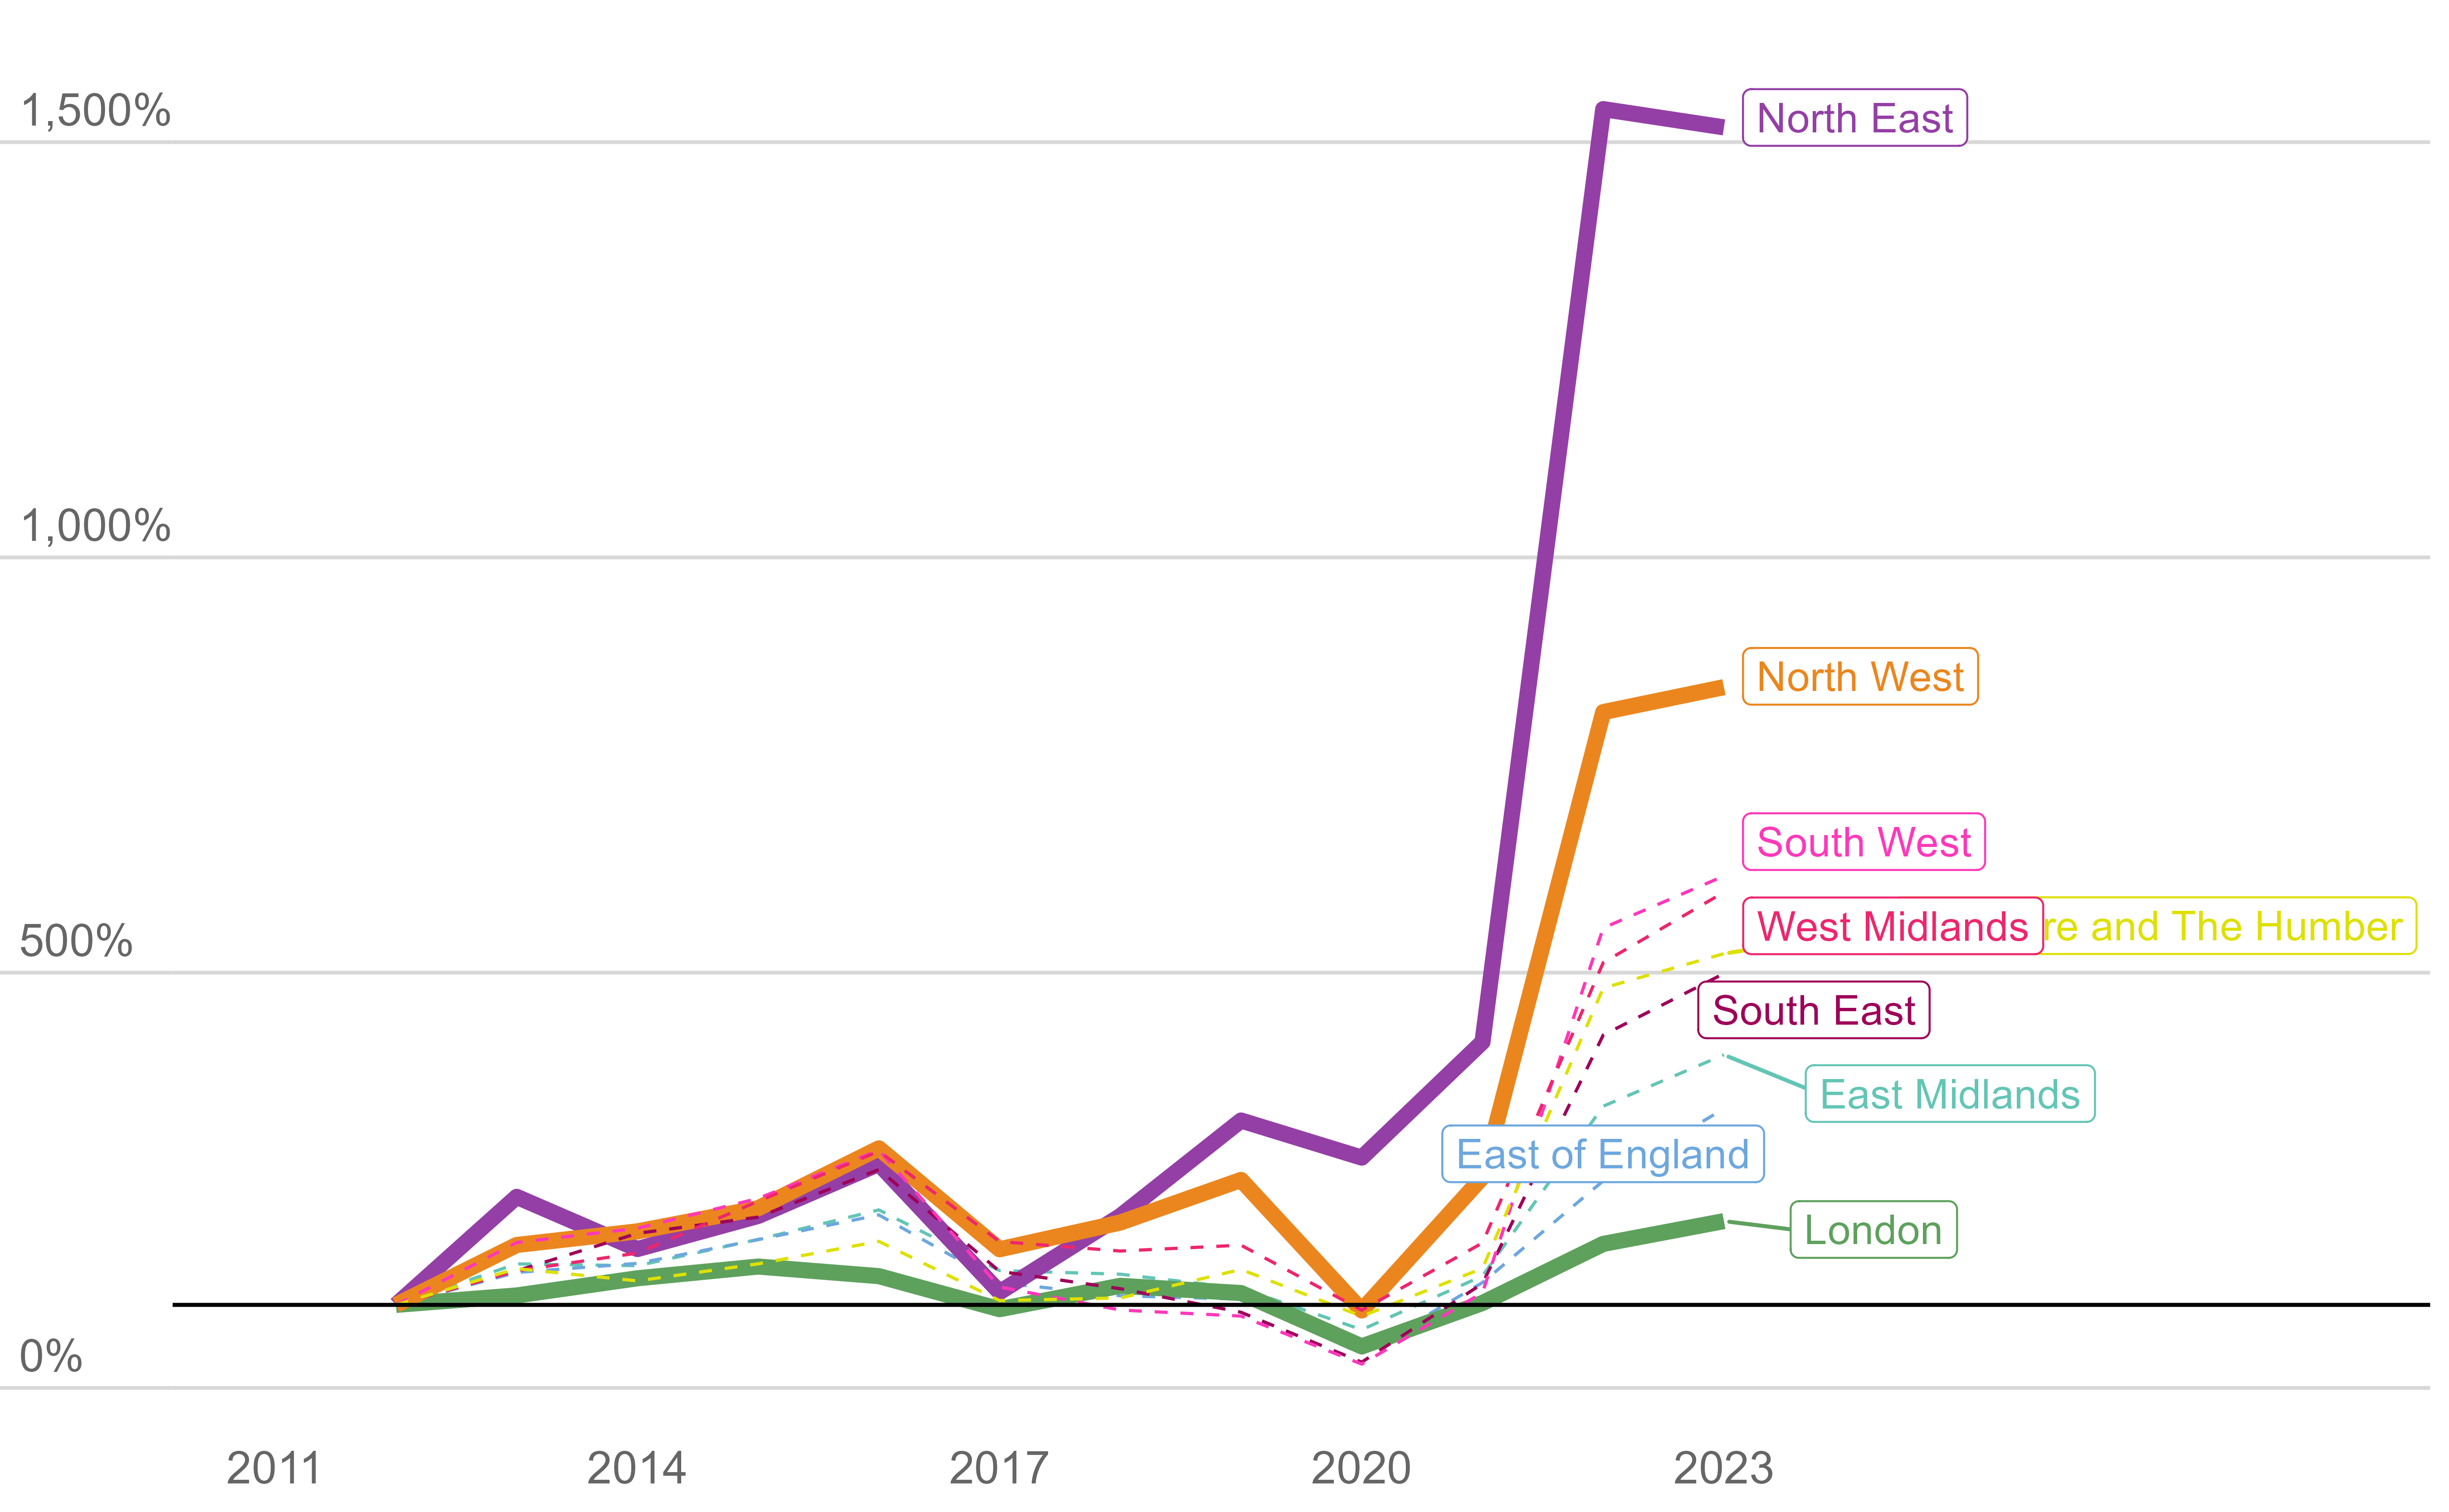
Source: ONS; Chart: GLA Demography
In addition to the absolute and indexed values of regional net migration, it is also important to consider the scale of migration relative to the size of the non-UK born population. The non-UK born population of the North East region for example is increasing from a low base, so a net flow of around 29,000 to the region is around 16% the size of this population. In contrast, London’s net flow of around 154,000 is equivalent only to around 4% the size of its non-UK born population. These differences have implications for local service provision and for migrants’ experience of settling in these diverse regions.
What does this all mean for London and other regions?
We will close by discussing the implications of the data presented above, and the prospects for migration values. Clearly forecasting population trends must be underpinned by an understanding of the drivers behind the changing statistics, and the reasons behind the trends described above are not fully understood. There remains a great deal of uncertainty about future migration trends, even in the near-term.
UK net international migration
ONS analysis of visa data indicates the fall in UK net migration between YE June 23 and YE June 24 is due to declining numbers of dependants arriving on study visas, and to decreases in the number of people arriving for work-related reasons (ONS, 28/11/24). These reductions were likely consequent to the strengthening of visa regulations, for example newly arriving care workers and students coming to do taught postgraduate courses are no longer allowed to bring immediate family, the Skilled Worker minimum salary increased, and new students have been prevented from switching into a work visa before the end of their course.
We saw above (Figures 2 and 3) that non-EU migrants have overtaken those from the EU, and that the most frequent visa type for arrivals from the most numerically important non-EU countries are student visas followed by work-related visas (Figure 6). So the policy changes may well lead to continued decreases in immigration. Figures 2 and 3 above both show the most recent trend is for emigration to gradually increase. The most likely short-term outcome is therefore for net migration to continue to decrease from its current high levels.
Evolution of London’s migration and population
London differs in several ways from the rest of the UK, and so one would not necessarily expect London’s migration trends to track those for the whole UK. London’s characteristics that might be attractive to international migrants are its great diversity of population[6], high earning potential[7] and job opportunities[8]. Characteristics that might deter migrants are London’s high cost of living especially of housing[9] and high poverty rate[10].
The relative influence of these factors is difficult to gauge. For example, the pull of job opportunities may not be reflected in numbers moving to London itself, given the shift to increased levels of remote working in the last few years. A higher proportion of migrants might now choose to live outside of London compared to before the COVID-19 pandemic.
One can speculate cities such as Liverpool, Manchester and Newcastle might be more attractive to migrants than London by being more affordable while still offering good job opportunities. And we have evidence from analysis of households with dependent children of the influence of London’s high cost of living on population distribution within and away from London (GLA, 06/2024).
However at least with respect to decisions made by international students, there is evidence that London’s appeal endures. Our analysis of data from the Higher Education Statistics Agency (HESA 08/08/2024) shows that London’s share of the sharply increasing numbers of international students in the UK since 2020 has increased.
The unequal distribution of dispersal accommodation (housing provided to Asylum Seekers whose claim for Asylum Support has been agreed) away from London, the other two Southern regions and the East of England (ONS, 16/12/24)[11] does indeed reflect cost of accommodation. But it is government policy, not migrants’ choices, that accounts for the distribution[12], and the numbers involved are small in relation to overall migration flows.
Finally, we can note that should other regions continue to take a larger share of net international migration compared to pre-Brexit and the COVID-19 pandemic, we might expect to see a gradual decline in the current concentration of foreign-born UK residents in London.
In summary
Although London’s share of overall international migration has fallen, absolute levels have not. London remains an attractive destination for international students and workers. Despite recent volatility, migration flows to the city have proven to be resilient to date. We will check if this remains the case when the next ONS estimates are released – of UK long term international migration (expected in May), and the next regional breakdown of migration estimates (also expected mid-year).
The GLA publish a range of annually updated population projections, based on ONS population estimates. These projections are used by planners working in the housing, education and health sectors for example. Projections of London’s population are extremely sensitive to migration assumptions (GLA, 13/08/24) and the greater recent volatility in migration statistics adds to uncertainty in our projections. Planners in London have become used to dealing with high levels of uncertainty about future population change, and now other parts of the country may need to do the same.
[1] Net migration in the UK is defined as the number of people who immigrate to the UK long term (for at least 12 months), minus the number who emigrate long term.
[2] Before the COVID-19 pandemic the methods were survey-based while now they are based on more diverse sources including new sources of administrative data, and better use of existing administrative data sources. The term “administrative data” refers to information routinely gathered when registering people, carrying out transactions or for record keeping. For example, ONS use sources including Borders and Immigration data supplied by the Home Office, and Registration and Population Interaction Database data supplied by the Department for Work and Pensions, to estimate long-term international migration flows.
[3] The new immigration system meant loss of freedom of movement for EU nationals, and relaxation of rules for non-EU citizens, with recent amendments to the system being announced in December 2023 (House of Commons Library, 12/12/24).
[4] Migration of British nationals is not considered here as there has been relatively little change in flows over the past decade. For YE June 2024, they accounted for about 5% of total immigration (58,000) while non-EU nationals accounted for about 86% (1,034,000), and EU nationals for 10% (116,000).
[5] In this section, we use the statistics for YE June 2023, not the most recent statistics from YE June 2024 for two reasons – first because the more recent statistics remain provisional and so may be revised, and second because data are available disaggregated by region for YE June 2023.
[6] At the time of the 2021 Census, 63% of London residents identified as non-White British, while the proportion for the whole of England and Wales was 26% (ONS 22/12/22). Also 41% of London residents had been born abroad, compared to 17% for England and Wales (ONS 2/11/24).
[7] Median weekly pay in April 2024 for full-time employees was highest for those living in London and lowest for those in the North East (ONS 29/10/24).
[8] At the start of 2023 London was the UK region with highest number of businesses per resident (1,477 per 10,000 residents (ONS 5/10/23).
[9] London is the least affordable UK region for private rented accommodation (ONS 28/10/24).
[10] Together with Yorkshire and the Humber, London is the UK region with highest percentage of people (all ages) in persistent low income after accounting for housing costs (House of Commons Library 8/4/24).
[11] Nonetheless, at 0.5% of the total population (the average for England is 0.4%) London is still the region with the highest proportion of the population in the following categories combined
– arrivals through the Homes for Ukraine visa route;
– those settled and in bridging accommodation arriving through the Afghan citizens resettlement scheme (ACRS) and Afghan Relocations and Assistance Policy (ARAP), and
– those being supported following claims for asylum.
[12] Dispersal policy introduced in 1999 was intended to distribute supported asylum seekers around the UK, generally away from London and the south east and towards areas where there was greater availability of suitable and cheaper accommodation (House of Commons Library 5/4/24).