
Improving the availability of fertility rate data
Summary
Earlier this month, the London Assembly’s Economy, Culture and Skills Committee met to discuss the falling birth rates in London. The open investigation comes after the publication of several newspaper articles and research papers in the past few months highlighting the effects of falling birth rates in London and its effects on the number of school places. Low fertility rates and cost of living pressures have led to a sharper decrease in the number of pupils in Inner London’s primary schools.
Because school funding is partly determined by the number of pupils, some schools in London have had to merge or close due to falling pupil numbers. This trend is expected to continue in London, with similar patterns likely to emerge across the rest of England. London Councils’ forecast predicts a 3.6 per cent drop in demand for Reception places and 2.9 per cent in Year 7 places by 2028-29. Pupil projections published by the GLA show that these trends are not unique to London: the number of pupils entering Reception is projected to decrease across all 33 subregions1 in England.
Fertility rates data can help us understand recent births trends, but there are many challenges related to the data currently available:
- Data on births by age of mother are published by the Office of National Statistics (ONS) on an ad hoc basis, making it difficult for users to find it
- The ONS does not publish all types of fertility rates at the local authority level, users may need to calculate age-specific fertility rates themselves
- The data needs to be transformed and prepared. For example, users will need to conciliate conflicting age categories (single year of age in population estimates and category variables such as “under 20”, “40 and over” in births data) and deal with combined local authorities
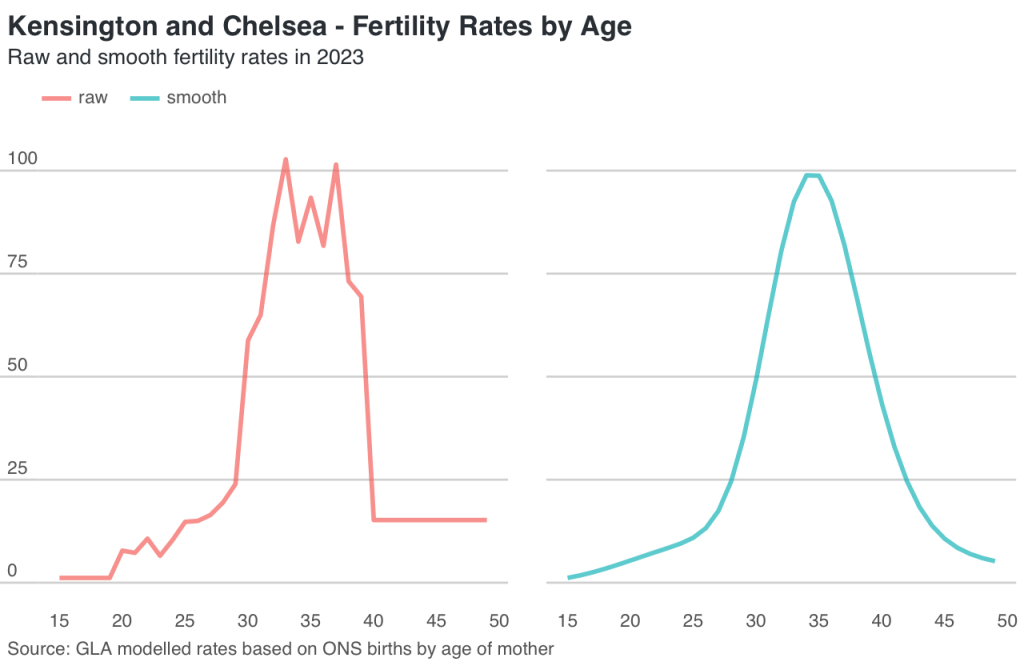
- Raw fertility rates are “noisy” and hard to interpret. Curve smoothing techniques need to applied to reduce noise and extract insights, which is time-consuming and requires expertise. The graph below demonstrates the difference between raw and smoothed age-specific fertility rates:
To facilitate the current discussion, the GLA Demography Team has published a series of detailed fertility rate data and made the code used to produce the rates publicly available on GitHub. The project provides a comprehensive time series of fertility rates for every local authority in England and Wales, currently covering the period from 1993 to 2023.
There are several ways to describe fertility rates, but the two most common are age-specific fertility rates and total fertility rates.
Age-specific fertility rates (ASFR) measure the number of births per 1,000 women within specific age groups. For example, in England, the peak childbearing age is currently 32, with ASFR of 0.107, meaning 107 babies are born for each 1,000 women aged 32.
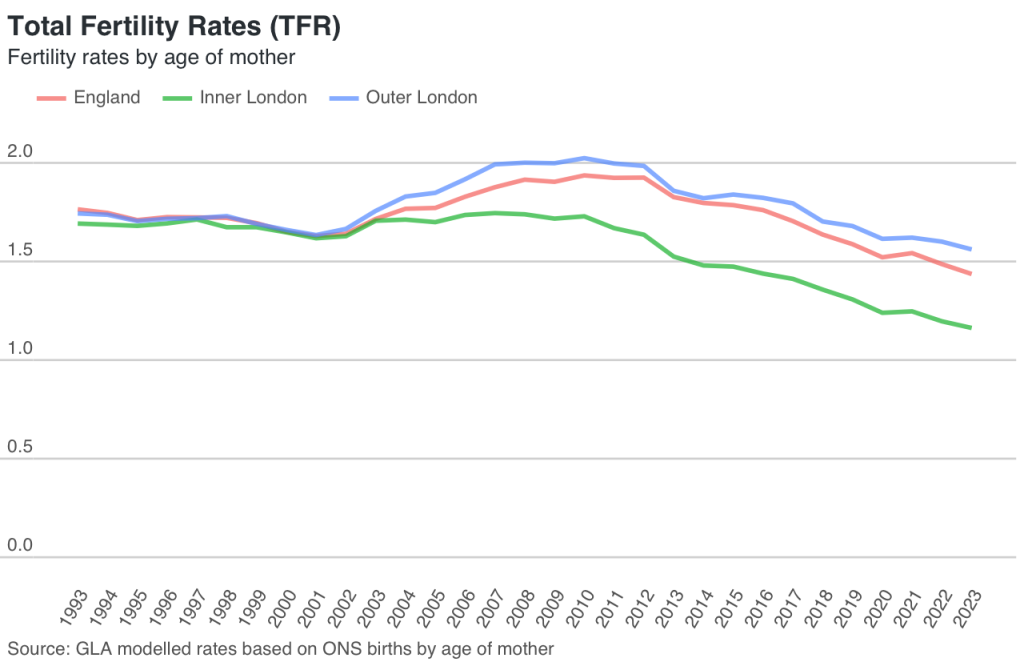
Total fertility rate (TFR) is common used measure of overall fertility calculated as the sum of all age-specific fertility rates across all reproductive age groups. It represents the average number of children that a woman would have if she were to experience current age-specific fertility rates over the course of her life. For 2023, we estimate the TFR in Inner London to have been 1.16 compared to 1.54 in Outer London, and 1.41 for England as whole.
All the data and functionality needed to produce a final report are included in the project. Reports are customisable and can be tailored to the needs of users. This includes the ability to create clear visualisations, making it easier for non-technical audiences to explore and communicate trends at the local level.
Local authorities may use this resource to understand how fertility rates have changed in their local and neighbouring areas and to inform planning and provision of local services.
In addition, students, researchers and academics can also use the project to explore the data for their own studies, suggest improvements, provide feedback and help to extend this resource for wider applications.
The data
The project combines publicly available ONS data on births by age of mother and population estimates for each local authority in England and Wales from 1993 to 2023.
For each local authority and higher-level geographies in England and Wales, we calculate age-specific fertility rates for each year by dividing the number of births at a given age by the population of women the same age. After that, we create a set of modelled age-specific fertility rates that include estimated fertility for individual ages from 15 to 49. These age-specific rates are then used to calculate total fertility rates.
Clean and well-formatted raw data is available for users to analyse trends in annual births and demographic changes across selected geographies.
Modelled fertility rates:
Key trends
- Fertility rates temporarily rose between 2002 – 2012, partly driven by migration
- Since 2012, fertility rates have declined, with a sharper fall in Inner London, while Outer London has followed a similar downward trend to England as a whole
- The current decline results from a combination of natural demographic correction and global trends observed across developed countries
- The sharper decline in Inner London is likely driven by affordability pressures, including high housing and living costs
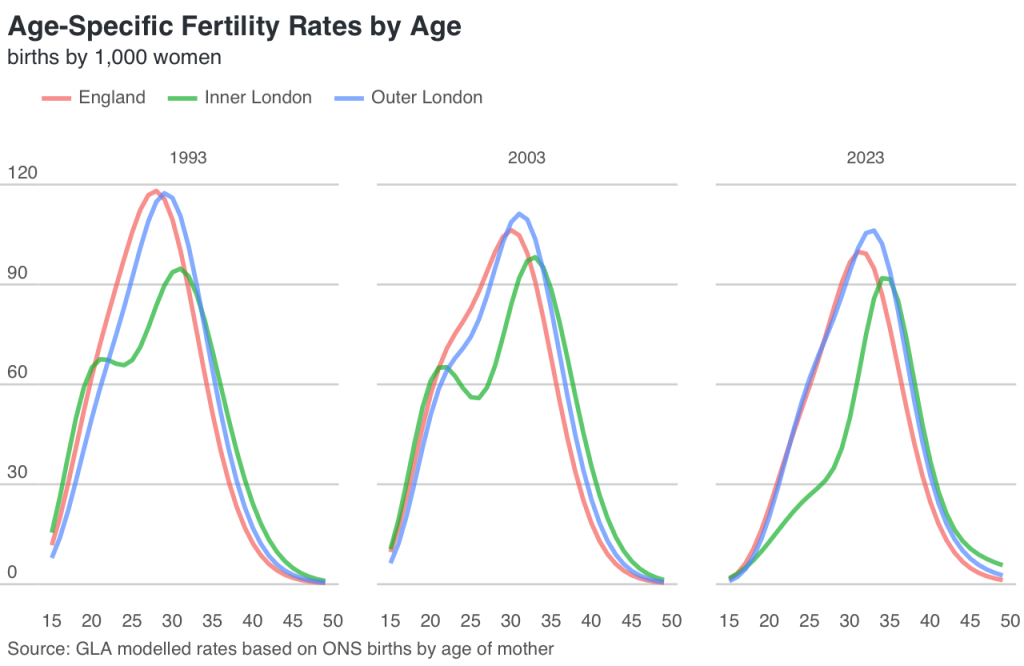
- The shifts in fertility curves indicates that women have been having children later in life, with rates falling at younger ages while rising at older ages
- Rates at younger ages have continued to fall and increases at older age have stalled
- Outer London and England patterns are closely matched. The fertility curve in Inner London, on the other hand, reflects the financial pressures discussed during the Assembly meeting
- In Inner London rates are significantly lower at younger ages and slightly higher at older ages. Overall fertility rates have been below national and Outer London levels since the early 2000s.
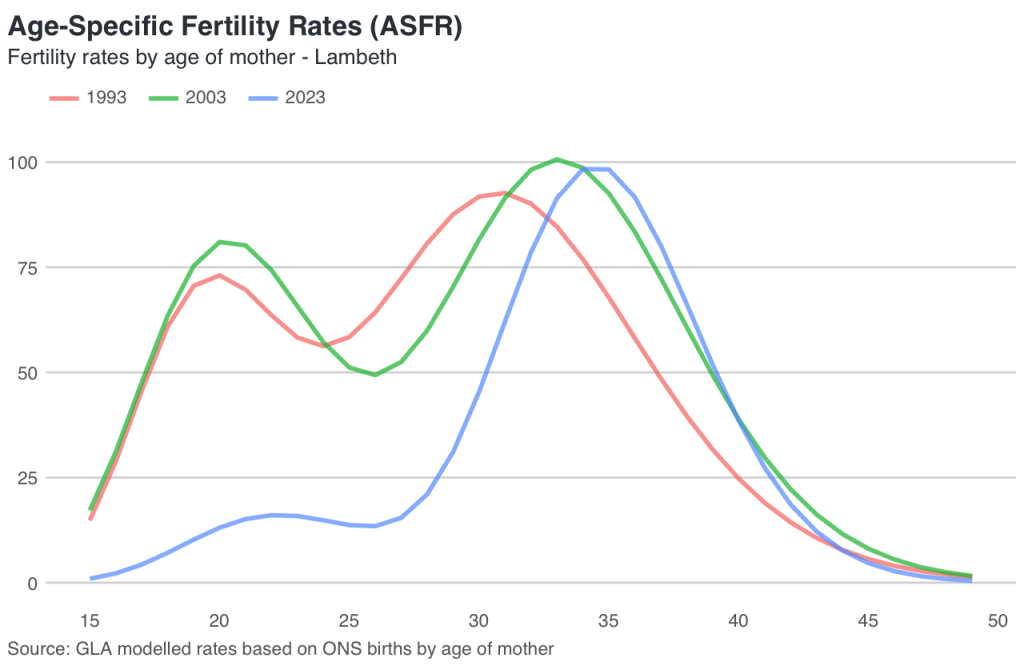
- Lambeth illustrates the demographic transformation of Inner London
- Fertility rates among younger ages have declined sharply over the past two decades
- The shift of the curve to the right indicates that births now peak at older ages, but this trend has largely plateaued for women in their late 30s between 2003 and 2023
Conclusion
Fertility rates, and consequently, births have been falling across England and Wales, as in most developed countries. Steeper declines in Inner London are likely linked to high housing costs and an increased tendency to relocate to more affordable areas before having children.
Because fertility rates vary widely across local authorities it is important that analysts have the tools to provide local decision-makers and stakeholders with the evidence necessary to make strategically informed decisions about the provision of public services in their local area. With that in mind, the GLA has taking the initiative to open-source its fertility estimation codebase, enabling the analytical and academic community to use it, build upon it, and provide feedback.
The GLA is also exploring the development of interactive visualisation tools as part of its ongoing commitment to making data accessible and useful to everyone.
- Pupil projections are produced at the International Territorial Level 2 (ITL2) ↩︎