
A snapshot of tourist accommodation in London
London is the world’s third-most visited city, attracting roughly 21 million international visits in 2024 (more than half of all international visits into the UK), generating £17 billion in spending. Given the scale of these numbers, it is important for policymakers to understand if the supply of visitor accommodation that houses tourists (hotels, bnbs, Airbnb listings etc.) adequately meets demand.
This LET supplement uses a mixture of ONS and proprietary data to look into the post-pandemic recovery of visitor accommodation supply and demand in the capital.
It is an excerpt of a forthcoming GLA Economics publication on the same topic – which will expand on this analysis, explore geographical breakdowns, and provide long-term forecasts on aggregate supply and demand under various macroeconomic scenarios.
Key points:
- Demand for visitor accommodation, expressed through the total number of nights spent in the capital, has recovered to (and now exceeded) pre-pandemic levels. Recovery has been driven entirely by growth in domestic demand.
- Visitors have shifted slightly towards short-term rentals (Airbnb and booking.com listings), and away from serviced accommodation rooms (hotels and bnbs).
- The total supply of visitor accommodation (measured as total available rooms) grew between 2019 and 2024, driven largely by growth in serviced accommodation rooms.
- The latest data on the supply of short-term rental rooms points to their steadily-falling supply, likely a result of regulatory tightening in London.
Overall demand
Looking at the number of nights visitors spent in the capital indicates that demand for visitor accommodation has recovered beyond pre-pandemic levels, with recovery solely down to increased domestic demand.
The total number of visitor nights in London has grown (Figure A1) from roughly 146 million in 2019 to 154 million in 2024 (+5.1%). The number of international visitor nights has fallen from 118 million to 117 million (-1.5%), while domestic visitor nights has risen sharply from 28 million to 37 million (+33.2%). This uneven recovery translates to a compositional shift – from an international and domestic split of 64% and 36% in 2019, to 58% and 42% in 2024.
Figure A1: UK visitor nights (millions), by domestic or international
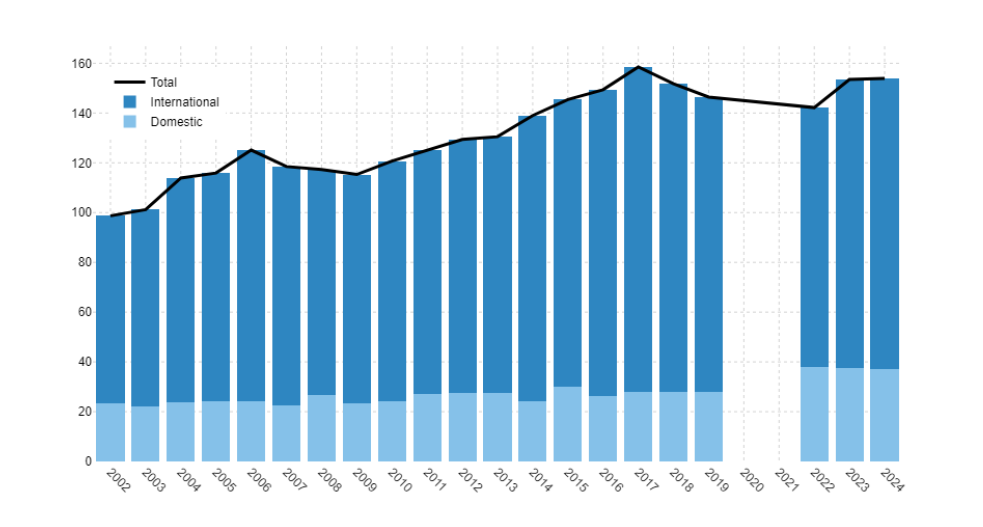
Source: ONS IPS and GB Tourism survey
Within the international share, the country of origin of tourists has also changed significantly. London’s international visitors are increasingly coming from fewer countries, with the top ten countries responsible for bigger shares of all of London’s visits (from 52% in 2019 to 59% as of 2024). The USA remains the biggest source of London’s international tourists, increasing from a 12% share in 2019 to 18% in 2024. India has roughly doubled its share from 3% to 6%, while China’s share has fallen from 4% to 2%.
How has this overall recovery in demand been felt by the visitor accommodation industry that houses the capital’s visitors – and does it differ across London’s regions? Demand for visitor accommodation can be measured using occupancy rates (the proportion of rooms filled at a given time). Occupation rate data for serviced accommodation points to occupancy rates falling (Figure A2) from 83.6% in Q1 2019 to 81.4% in Q1 2025 (-2.2ppt), with Central London and North London experiencing the steepest occupancy falls, from 85.1% to 81.5% (-3.6ppt) and 82.5% to 80.2% (-2.3ppt) respectively. In the same period, occupancy rates for short-term rentals have risen from 49.7% in Q1 2019 to 52.3% in Q1 2025 (+2.6ppt), with Central London and South London experiencing sharp occupancy growth, from 51.3% to 55.5% (+4.2ppt) and 41.3% to 45.5% (+4.2ppt) respectively.
Figure A2: Serviced accommodation occupancy rates (above panel), and unserviced accommodation occupancy rates (below panel), by London sub-region
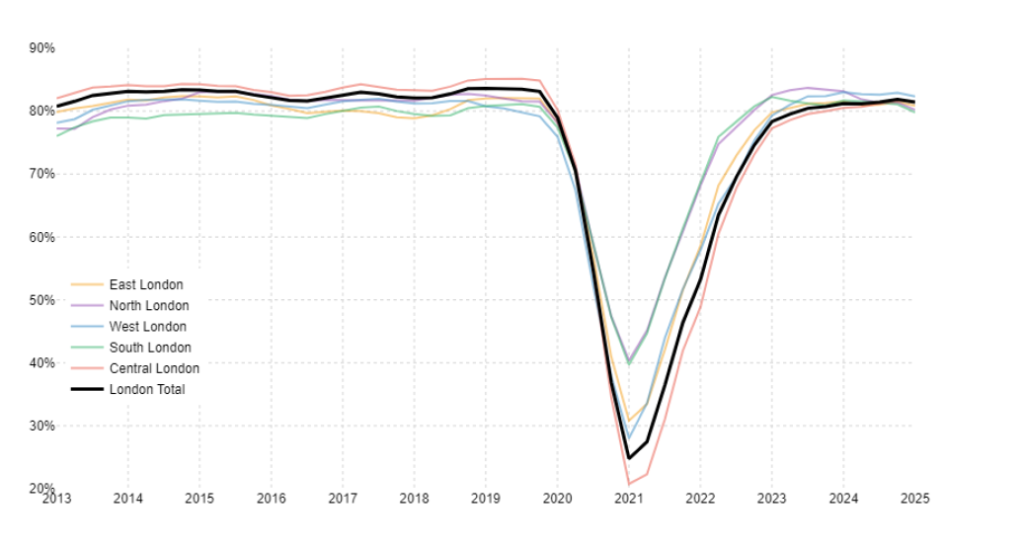
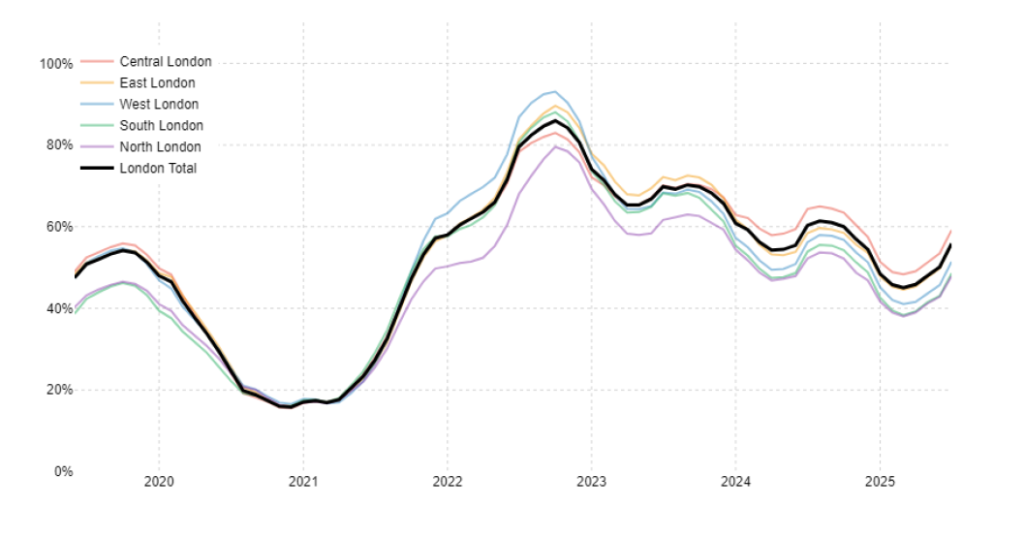
Source: CoStar hotel supply data (above panel) and Deckard short-term let data (below panel)
Note: to minimise noise and seasonal trends, single month occupancy rate data has been smoothed using a 12-month trailing average for the left-panel chart. As the right-panel chart uses a data series starting in q1 2019, a 9-month trailing average has instead been used, to preserve the q2 2019 data point needed for pre-pandemic comparisons.
This rise in demand for unserviced accommodation is mirrored in total unserviced accommodation nights data. Total nights spent in short-term rentals was 12.8 million in 2019, and rose to 15.6 million in 2024 (+22%). As a share of all visitor nights, this represents a rise from 8.7% to 10.2% (+1.5 ppt), i.e., following the pandemic, short-term rentals have captured a larger slice of London’s visitor accommodation demand, but serviced accommodation still constitutes the majority of demand.
Overall supply
Having looked at the state of demand, how has supply evolved in the same period?
London’s total visitor accommodation supply fell during the pandemic, entirely due to the supply of short-term rentals falling sharply – but as of Q1 2025, total supply has recovered and grown to roughly 286,000 rooms, a 6.2% increase over Q1 2019 (Figure A3).
The number of serviced rooms has grown steadily between Q1 2019 and Q1 2025, from 160,000 to 174,000 (+8.9%). Short-term rental supply has grown slightly from 110,000 to 112,000 (+2.3%) in the same period, following a period of sharp contraction during the pandemic period. As a result of this unequal growth, serviced accommodation has grown in market share, from 59.4% of all rooms in Q1 2019 to 60.9% in Q1 2025.
Figure A3: Accommodation room supply, by accommodation type
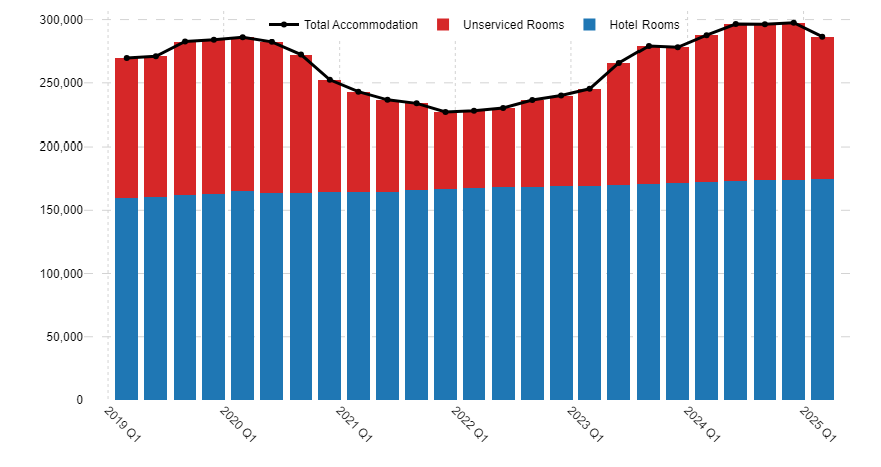
Source: Costar hotel supply data (left panel) and Deckard short-term let data (right panel)
Note: Unserviced accommodation room figures are calculated by aggregating Airbnb, booking.com, and vrbo listing-level data for “active listings” (properties with at least one booking in measurement period) by their room count.
Across London’s regions, supply growth has been uneven, with the sharpest swings in Central and West London (Figure A4). Central London saw serviced accommodation supply grow from around 97,000 to 105,000 rooms (+8%), while short-term rental supply fell sharply from 53,000 to 48,000 rooms (-10%). West London saw serviced accommodation supply increase from roughly 29,000 to 31,000 rooms (+6.8%) and short-term rental room supply fell from 12,000 to 11,000 rooms (-9.1%).
Figure A4: Serviced accommodation rooms (above panel), and Unserviced accommodation rooms (below panel) by London sub-region
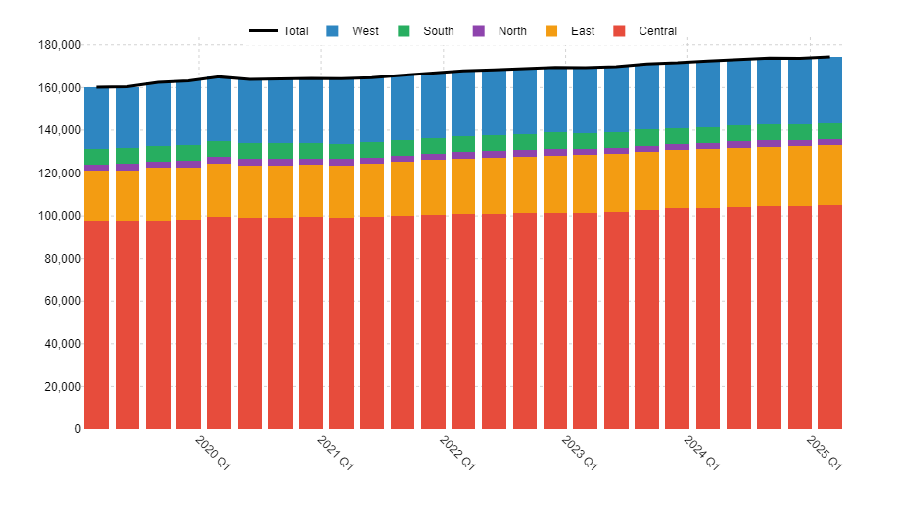
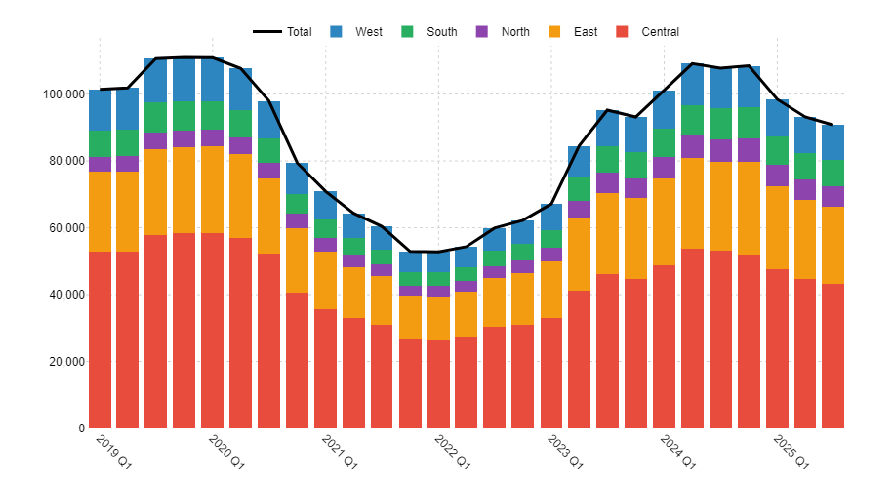
Source: Costar hotel supply data (above panel) and Deckard short-term let data (below panel)
Note: The London-wide totals in the right-panel chart (calculated by aggregating individual-borough data) is c. 8% higher than the London-wide total presented in figure 3 (which uses pre-coded London totals), due to listings data crossing borough boundaries, listings with no borough mapping, and rounding differences.
Looking at the latest few quarters of unserviced accommodation supply indicates that London’s short-term rental market is shrinking rapidly, with room supply consistently falling since Q4 2024 (Figure A4). This decline likely reflects tighter regulations and rising operating costs – and the resulting market exit from providers.
This shift, and the broader visitor accommodation picture, will be examined in detail in our forthcoming publication.