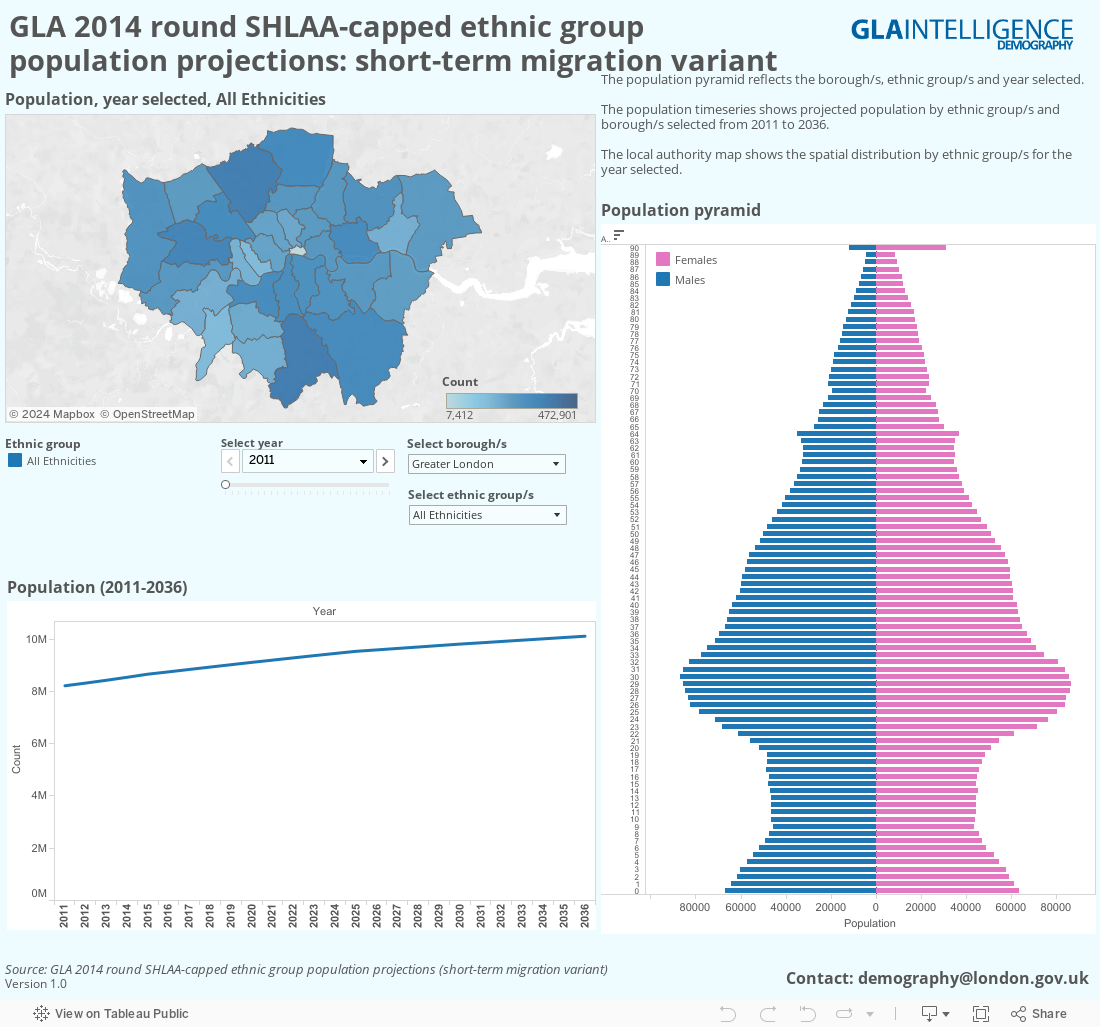
This Tableau visualisation allows users to view the GLA’s 2014 round SHLAA-capped ethnic group population projections: short-term migration variant.
The map shows the geographic distribution of an ethnic group/s for a chosen year whilst the population pyramid shows the age and gender split. A timeseries (2011-2036) chart provides an overview.
The raw data behind the visualisation as well as an accompanying Update of the findings can both be downloaded from the London Datastore.
Other GLA 2014 round ethnic group population projections can also be accessed via the London Datastore.