House Prices 2014-2015
The latest house prices data from the Land Registry (LR) is visualised in the Tableau report below. The LR publish details of every house sale in England and Wales, including sale price, whether freehold/leasehold, type of property, and full postcode for example. The GLA uses the postcode to calculate, which administrative or statistical area e.g. Wards or Super Output Areas, each house belongs to. This enables us to work out average house prices for small areas. The 2014 data from LR is now finalised so the revised prices for 2014 are now published on the datastore. However, LR publish data every month, and have published up to May 2015 and the report below includes some 2015 data.
There were changes to the way Stamp Duty works from 4 December 2014. This is unlikely to have affected many sales just after this time, but in the more recent data for April and May it is clear to see the impact these changes have had on sale prices. In the past there was a huge spike in the number of sales just below £250,000 because stamp duty rate jumped from 1% to 3% of the whole purchase price at that value, and to 4% at £500,000. The new rates of stamp duty only apply to the amount of the purchase price that falls within the particular duty band, making it more like income tax.
The new rates are:
Up to £125,000 : 0%
£125,001 to £250,000 : 2%
£250,001 to £925,000 : 5%
£925,001 to £1.5m : 10%
Above £1.5m : 12%
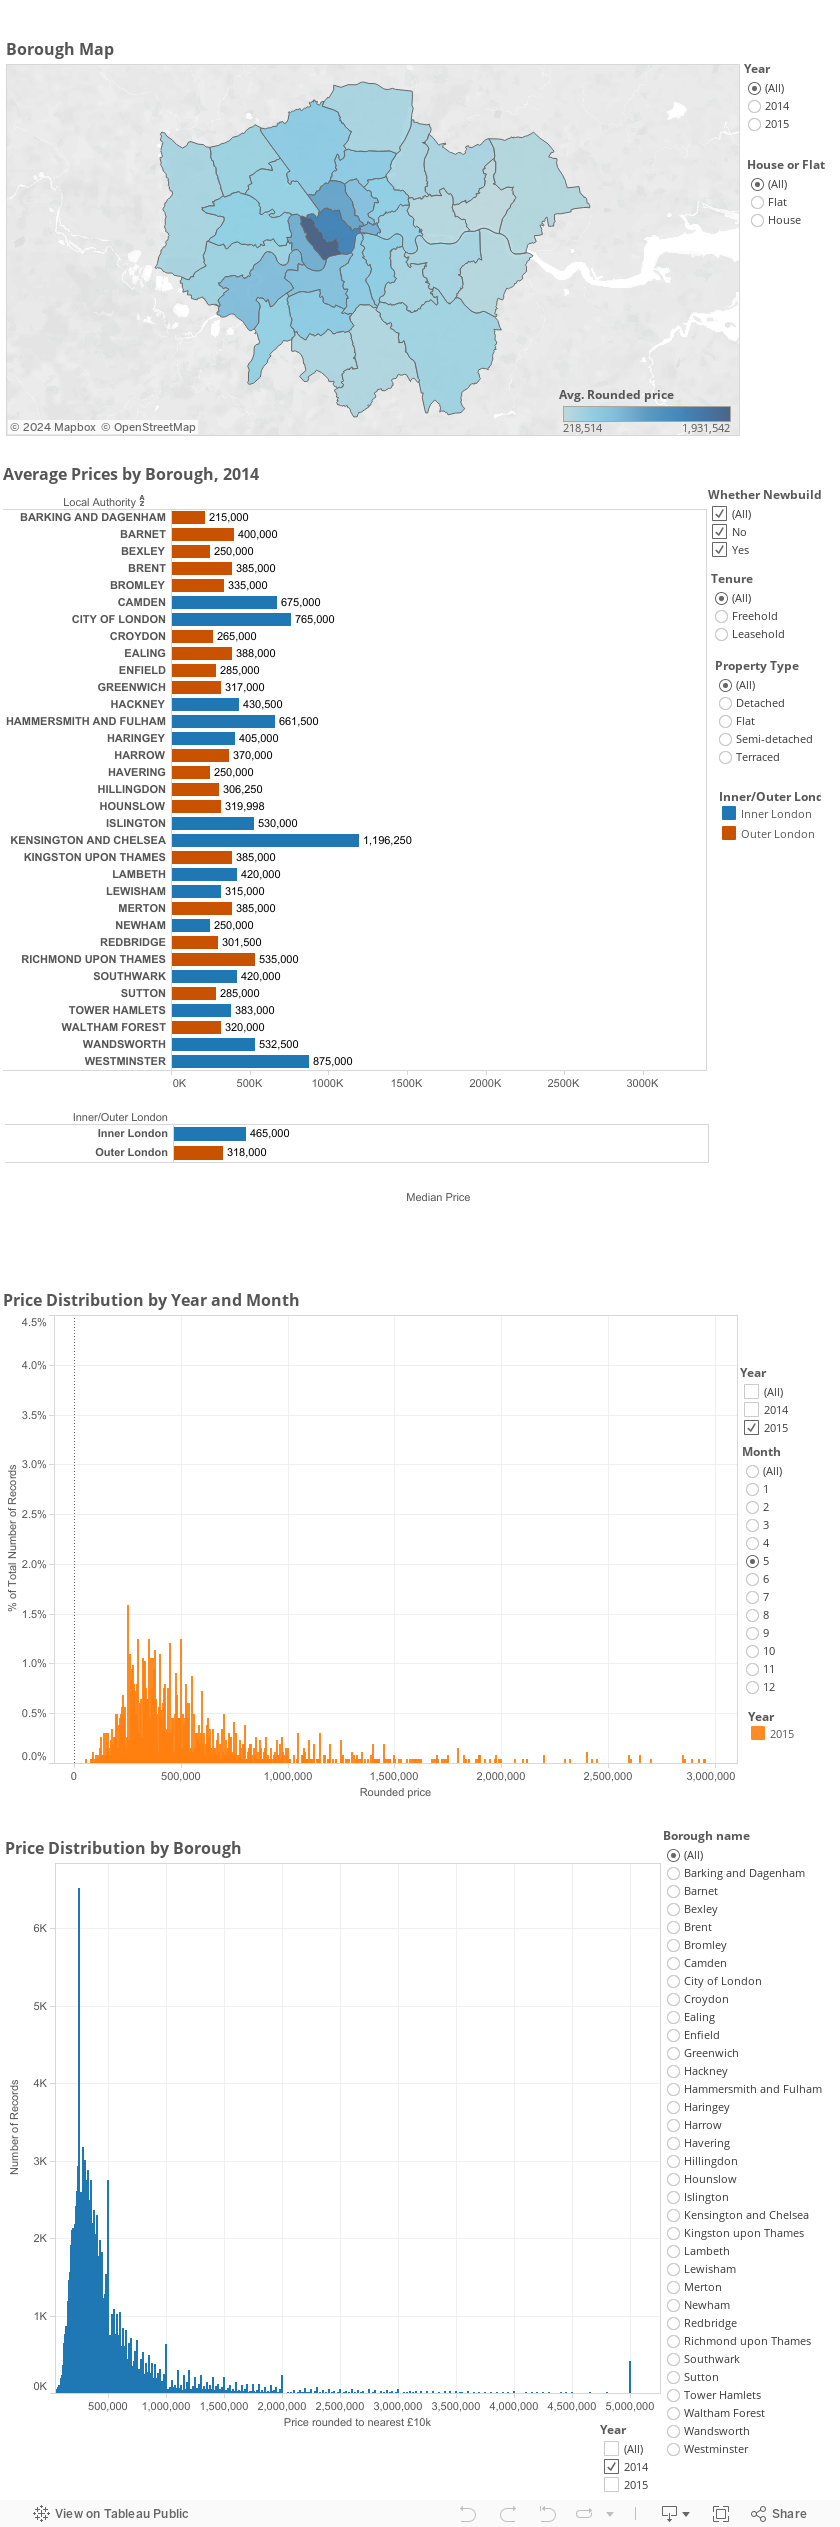
The chart second from bottom showing the number of sales of each value is far more smoothed out than it used to be. In 2014 over 5% of house sales were just below £250,000 (to the nearest £10k), but this fell to about 1.5% in May 2015. Comparing Feburary with May 2015 shows a big difference in this pattern. The average prices by borough chart can be filtered for whether newbuild, tenure and property type. In outer London, newbuilds are cheaper than older properties, though there is little difference in inner London, while buying a freehold property is far more expensive than leasehold. And comparing the price distribution of each borough reveals striking differences between them. Barking and Dagenham didn’t have a single sale above £500,000 in 2014, whereas in Kensington and Chelsea, most of the sales were above that amount. Note that for this chart all sales above £5,000,000 have been aggregated together so that the chart for some boroughs doesn’t stretch out too wide for the screen.